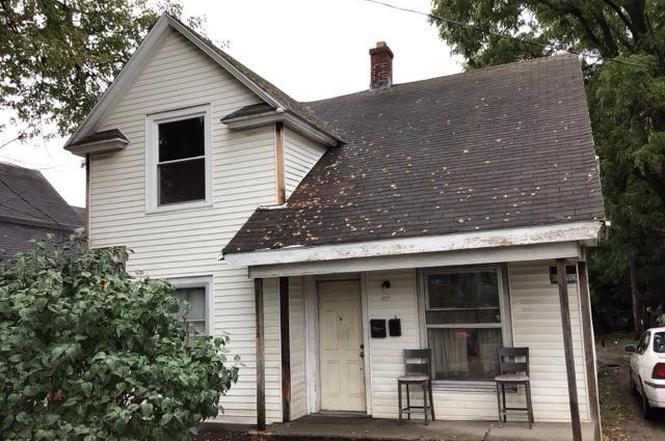
1459 Godfrey Ave SW · Wyoming, MI
Flood risk 1/10 · Minimal
- FEMA flood zone
- X (unshaded)
- Chance of flooding over 30 yrs
- 0.0%
- Est. flood insurance / yr
- $507 – $1,088
Fire risk 1/10 · Minimal
- Est. fire insurance / yr
- $784 – $1,456
Heat risk 2/10 · Minimal
- Hot days now (above 97°F)
- 7 days/yr
- Hot days in 30 yrs
- 16 days/yr
Wind risk 2/10 · Minimal
- Chance of severe wind over 30 yrs
- —
Air-quality risk 2/10 · Minimal
- Unhealthy air days now
- 2 days/yr
- Unhealthy air days in 30 yrs
- 2 days/yr
Risk factors via First Street. Map © Google.
Why this score? — see what drove the B grade
The composite is a weighted blend of 9 inputs, each scored 0–100. Each bar is that input's sub-score; the figure is the points it added to the 100-point composite (weight × sub-score).
- Cash flow +30.0/30.0
- ARV discount +15.0/15.0
- DSCR +10.0/10.0
- 1% rule +9.6/10.0
- Livability +3.9/5.0
- Rent growth +2.5/5.0
- Condition / age +2.5/5.0
- Schools +1.5/10.0
- Appreciation +0.0/10.0
$139,900
🖨 Deal sheet 📄 Offer letter ✓ Due diligence
Listing remarks MLS
Property is in poor condition and needs considerable work. Both Units are rented $525 Down-$500-upLower unit heated by FA Furnace upper with space heater. With some modifications could be converted into a single family dwelling.
Key facts
- 4,792 sq ft lot
- 4 parking spots
- Built 1900
Neighborhood map
What this means for you Summary
Snapshot
- This is a 3-bed/2.0-bath single-family listed at $140k.
Deal economics
- At list price, monthly cash flow is $649 ($8k/yr) — positive.
- The deal already cash-flows at list — no discount required.
- Meets the 1% rule at list price ($2k rent vs $140k).
- Recommended offer: $136k (3.0% below list) — sets the bar for market timing.
- Cap rate 11.9% vs local median 3.8% in Wyoming — top-decile yield for the area; either an underpriced asset or a hidden risk that comps aren't pricing in. Stress-test before assuming the spread holds.
Location & tenants
- Location reads 77/100 on livability (#126 in MI, #3,095 nationally) — a middle-class / working-renter tenant base. Strengths: cost of living A+, housing A+, health & safety A+; Watch: schools D+, crime D-, amenities F.
- Godfrey-Lee Public Schools (urban): math 9% / reading 27% proficiency, ranked #482 of 540 in MI (top 89%) — low school quality limits family demand, transient renter base, plan for 1-2y turnover; 82% free/reduced lunch — lower-income household profile, screen leases tightly.
- Market conditions: 88 active listings in the ZIP; 10 comparable units currently listed for rent nearby; rentals at typical pace (median 15d on market — plan ~3-4 weeks tenant-placement turnaround); 2,253 units permitted in Kent County in 2024 (969 in 5+ unit buildings).
- This rent runs 38% of the median local income ($65k/yr) — at the standard rent-burdened threshold; future hikes will face affordability resistance.
Forward outlook
- Local home prices are declining (-3.0%/yr); year-one equity from $967 of loan paydown is wiped out by about $4k of value loss. Plan a longer hold.
- Kent County population projected at +22% by 2050 — long-run rental-demand tailwind backs the buy-and-hold thesis.
- At projected returns (-3.0% appreciation + 3.0% rent growth), your $39k cash investment doubles in ~7 years — after that, you're playing with house money.
Negotiation context
- It's been on market 33 days — a 3% lower offer ($136k) is reasonable based on typical stale-listing flexibility.
- 4 sale attempts; this cycle's ask has dropped $20k (13%) from the opening price — seller is motivated, your offer sets the floor, not the list.
Risks & watch-outs
- Watch-outs: built in 1900 — expect roof / HVAC / electrical / plumbing capex.
Questions for the listing agent
- It's been on market 33 days. Have you received any prior offers? Is the seller open to a 3% concession, seller financing, or rate buy-down credit?
- Built in 1900 — when were the roof, HVAC, electrical panel, plumbing, and water heater last replaced?
- Is there a deadline driving the sale (1031 exchange, divorce, estate, relocation)? That informs how much negotiation room exists.
- Schools are D-rated, which usually means shorter tenancies and higher turnover. Who's the typical renter profile here, and what's been the actual vacancy rate?
- Crime grade is D in this area — have there been break-ins, vandalism, or insurance claims at this property in the last 3 years? What carrier currently insures it and at what premium?
- What's the average days-on-market for RENTAL listings here right now (not sales)? A rising rental-DOM trend means longer vacancies and softer asking-rent achievability than the comps imply.
- What's the recent tenant-quality profile in this submarket — average credit score on applications, eviction rate, late-payment / NSF rate, and stable-employment percentage? A property-management company in the area should have these aggregated.
- How much new for-sale + rental construction is in the pipeline within 1–3 miles? Heavy new supply typically softens prices + rents 12–24 months out; constrained supply supports both.
Investment metrics
- 1% rule
- 1.46% ✓
- Cap rate
- 11.86%
- Cash-on-cash
- 19.89%
- DSCR
- 1.88
- GRM
- 5.7
CMA / ARV
- ARV (on-the-fly)
- $263,640
- Comps found
- 12
Show comp detail 12 sales within ~0.75 mi
| Address | Dist | Beds/Ba | Sqft | Sold | Price | $/sf | Match |
|---|---|---|---|---|---|---|---|
| 1650 Wendler Ave SW | 0.37mi | 3/1.5 | 1,296 (-4%) | 1mo | $250,000 | $193 | 73 |
| 1945 Galewood Ave SW | 0.57mi | 3/1.5 | 1,337 (-1%) | 2mo | $265,000 | $198 | 68 |
| 1665 Martindale Ave SW | 0.49mi | 3/1.5 | 1,246 (-8%) | 4mo | $285,000 | $229 | 59 |
| 1061 Rathbone St SW | 0.14mi | 4/1.0 (+1) | 1,171 (-13%) | 6mo | $215,000 | $184 | 57 |
| 1674 Cleveland Ave SW | 0.44mi | 3/2.0 | 1,166 (-14%) | 1mo | $260,000 | $223 | 56 |
| 1736 Wendler Ave SW | 0.45mi | 3/1.0 | 1,248 (-8%) | 8mo | $239,900 | $192 | 56 |
| 1667 Judd Ave SW | 0.55mi | 3/1.0 | 1,440 (+6%) | 6mo | $238,100 | $165 | 54 |
| 1747 Martindale Ave SW | 0.55mi | 4/2.0 (+1) | 1,290 (-5%) | 9mo | $255,000 | $198 | 54 |
| 1217 Seneca St SW | 0.50mi | 4/1.0 (+1) | 1,289 (-5%) | 8mo | $210,000 | $163 | 53 |
| 1638 Berkley Ave SW | 0.68mi | 3/1.5 | 1,174 (-13%) | 0mo | $221,500 | $189 | 44 |
| 1739 Berkley Ave SW | 0.75mi | 2/1.5 (-1) | 1,282 (-5%) | 8mo | $250,000 | $195 | 43 |
| 2034 Roos Ave SW | 0.72mi | 3/1.0 | 1,156 (-14%) | 1mo | $283,000 | $245 | 37 |
Match score weights: distance 35% · size 25% · config 20% · recency 20%. Top-matched comps best support the ARV.
Projected returns pro-forma
-3.0% appreciation · 3.0% rent growth · sell at horizon
- IRR
- 12.0%
- Equity multiple
- 1.48×
- Total profit
- $18,709
- Equity at exit
- $20,860
- IRR
- 21.0%
- Equity multiple
- 2.78×
- Total profit
- $69,661
- Equity at exit
- $12,096
Cash invested: $39,172 (down + closing). Projections, not guarantees.
Landlord ↔ Tenant lean methodology
- Overall (STATE)
- 62 Landlord-Friendly
- State Michigan
- 62 Landlord-Friendly · EVEN
- County
- — inherits STATE
- City
- — inherits STATE
ZIP-level market 49509
- Active inventory
- 88
- Price-to-rent
- 5.7×
Monthly cashflow live
- Estimated rent
- $2,046 high interval (Pro) →
- Mortgage (P&I)
- −$734
- Tax from tax record
- −$175 /mo · $2,105/yr
- Insurance
- −$58
- HOA
- −$0
- Vacancy / Maint / Mgmt
- −$430
- Net cashflow
- $649
Break-even live
UW: 25.0% down · 7.5% · 30yr · 1.5% tax · 5.0% vac · 8.0% maint · 8.0% mgmt
Financing live
Cash to close
- Down payment
- $34,975
- Closing costs
- $4,197
- Reserves months
- —
- Total cash needed
- —
Loan-product check · same deal, 3 products live
Conventional
25% down · 7.5% · 30yr
- Down + closing
- —
- Monthly P&I
- —
- Monthly cashflow
- —
- DSCR
- —
- Eligible?
- —
Personal DTI + credit; lowest rate.
DSCR
20% down · 8.5% · 30yr
- Down + closing
- —
- Monthly P&I
- —
- Monthly cashflow
- —
- DSCR
- —
- Eligible?
- —
No personal income docs; deal must DSCR.
Hard money
10% down · 12.0% · 12mo
- Down + closing
- —
- Monthly P&I
- —
- Monthly cashflow
- —
- DSCR
- —
- Eligible?
- —
Short-term bridge; refi at stabilization.
Rent comps 10 comps
| Address | Beds | Baths | Sqft | Rent | $/sqft | DOM | Units | Dist |
|---|---|---|---|---|---|---|---|---|
| 1640 Wendler Ave SW Wyoming, MI | 4.0 | 2.5 | 1541 | $2,450 | $1.59 | 10d | 1 | 0.36mi |
| 1635 Cleveland Ave SW Wyoming, MI | 4.0 | 2.0 | 1740 | $2,495 | $1.43 | 43d | 1 | 0.42mi |
| 1019 Norwich Ave SW Grand Rapids, MI | 3.0 | 1.0 | 1214 | $1,595 | $1.31 | 3d | 1 | 0.55mi |
| 816 Kensington Ave SW Grand Rapids, MI | 3.0 | 1.0 | 1600 | $1,750 | $1.09 | 21d | 1 | 0.80mi |
| 242 Elm St SW Grand Rapids, MI | 2.0 | 1.5 | 1100 | $3,200 | $2.91 | 2d | 1 | 1.00mi |
| 2340 Michael Ave SW Unit 2280 4 Wyoming, MI | 2.0 | 1.0 | 900 | $1,200 | $1.33 | 19d | 1 | 1.07mi |
| 400 Grant St SW Unit 2 Grand Rapids, MI | 2.0 | 1.0 | 1000 | $1,500 | $1.50 | 2d | 1 | 1.23mi |
| 470 Market Ave SW Grand Rapids, MI | 2.0 | 1.0–2.0 | 622 | $2,090 | $3.36 | 2d | 17 | 1.27mi |
| 2515 McKee Ave SW Unit 4 Wyoming, MI | 2.0 | 1.0 | 900 | $1,300 | $1.44 | 14d | 1 | 1.32mi |
| 2633 Woodward Ave SW Apt B Wyoming, MI | 2.0 | 1.0 | 950 | $1,295 | $1.36 | 43d | 1 | 1.50mi |
Listing history 10 events
-
2026-03-27status Pending
Show marketing remark (228 chars)
Property is in poor condition and needs considerable work. Both Units are rented $525 Down-$500-upLower unit heated by FA Furnace upper with space heater. With some modifications could be converted into a single family dwelling.
-
2026-03-27status Pending 228-char remark
Show marketing remark (228 chars)
Property is in poor condition and needs considerable work. Both Units are rented $525 Down-$500-upLower unit heated by FA Furnace upper with space heater. With some modifications could be converted into a single family dwelling.
-
2026-03-21price $139,900 228-char remark
Show marketing remark (228 chars)
Property is in poor condition and needs considerable work. Both Units are rented $525 Down-$500-upLower unit heated by FA Furnace upper with space heater. With some modifications could be converted into a single family dwelling.
-
2026-03-21price $139,900
Show marketing remark (228 chars)
Property is in poor condition and needs considerable work. Both Units are rented $525 Down-$500-upLower unit heated by FA Furnace upper with space heater. With some modifications could be converted into a single family dwelling.
-
2026-03-21status Active
Show marketing remark (228 chars)
Property is in poor condition and needs considerable work. Both Units are rented $525 Down-$500-upLower unit heated by FA Furnace upper with space heater. With some modifications could be converted into a single family dwelling.
-
2026-03-21status Active 228-char remark
Show marketing remark (228 chars)
Property is in poor condition and needs considerable work. Both Units are rented $525 Down-$500-upLower unit heated by FA Furnace upper with space heater. With some modifications could be converted into a single family dwelling.
-
2026-03-17status Pending
Show marketing remark (228 chars)
Property is in poor condition and needs considerable work. Both Units are rented $525 Down-$500-upLower unit heated by FA Furnace upper with space heater. With some modifications could be converted into a single family dwelling.
-
2026-03-17status Pending 228-char remark
Show marketing remark (228 chars)
Property is in poor condition and needs considerable work. Both Units are rented $525 Down-$500-upLower unit heated by FA Furnace upper with space heater. With some modifications could be converted into a single family dwelling.
-
2026-02-18$159,900 Active
Show marketing remark (228 chars)
Property is in poor condition and needs considerable work. Both Units are rented $525 Down-$500-upLower unit heated by FA Furnace upper with space heater. With some modifications could be converted into a single family dwelling.
-
2026-02-18$159,900 Active 228-char remark
Show marketing remark (228 chars)
Property is in poor condition and needs considerable work. Both Units are rented $525 Down-$500-upLower unit heated by FA Furnace upper with space heater. With some modifications could be converted into a single family dwelling.
ⓘ Source: listings_history table (triggers on properties + properties_extension) + one-shot
backfill from property_details.listing_events for pre-trigger history.
Tax reassessment forecast MI · Partial reset (capped growth)
- Current annual tax
- $2,105 · $175/mo
- Projected year-2 tax
- $2,130 · $177/mo
- Expected delta
- +$25/yr (+$2/mo · 1.2%)
ⓘ Screening estimate from a state-policy table — verify with the county assessor before closing.
Climate risk First Street
- Flood 1/10 Low FEMA zone X (unshaded) · 0% chance over 30 yrs
- Wildfire 1/10 Low
- Heat 2/10 Low 7 d/yr ≥97°F today · 16 d/yr by 30 yrs out
- Wind 2/10 Low
- Air quality 2/10 Low 2 unhealthy d/yr today · 2 by 30 yrs out
Nearby sold comps map
Loading sold comps map…
Walkable amenities ~0.75 mi
Loading nearby amenities…
Taxation est. · year 1
- Rental income
- $24,555
- − Mortgage interest
- −$7,837
- − Property taxes
- −$2,105
- − Insurance
- −$700
- − Repairs & maintenance
- −$1,964
- − Management
- −$1,964
- − Depreciation
- −$4,070
- Taxable income
- $5,916
- Est. tax owed @ 24.0%
- −$1,420
- After-tax cash flow
- $6,371/yr
For passive investors: Depreciation is non-cash, so a rental often shows a tax loss while cash-flowing — sheltering income. Rental losses are passive: they offset passive income freely, and up to $25,000/yr can offset ordinary (W-2) income if you actively participate and your MAGI is under $100k (phasing out to $0 by $150k); unused losses carry forward. On sale, claimed depreciation is recaptured at up to 25%, and gains may owe capital-gains tax (a 1031 exchange can defer both). Figures are a year-1 estimate at your 24.0% rate — not tax advice; consult a CPA.
Schools (NCES district)
- District
- Godfrey-Lee Public Schools
- NCES district ID
- 2616080
- Math proficiency
- 9% ▼ -1.00%
- Reading proficiency
- 27% ▲ 5.00%
- Median HH income
- $39,436
- Composite
- 15.17/100
- National rank
- #9345
- State rank
- #482 of 540 in MI
Livability — Wyoming
- Score
- 77/100
- State rank
- #126
- US rank
- #3095
Category grades
Schools grade is shown separately in the Schools card above.
Census & demographics
- Census place
- Wyoming, MI
- County
- Kent County · 533,805 people
- City population
- 56,117
- Metro
- Grand Rapids-Kentwood, MI
- Population (ZIP)
- 28,152
- Household income
- $65,132
- Rent vs Own
- Severe rent burden
- 681.0
Population outlook (Kent County) Hauer SSP2
- Today (2025)
- 712,484 people
- By 2030
- 748,618 · +5.1%
- By 2040
- 814,777 · +14.4%
- By 2050
- 868,556 · +21.9%
- By 2075
- 966,487 · +35.7%
- By 2100
- 967,975 · +35.9%
Race, ethnicity, and origin ACS 2023
- Neighborhood character
- Diverse neighborhood (Simpson 0.64)
- Race & ethnicity
- White 49% Hispanic / Latino 34% Two or more races 20% Black 10% Native American 2% Asian 2%
- Hispanic origin (detail)
- Mexican 20% Puerto Rican 2% Cuban 2% Dominican 2%
- Common ancestry
- Iranian 12% Romanian 6% Lithuanian 2%
- Foreign-born
- 17% · Canada, Vietnam
- Languages at home
- 70% English-only · Spanish 26% Vietnamese 1%
Political lean MEDSL · Kent
- 2024 margin
- Lean D (+5.4) · D 51.8% · R 46.5% · Other 1.7%
- 2008→2024 swing
- +4.8pp toward D · 2008: 0.5pp · 2024: 5.4pp
- All cycles
- 2024: D+5.4 2020: D+6.1 2016: R+3.1 2012: R+7.9 2008: D+0.5
Not yet ingested
- Civics
- —
Market trends
- HPI YoY
- ▼ -255.45%
- Current HPI
- 345.1978
- Rent YoY
- —
- Metro
- Grand Rapids-Kentwood, MI
- State GDP YoY
- ▲ 1.37%
- F500 in state
- 28
Industry mix (Fortune 500 HQ in MI)
| Industry | F500 HQs | Revenue |
|---|---|---|
| Automotive Parts | 3 | $48B |
|
||
| Automotive | 2 | $372B |
|
||
| Chemicals | 1 | $45B |
|
||
| Automotive Retail | 1 | $29B |
|
||
| Healthcare / Medical Devices | 1 | $23B |
|
||
| Automotive Technology | 1 | $20B |
|
||
Price history
-12.5% since first listed10 events — show timeline
- 2026-03-27 Pending — REALCOMP
- 2026-03-27 Pending — MiRealSource-MiMLS
- 2026-03-21 Price Changed $139,900 MiRealSource-MiMLS
- 2026-03-21 Price Changed $139,900 REALCOMP
- 2026-03-21 Relisted — REALCOMP
- 2026-03-21 Relisted — MiRealSource-MiMLS
- 2026-03-17 Pending — REALCOMP
- 2026-03-17 Pending — MiRealSource-MiMLS
- 2026-02-18 Listed $159,900 MiRealSource-MiMLS
- 2026-02-18 Listed $159,900 REALCOMP
Property tax history
+3.0%/yrLatest (2025): $2,105 · -2.2% YoY. Source: county tax records.
Cash-flow waterfall
monthlySold comps — $/sqft
last 12 mo · ≤1 miLoading sold comps…