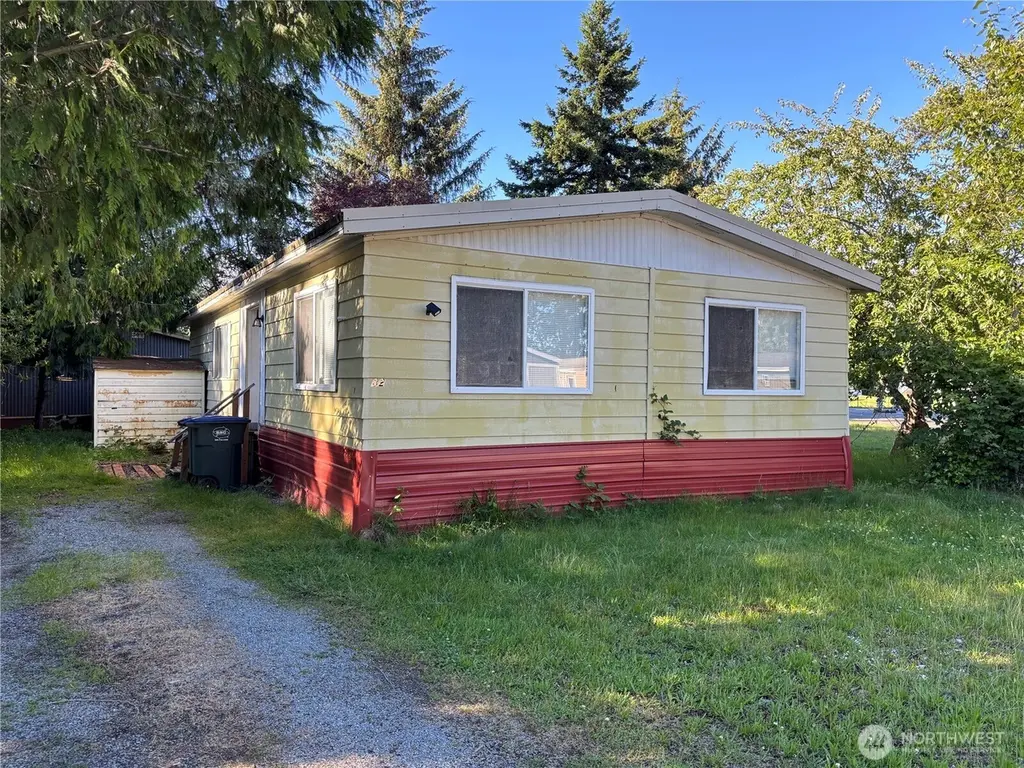
4015 Eliza Ave #82 · Bellingham, WA
Flood risk 1/10 · Minimal
- FEMA flood zone
- X (unshaded)
- Chance of flooding over 30 yrs
- 0.0%
- Est. flood insurance / yr
- $507 – $1,088
Fire risk 1/10 · Minimal
- Est. fire insurance / yr
- $604 – $1,122
Heat risk 2/10 · Minimal
- Hot days now (above 85°F)
- 7 days/yr
- Hot days in 30 yrs
- 17 days/yr
Wind risk 1/10 · Minimal
- Chance of severe wind over 30 yrs
- —
Air-quality risk 6/10 · Moderate
- Unhealthy air days now
- 9 days/yr
- Unhealthy air days in 30 yrs
- 9 days/yr
Risk factors via First Street. Map © Google.
Why this score? — see what drove the C- grade
The composite is a weighted blend of 9 inputs, each scored 0–100. Each bar is that input's sub-score; the figure is the points it added to the 100-point composite (weight × sub-score).
- Cash flow +15.0/30.0
- ARV discount +15.0/15.0
- 1% rule +5.0/10.0
- DSCR +5.0/10.0
- Schools +4.8/10.0
- Livability +4.0/5.0
- Rent growth +2.6/5.0
- Condition / age +2.5/5.0
- Appreciation +0.0/10.0
$50,000
🖨 Deal sheet (PDF) 📄 Offer letter ✓ Due diligence
Listing remarks
Opportunity awaits in Bakerview Estates! This 3-bedroom, 2-bath manufactured home offers a fantastic chance to build sweat equity in a desirable location. This home is a fixer-upper and is in need of repair as well as updating but features a functional floor plan and strong potential for the right buyer. Whether you’re looking for an affordable primary residence, investment property, or renovation project, this is a value-packed opportunity. Conveniently located near shopping, dining, schools, and everyday amenities. Owner financing may be available with 25% down, providing added flexibility for qualified buyers. Bring your vision and unlock the potential of this home!
Key facts
- Desirable location
- 3 parking spots
- Built 1978
Tags
Property features AI
Finance
- Other: Calculated building area 1,139 (source: MLS)
- Financial info: Cash offers only
- HOA & community: Land lease: $998/month; Manufactured home park approved for sale
Exterior
- Parking: 3 uncovered open parking spaces
- Utilities: Public water; Electric and wood energy sources; Electric water heater
- Home design: Manufactured double-wide home (Kingswood); One level; Fixer condition
- Construction: Metal roof; Metal/vinyl construction
- Exterior features: Metal/vinyl exterior; Paved lot
Interior
- Bedrooms: 3 bedrooms
- Bathrooms: 1 full bath; 1 three-quarter bath
- Heating & cooling: Forced air heating; Stove / free-standing heating; No cooling
- Interior features: Water heater (electric, located with outside access)
Neighborhood map
What this means for you Summary
Snapshot
- This is a 2-bed/2.0-bath manufactured listed at $50k.
Deal economics
- At list price, monthly cash flow is $1k ($16k/yr) — positive.
- The deal already cash-flows at list — no discount required.
- Meets the 1% rule at list price ($2k rent vs $50k).
- Cap rate 38.9% vs local median 2.0% in Bellingham — top-decile yield for the area; either an underpriced asset or a hidden risk that comps aren't pricing in. Stress-test before assuming the spread holds.
Location & tenants
- Location reads 80/100 on livability (#102 in WA, #1,947 nationally) — a professional / high-income tenant draw. Strengths: amenities A+, commute A+, health & safety A+; Watch: crime F, cost of living F.
- Bellingham School District (urban): math 47% / reading 63% proficiency, ranked #106 of 291 in WA (top 36%) — acceptable for families but not a draw, mixed tenant base, ~2y average lease.
- Market conditions: Rents flat; 378 active listings in the ZIP; 30 comparable units currently listed for rent nearby; rentals at typical pace (median 14d on market — plan ~3-4 weeks tenant-placement turnaround); solid renter incomes; 1,190 units permitted in Whatcom County in 2024 (327 in 5+ unit buildings).
- This rent runs 32% of the median local income ($79k/yr) — at the standard rent-burdened threshold; future hikes will face affordability resistance.
Forward outlook
- Local home prices are declining (-3.0%/yr); year-one equity from $346 of loan paydown is wiped out by about $2k of value loss. Plan a longer hold.
- Whatcom County population projected at +28% by 2050 — long-run rental-demand tailwind backs the buy-and-hold thesis.
- At projected returns (-3.0% appreciation + 0.4% rent growth), your $14k cash investment doubles in ~1 year — after that, you're playing with house money.
Negotiation context
- Only 5 days on market — expect competitive offers; lowballing is unlikely to land.
Questions for the listing agent
- Built in 1978 — when were the roof, HVAC, electrical panel, plumbing, and water heater last replaced?
- Is there a deadline driving the sale (1031 exchange, divorce, estate, relocation)? That informs how much negotiation room exists.
- Schools are B-rated — typically a magnet for longer-tenancy family renters. What's the average tenant stay here, and is there a school-zone premium baked into asking?
- Crime grade is F in this area — have there been break-ins, vandalism, or insurance claims at this property in the last 3 years? What carrier currently insures it and at what premium?
- What's the average days-on-market for RENTAL listings here right now (not sales)? A rising rental-DOM trend means longer vacancies and softer asking-rent achievability than the comps imply.
- What's the recent tenant-quality profile in this submarket — average credit score on applications, eviction rate, late-payment / NSF rate, and stable-employment percentage? A property-management company in the area should have these aggregated.
- How much new for-sale + rental construction is in the pipeline within 1–3 miles? Heavy new supply typically softens prices + rents 12–24 months out; constrained supply supports both.
Investment metrics
- 1% rule
- 4.18% ✓
- Cap rate
- 38.91%
- Cash-on-cash
- 116.48%
- DSCR
- 6.18
- GRM
- 2.0
CMA / ARV
- ARV (on-the-fly)
- $71,757
- Comps found
- 1
Show comp detail 1 sale within ~0.75 mi
| Address | Dist | Beds/Ba | Sqft | Sold | Price | $/sf | Match |
|---|---|---|---|---|---|---|---|
| 4015 Eliza Ave #120 | 0.12mi | 2/2.0 | 1,152 (+1%) | 4mo | $72,500 | $63 | 89 |
Match score weights: distance 35% · size 25% · config 20% · recency 20%. Top-matched comps best support the ARV.
Projected returns pro-forma
-3.0% appreciation · 0.42% rent growth · sell at horizon
- IRR
- —
- Equity multiple
- 6.23×
- Total profit
- $73,155
- Equity at exit
- $7,455
- IRR
- —
- Equity multiple
- 12.04×
- Total profit
- $154,528
- Equity at exit
- $4,323
Cash invested: $14,000 (down + closing). Projections, not guarantees.
Landlord ↔ Tenant lean methodology
- Overall (STATE)
- 28 Tenant-Leaning
- State Washington
- 28 Tenant-Leaning · D+8
- County
- — inherits STATE
- City
- — inherits STATE
ZIP-level market 98226
- Rents YoY
- 0.4%
- Active inventory
- 378
- Price-to-rent
- 2.0×
Monthly cashflow live
- Estimated rent
- $2,090 high interval (Pro) →
- Mortgage (P&I)
- −$262
- Tax from tax record
- −$9 /mo · $112/yr
- Insurance
- −$21
- HOA
- −$0
- Vacancy / Maint / Mgmt
- −$439
- Net cashflow
- $1,359
Break-even live
Sensitivity live
| Price | -10% $1,387 | -5% $1,373 | +0% $1,359 | +5% $1,345 | +10% $1,331 |
|---|---|---|---|---|---|
| Rent | -10% $1,194 | -5% $1,276 | +0% $1,359 | +5% $1,441 | +10% $1,524 |
| Rate | -1.0pp $1,384 | -0.5pp $1,372 | base $1,359 | +0.5pp $1,346 | +1.0pp $1,333 |
UW: 25.0% down · 7.5% · 30yr · 1.5% tax · 5.0% vac · 8.0% maint · 8.0% mgmt
Financing live
Cash to close
- Down payment
- $12,500
- Closing costs
- $1,500
- Reserves months
- —
- Total cash needed
- —
Loan-product check · same deal, 3 products live
Conventional
25% down · 7.5% · 30yr
- Down + closing
- —
- Monthly P&I
- —
- Monthly cashflow
- —
- DSCR
- —
- Eligible?
- —
Personal DTI + credit; lowest rate.
DSCR
20% down · 8.5% · 30yr
- Down + closing
- —
- Monthly P&I
- —
- Monthly cashflow
- —
- DSCR
- —
- Eligible?
- —
No personal income docs; deal must DSCR.
Hard money
10% down · 12.0% · 12mo
- Down + closing
- —
- Monthly P&I
- —
- Monthly cashflow
- —
- DSCR
- —
- Eligible?
- —
Short-term bridge; refi at stabilization.
Rent comps 30 comps
| Address | Beds | Baths | Sqft | Rent | $/sqft | DOM | Units | Dist |
|---|---|---|---|---|---|---|---|---|
| 3928 Northwest Ave Bellingham, WA | 2.0 | 1.0–2.0 | 736 | $2,370 | $3.22 | 14d | 4 | 0.19mi |
| 4018 Northwest Ave Bellingham, WA | 2.0 | 1.5 | 820 | $1,600 | $1.95 | 14d | 1 | 0.21mi |
| 525 Darby Dr Bellingham, WA | 1.0–2.0 | 1.0 | 891 | $2,680 | $3.01 | 14d | 5 | 0.30mi |
| 2600 Alderwood Ave Bellingham, WA | 2.0 | 1.0 | 770 | $1,650 | $2.14 | 21d | 1 | 0.47mi |
| 263 W Bakerview Rd #209 Bellingham, WA | 1.0 | 1.0 | 828 | $1,800 | $2.17 | 14d | 1 | 0.49mi |
| 3412 Northwest Ave Bellingham, WA | 3.0 | 2.5 | 1045 | $2,505 | $2.40 | 14d | 2 | 0.57mi |
| 704 Fuchsia Loop Bellingham, WA | 1.0 | 1.5 | 750 | $1,600 | $2.13 | 21d | 1 | 0.61mi |
| 3206 W Maplewood Ave Unit 101 Bellingham, WA | 2.0 | 1.0 | 800 | $1,595 | $1.99 | 21d | 1 | 0.66mi |
| 3315 Galena Ln Unit 3315-201 Bellingham, WA | 2.0 | 1.5 | 840 | $1,750 | $2.08 | 21d | 1 | 0.68mi |
| 3327 Northwest Ave Unit 07 Bellingham, WA | 2.0 | 1.0 | 754 | $1,500 | $1.99 | 21d | 1 | 0.69mi |
| 2700 W Maplewood Ave Unit 302 Bellingham, WA | 2.0 | 1.5 | 750 | $1,795 | $2.39 | 21d | 1 | 0.70mi |
| 3303 Hilda Ln Unit 3303 109 Bellingham, WA | 3.0 | 1.5 | 1064 | $2,010 | $1.89 | 21d | 1 | 0.70mi |
| 2605 W Maplewood Ave Bellingham, WA | 2.0 | 1.0–2.0 | 894 | $1,850 | $2.07 | 14d | 1 | 0.83mi |
| 1300 Mahogany Ave Bellingham, WA | 2.0 | 1.0–2.5 | 913 | $2,855 | $3.13 | 14d | 11 | 0.83mi |
| 4355 Fuchsia Dr Bellingham, WA | 2.0 | 1.0–2.5 | 809 | $2,200 | $2.72 | 14d | 16 | 0.86mi |
| 4233 Traverse Dr Bellingham, WA | 2.0 | 2.5 | 1007 | $2,500 | $2.48 | 14d | 5 | 0.87mi |
| 430 W Stuart Rd Bellingham, WA | 2.0 | 1.0–2.0 | 651 | $2,214 | $3.40 | 14d | 14 | 0.98mi |
| 3900 Deemer Rd Unit 109 Bellingham, WA | 2.0 | 2.0 | 867 | $1,850 | $2.13 | 21d | 1 | 1.01mi |
| 420 W Stuart Rd Bellingham, WA | 2.0 | 1.0–2.0 | 668 | $1,974 | $2.96 | 14d | 14 | 1.04mi |
| 200- Tull Pl Bellingham, WA | 3.0 | 2.5 | 1263 | $2,595 | $2.05 | 14d | 13 | 1.06mi |
| 256 Prince Ave Unit 402 Bellingham, WA | 2.0 | 2.0 | 846 | $2,200 | $2.60 | 14d | 1 | 1.09mi |
| 256 Prince Ave Unit 417 Bellingham, WA | 2.0 | 2.0 | 948 | $2,100 | $2.22 | 21d | 1 | 1.09mi |
| 273 Tull Ct Bellingham, WA | 2.0–3.0 | 1.5–2.0 | 1102 | $1,950 | $1.77 | 14d | 5 | 1.12mi |
| 3955 Primrose Ln Unit 25-307 Bellingham, WA | 2.0 | 1.0 | 905 | $1,725 | $1.91 | 21d | 1 | 1.16mi |
| 1500 E Victor St Unit 7 Bellingham, WA | 2.0 | 1.0 | 775 | $1,850 | $2.39 | 21d | 1 | 1.16mi |
| 4380 Tull Rd Bellingham, WA | 1.0–2.0 | 1.0–1.5 | 697 | $1,675 | $2.40 | 21d | 3 | 1.20mi |
| 3128 Greenwood Ave Bellingham, WA | 3.0 | 1.5 | 1040 | $3,000 | $2.88 | 21d | 1 | 1.26mi |
| 545 E Kellogg Rd Bellingham, WA | 3.0 | 1.0–2.0 | 747 | $2,017 | $2.70 | 14d | 14 | 1.33mi |
| 3429 Redwood Ave Bellingham, WA | 3.0 | 2.0 | 1403 | $2,700 | $1.92 | 14d | 1 | 1.36mi |
| 3021 Bennett Dr Bellingham, WA | 3.0 | 1.5 | 1104 | $2,800 | $2.54 | 21d | 1 | 1.46mi |
Listing history 6 events
-
2026-06-18days on market $50,000 Active 5 DOM
-
2026-06-17days on market $50,000 Active 4 DOM
-
2026-06-16days on market $50,000 Active 3 DOM
-
2026-06-15days on market $50,000 Active 2 DOM
-
2026-06-14remarks 677-char remark
-
2026-06-14$50,000 Active 1 DOM
ⓘ Source: listings_history table (triggers on properties + properties_extension) + one-shot
backfill from property_details.listing_events for pre-trigger history.
Tax reassessment forecast WA · Resets to sale price
- Current annual tax
- $112 · $9/mo
- Projected year-2 tax
- $490 · $41/mo
- Expected delta
- +$378/yr (+$32/mo · 338.2%)
ⓘ Screening estimate from a state-policy table — verify with the county assessor before closing.
Climate risk First Street
- Flood 1/10 Low FEMA zone X (unshaded) · 0% chance over 30 yrs
- Wildfire 1/10 Low
- Heat 2/10 Low 7 d/yr ≥85°F today · 17 d/yr by 30 yrs out
- Wind 1/10 Low
- Air quality 6/10 Major 9 unhealthy d/yr today · 9 by 30 yrs out
Nearby sold comps map
Loading sold comps map…
Walkable amenities ~0.75 mi
Loading nearby amenities…
Taxation est. · year 1
- Rental income
- $25,082
- − Mortgage interest
- −$2,801
- − Property taxes
- −$112
- − Insurance
- −$250
- − Repairs & maintenance
- −$2,007
- − Management
- −$2,007
- − Depreciation
- −$1,455
- Taxable income
- $16,452
- Est. tax owed @ 24.0%
- −$3,948
- After-tax cash flow
- $12,358/yr
For passive investors: Depreciation is non-cash, so a rental often shows a tax loss while cash-flowing — sheltering income. Rental losses are passive: they offset passive income freely, and up to $25,000/yr can offset ordinary (W-2) income if you actively participate and your MAGI is under $100k (phasing out to $0 by $150k); unused losses carry forward. On sale, claimed depreciation is recaptured at up to 25%, and gains may owe capital-gains tax (a 1031 exchange can defer both). Figures are a year-1 estimate at your 24.0% rate — not tax advice; consult a CPA.
Schools (NCES district)
- District
- Bellingham School District
- NCES district ID
- 5300420
- Math proficiency
- 47% ▼ -6.00%
- Reading proficiency
- 63% ▼ -1.00%
- Median HH income
- $47,678
- Composite
- 48.49/100
- National rank
- #4632
- State rank
- #106 of 291 in WA
Livability — Bellingham
- Score
- 80/100
- State rank
- #102
- US rank
- #1947
Category grades
Schools grade is shown separately in the Schools card above.
Census & demographics
- Census place
- Bellingham, WA
- County
- Whatcom County · 209,776 people
- City population
- 130,296
- Metro
- Bellingham, WA
- Population (ZIP)
- 46,782
- Household income
- $79,375
- Rent vs Own
- Severe rent burden
- 2061.0
Population outlook (Whatcom County) Hauer SSP2
- Today (2025)
- 240,408 people
- By 2030
- 254,667 · +5.9%
- By 2040
- 281,365 · +17.0%
- By 2050
- 307,592 · +27.9%
- By 2075
- 375,576 · +56.2%
- By 2100
- 421,637 · +75.4%
Race, ethnicity, and origin ACS 2023
- Neighborhood character
- Predominantly White (72%)
- Race & ethnicity
- White 72% Two or more races 10% Hispanic / Latino 9% Asian 6% Native American 5% Black 1%
- Hispanic origin (detail)
- Mexican 6%
- Common ancestry
- Portuguese 6% Iranian 4% Slovak 4%
- Foreign-born
- 11% · Canada, China, Vietnam
- Languages at home
- 88% English-only · Spanish 5% Chinese 2% Other Indo-European 1%
Political lean MEDSL · Whatcom
- 2024 margin
- Strong D (+24.9) · D 60.8% · R 35.9% · Other 3.3%
- 2008→2024 swing
- +6.9pp toward D · 2008: 18.0pp · 2024: 24.9pp
- All cycles
- 2024: D+24.9 2020: D+23.9 2016: D+17.7 2012: D+12.1 2008: D+18.0
Not yet ingested
- Civics
- —
Market trends
- HPI YoY
- ▼ -573.37%
- Current HPI
- 406.1085
- Rent YoY
- ▲ 0.42%
- Metro
- Bellingham, WA
- State GDP YoY
- ▲ 4.65%
- F500 in state
- 22
Industry mix (Fortune 500 HQ in WA)
| Industry | F500 HQs | Revenue |
|---|---|---|
| Retail | 2 | $269B |
|
||
| Technology / Retail | 1 | $638B |
|
||
| Technology | 1 | $245B |
|
||
| Telecommunications | 1 | $38B |
|
||
| Food / Beverage | 1 | $36B |
|
||
| Automotive / Trucks | 1 | $34B |
|
||
Price history
1 event — show timeline
- 2026-06-13 Listed $50,000 NWMLS as Distributed by MLS Grid
Property tax history
-0.6%/yrLatest (2026): $112 · +6.6% YoY. Source: county tax records.
Cash-flow waterfall
monthlySold comps — $/sqft
last 12 mo · ≤1 miLoading sold comps…