 Duplex
151 Pantry Rd · Hatfield, MA
Flood risk 1/10 · Minimal
- FEMA flood zone
- X
- Chance of flooding over 30 yrs
- 0.0%
- Est. flood insurance / yr
- $507 – $1,088
Fire risk 3/10 · Minor
- Est. fire insurance / yr
- $915 – $1,699
Heat risk 3/10 · Minor
- Hot days now (above 97°F)
- 6 days/yr
- Hot days in 30 yrs
- 13 days/yr
Wind risk 4/10 · Minor
- Chance of severe wind over 30 yrs
- 14.0%
Air-quality risk 2/10 · Minimal
- Unhealthy air days now
- 1 days/yr
- Unhealthy air days in 30 yrs
- 1 days/yr
Risk factors via First Street. Map © Google.
Why this score? — see what drove the C grade
The composite is a weighted blend of 9 inputs, each scored 0–100. Each bar is that input's sub-score; the figure is the points it added to the 100-point composite (weight × sub-score).
- Cash flow +23.4/30.0
- ARV discount +8.4/15.0
- DSCR +7.5/10.0
- 1% rule +5.6/10.0
- Livability +3.7/5.0
- Schools +3.6/10.0
- Rent growth +2.5/5.0
- Condition / age +2.5/5.0
- Appreciation +0.0/10.0
$459,900
🖨 Deal sheet 📄 Offer letter ✓ Due diligence
Multi-family units
County records classify this as Multi-Family (2-4 Unit). Listing-text estimate: 2 units. confirmed
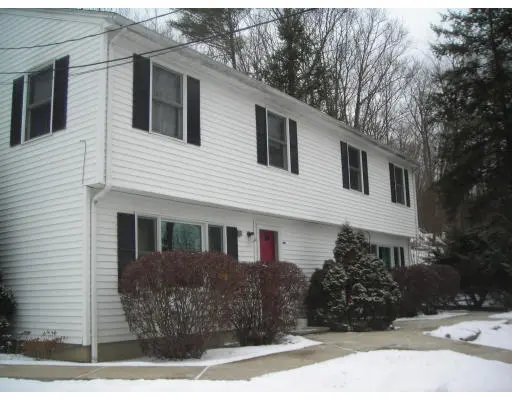
Listing remarks MLS
Desirable Hatfield address for this very well kept "duplex" on a 5 acre wooded site. "Left / Right" set-up ... offers privacy & quiet living arrangement. Upstairs are 3 Bedrooms or 2 and a great "at-home" office ! Nice open floorplan on 1st floor with sliders to a private deck (one with Hot-Tub). New roof and new septic make this a real attractive opportunity for a home & some income ... or a chance to keep a family member close at hand next door ! Built as a duplex : not a conversion !
Key facts
- Large wooded lot
- Quiet setting
- 2-family duplex
Tags
Property features AI
Finance
- HOA & community: Not a senior community
Exterior
- Parking: 4 off-street parking spaces
- Utilities: Public water; Private sewer
- Home design: Two-family side-by-side property; 4 total stories; Two separate units (each with 2 levels)
- Construction: Approximately built (year per public records); Slab foundation
- Exterior features: Wooded lot; Gentle sloping terrain; Paved public road frontage; Publicly maintained road
Interior
- Bathrooms: 2 full bathrooms; 2 half bathrooms
- Interior features: Total of 10 rooms
Neighborhood map
What this means for you Summary
Snapshot
- This is a 2 × 2-bed/1.5-bath units multifamily listed at $460k.
Deal economics
- At list price, monthly cash flow is $852 ($10k/yr) — positive. Per door: $426/mo.
- The deal already cash-flows at list — no discount required.
- Meets the 1% rule at list price ($5k rent vs $460k).
- Recommended offer: $453k (1.5% below list) — sets the bar for market timing.
Location & tenants
- Location reads 73/100 on livability (#109 in MA) — a middle-class / working-renter tenant base. Strengths: crime A+, employment A+, housing A+; Watch: amenities F, commute F, cost of living F.
- Hatfield (rural): math 30% / reading 52% proficiency, ranked #195 of 302 in MA (top 65%) — families likely to look elsewhere, expect single-tenant / working-renter base with shorter leases; only 9% free/reduced lunch — higher-income household profile.
- Market conditions: 8 active listings in the ZIP; 349 units permitted in Hampshire County in 2024 (185 in 5+ unit buildings).
Forward outlook
- Local home prices are declining (-3.0%/yr); year-one equity from $3k of loan paydown is wiped out by about $14k of value loss. Plan a longer hold.
- Hampshire County population projected at +5% by 2050 — modest demand growth; plan on rents tracking national, not racing it.
Negotiation context
- It's been on market 16 days — a 2% lower offer ($453k) is reasonable based on typical stale-listing flexibility.
- 3 sale attempts since 26y ago with the ask held roughly flat each time — persistent listings suggest the price (not the market) is what's stuck; bring a comps-based counter.
- Current owner paid $272k; list at $460k implies a 69% gain — meaningful room to come down on a strong offer.
Questions for the listing agent
- Can we see the unit-by-unit rent roll, current vacancy, and any below-market leases? What's the average tenancy length?
- What capital expenditures (roof, boiler, parking lot, exteriors) have been made in the last 5 years, and what's planned in the next 2?
- Is there a deadline driving the sale (1031 exchange, divorce, estate, relocation)? That informs how much negotiation room exists.
- Schools are A-rated — typically a magnet for longer-tenancy family renters. What's the average tenant stay here, and is there a school-zone premium baked into asking?
- What's the average days-on-market for RENTAL listings here right now (not sales)? A rising rental-DOM trend means longer vacancies and softer asking-rent achievability than the comps imply.
- What's the recent tenant-quality profile in this submarket — average credit score on applications, eviction rate, late-payment / NSF rate, and stable-employment percentage? A property-management company in the area should have these aggregated.
- How much new apartment / multifamily construction is in the pipeline within 1–3 miles? Heavy new supply (>2% of stock underway) typically softens rents 12–24 months out; light construction supports rent growth.
Investment metrics
- 1% rule
- 1.06% ✓
- Cap rate
- 8.52%
- Cash-on-cash
- 7.94%
- DSCR
- 1.35
- GRM
- 7.9
CMA / ARV
- ARV (on-the-fly)
- $469,040
- Comps found
- 1
Show comp detail 1 sale within ~0.75 mi
| Address | Dist | Beds/Ba | Sqft | Sold | Price | $/sf | Match |
|---|---|---|---|---|---|---|---|
| 147 Pantry Rd | 0.02mi | 3/1.5 (-1) | 2,200 (-4%) | 6mo | $450,000 | $205 | 76 |
Match score weights: distance 35% · size 25% · config 20% · recency 20%. Top-matched comps best support the ARV.
Projected returns pro-forma
-3.0% appreciation · 3.0% rent growth · sell at horizon
- IRR
- -4.2%
- Equity multiple
- 0.84×
- Total profit
- $-20,269
- Equity at exit
- $68,573
- IRR
- 5.5%
- Equity multiple
- 1.40×
- Total profit
- $52,098
- Equity at exit
- $39,764
Cash invested: $128,772 (down + closing). Projections, not guarantees.
Landlord ↔ Tenant lean methodology
- Overall (STATE)
- 20 Strongly Tenant-Friendly
- State Massachusetts
- 20 Strongly Tenant-Friendly · D+15
- County
- — inherits STATE
- City
- — inherits STATE
ZIP-level market 01035
- Home prices YoY
- -24.0%
- Active inventory
- 8
- Price-to-rent
- 15.8×
Monthly cashflow live
- Estimated rent
- $4,866 medium interval (Pro) →
- Mortgage (P&I)
- −$2,412
- Tax from tax record
- −$388 /mo · $4,659/yr
- Insurance
- −$192
- HOA
- −$0
- Vacancy / Maint / Mgmt
- −$1,022
- Net cashflow
- $852
Break-even live
2-unit breakdown (identical units grouped — click to expand)
| Units | Beds | Baths | Est. rent |
|---|---|---|---|
| 2× units | 2 | 1.5 | $4,866 |
| #1 | 2 | 1.5 | $2,433 |
| #2 | 2 | 1.5 | $2,433 |
| Total (2 units) | $4,866 | ||
UW: 25.0% down · 7.5% · 30yr · 1.5% tax · 5.0% vac · 8.0% maint · 8.0% mgmt
Financing live
Cash to close
- Down payment
- $114,975
- Closing costs
- $13,797
- Reserves months
- —
- Total cash needed
- —
Loan-product check · same deal, 3 products live
Conventional
25% down · 7.5% · 30yr
- Down + closing
- —
- Monthly P&I
- —
- Monthly cashflow
- —
- DSCR
- —
- Eligible?
- —
Personal DTI + credit; lowest rate.
DSCR
20% down · 8.5% · 30yr
- Down + closing
- —
- Monthly P&I
- —
- Monthly cashflow
- —
- DSCR
- —
- Eligible?
- —
No personal income docs; deal must DSCR.
Hard money
10% down · 12.0% · 12mo
- Down + closing
- —
- Monthly P&I
- —
- Monthly cashflow
- —
- DSCR
- —
- Eligible?
- —
Short-term bridge; refi at stabilization.
Listing history 13 events
-
2026-06-18days on market $459,900 Active 16 DOM
-
2026-06-17days on market $459,900 Active 15 DOM
-
2026-06-16days on market $459,900 Active 14 DOM
-
2026-06-15days on market $459,900 Active 13 DOM
-
2026-06-14days on market $459,900 Active 11 DOM
-
2026-06-13days on market $459,900 Active 10 DOM
-
2026-06-10days on market $459,900 Active 8 DOM
-
2026-06-09days on market $459,900 Active 7 DOM
-
2026-06-08days on market $459,900 Active 6 DOM
-
2026-06-07statusdays on market $459,900 Active 5 DOM
-
2026-06-05days on market $459,900 New 2 DOM
-
2026-06-03remarks 242-char remark
-
2026-06-03$459,900 New 1 DOM
ⓘ Source: listings_history table (triggers on properties + properties_extension) + one-shot
backfill from property_details.listing_events for pre-trigger history.
Tax reassessment forecast MA · Partial reset (capped growth)
- Current annual tax
- $4,659 · $388/mo
- Projected year-2 tax
- $5,158 · $430/mo
- Expected delta
- +$499/yr (+$42/mo · 10.7%)
ⓘ Screening estimate from a state-policy table — verify with the county assessor before closing.
Climate risk First Street
- Flood 1/10 Low FEMA zone X · 0% chance over 30 yrs
- Wildfire 3/10 Moderate
- Heat 3/10 Moderate 6 d/yr ≥97°F today · 13 d/yr by 30 yrs out
- Wind 4/10 Moderate 14% chance of damaging wind over 30 yrs
- Air quality 2/10 Low 1 unhealthy d/yr today · 1 by 30 yrs out
Nearby sold comps map
Loading sold comps map…
Walkable amenities ~0.75 mi
Loading nearby amenities…
Taxation est. · year 1
- Rental income
- $58,392
- − Mortgage interest
- −$25,762
- − Property taxes
- −$4,659
- − Insurance
- −$2,300
- − Repairs & maintenance
- −$4,671
- − Management
- −$4,671
- − Depreciation
- −$13,379
- Taxable income
- $2,950
- Est. tax owed @ 24.0%
- −$708
- After-tax cash flow
- $9,522/yr
For passive investors: Depreciation is non-cash, so a rental often shows a tax loss while cash-flowing — sheltering income. Rental losses are passive: they offset passive income freely, and up to $25,000/yr can offset ordinary (W-2) income if you actively participate and your MAGI is under $100k (phasing out to $0 by $150k); unused losses carry forward. On sale, claimed depreciation is recaptured at up to 25%, and gains may owe capital-gains tax (a 1031 exchange can defer both). Figures are a year-1 estimate at your 24.0% rate — not tax advice; consult a CPA.
Schools (NCES district)
- District
- Hatfield
- NCES district ID
- 2505940
- Math proficiency
- 30% ▼ -24.00%
- Reading proficiency
- 52% ▼ -10.00%
- Median HH income
- $58,022
- Composite
- 36.0/100
- National rank
- #4785
- State rank
- #195 of 302 in MA
Livability — Hatfield
- Score
- 73/100
- State rank
- #109
- US rank
- #5574
Category grades
Schools grade is shown separately in the Schools card above.
Census & demographics
- City population
- 2,534
- Population (ZIP)
- 5,299
Population outlook (Hampshire County) Hauer SSP2
- Today (2025)
- 166,577 people
- By 2030
- 168,928 · +1.4%
- By 2040
- 171,197 · +2.8%
- By 2050
- 175,542 · +5.4%
- By 2075
- 199,884 · +20.0%
- By 2100
- 211,819 · +27.2%
Race, ethnicity, and origin ACS 2023
- Neighborhood character
- Predominantly White (88%)
- Race & ethnicity
- White 88% Two or more races 8% Hispanic / Latino 7% Asian 2%
- Hispanic origin (detail)
- Mexican 1% Puerto Rican 2%
- Common ancestry
- Romanian 18% Lithuanian 6% Serbian 3%
- Foreign-born
- 6% · Canada, Dominican Republic, Guatemala
- Languages at home
- 94% English-only · Spanish 2% Other Indo-European 1% German/W. Germanic 1%
Political lean MEDSL · Hampshire
- 2024 margin
- Solid D (+41.9) · D 69.5% · R 27.6% · Other 2.9%
- 2008→2024 swing
- -3.6pp toward R · 2008: 45.6pp · 2024: 41.9pp
- All cycles
- 2024: D+41.9 2020: D+46.8 2016: D+39.5 2012: D+43.8 2008: D+45.6
Not yet ingested
- Civics
- —
Market trends
- HPI YoY
- ▼ -91.44%
- Current HPI
- 288.9805
- Rent YoY
- —
- Metro
- —
- State GDP YoY
- ▲ 2.28%
- F500 in state
- 38
Industry mix (Fortune 500 HQ in MA)
| Industry | F500 HQs | Revenue |
|---|---|---|
| Technology | 3 | $17B |
|
||
| Insurance | 2 | $84B |
|
||
| Retail | 2 | $76B |
|
||
| Life Sciences | 1 | $43B |
|
||
| Energy Technology | 1 | $31B |
|
||
| Aerospace / Defense | 1 | $18B |
|
||
Price history
+164.3% since first listed7 events — show timeline
- 2026-06-02 Listed $459,900 MLS PIN
- 2010-04-08 Sold (Public Records) $272,000 Public Records
- 2010-04-07 Sold (MLS) $272,000 MLS PIN
- 2010-01-08 Listed $285,000 MLS PIN
- 2000-12-29 Sold (Public Records) $165,000 Public Records
- 2000-12-29 Sold (MLS) $165,000 MLS PIN
- 2000-09-20 Listed $174,000 MLS PIN
Property tax history
+3.9%/yrLatest (2023): $4,659 · +7.3% YoY. Source: county tax records.
Cash-flow waterfall
monthlySold comps — $/sqft
last 12 mo · ≤1 miLoading sold comps…