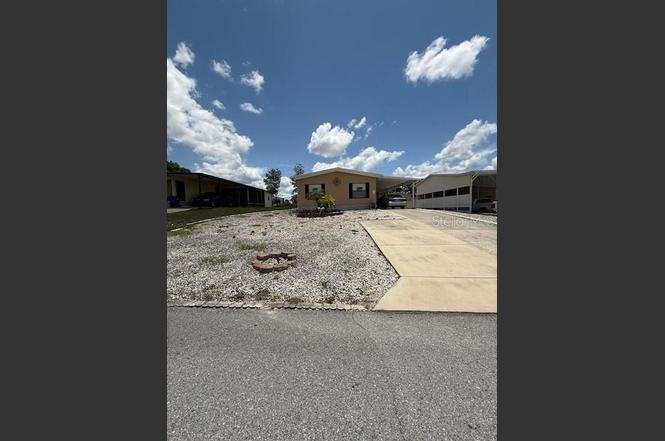
8466 Dickens Ave · Brookridge, FL
Flood risk 1/10 · Minimal
- FEMA flood zone
- X (unshaded)
- Chance of flooding over 30 yrs
- 0.0%
- Est. flood insurance / yr
- $507 – $1,088
Fire risk 5/10 · Moderate
- Est. fire insurance / yr
- $947 – $1,759
Heat risk 10/10 · Severe
- Hot days now (above 109°F)
- 7 days/yr
- Hot days in 30 yrs
- 27 days/yr
Wind risk 9/10 · Severe
- Chance of severe wind over 30 yrs
- 99.0%
Air-quality risk 2/10 · Minimal
- Unhealthy air days now
- 1 days/yr
- Unhealthy air days in 30 yrs
- 1 days/yr
Risk factors via First Street. Map © Google.
Why this score? — see what drove the B grade
The composite is a weighted blend of 9 inputs, each scored 0–100. Each bar is that input's sub-score; the figure is the points it added to the 100-point composite (weight × sub-score).
- Cash flow +28.4/30.0
- ARV discount +13.3/15.0
- DSCR +10.0/10.0
- 1% rule +7.3/10.0
- Schools +4.2/10.0
- Livability +3.5/5.0
- Rent growth +2.5/5.0
- Condition / age +2.5/5.0
- Appreciation +0.0/10.0
$125,000
🖨 Deal sheet 📄 Offer letter ✓ Due diligence
Listing remarks MLS
'JUST REDUCED'' Furnished 3 bedroom split plan with two baths, Large closets, roof over, A/C new in 2004, cooper pipes, plywood floors, new sinks & faucets. Maintenance free rock yard, Large storage area. Located in a 55+ gated community where you ''OWN YOUR LAND '
Key facts
- Clubhouse
- Pool
- Shopping
Tags
Property features AI
Finance
- Other: Lot about 0.14 acres (approx. 60 x 100); Owner-reported living area approximately 1,104
- Financial info: Total monthly fees listed as $50; total annual fees listed as $600; Lease restrictions apply
- HOA & community: Monthly HOA $50 (association approval required); Senior community; Pets allowed
Exterior
- Parking: Carport (1 space)
- Utilities: Public sewer; Water connected; Electricity connected; Cable available; Water source: None indicated
- Home design: Manufactured double-wide home; Single-story; Home faces south; Crawlspace foundation
- Construction: Vinyl siding construction; Metal roof; Crawlspace foundation; Built as a double-wide manufactured home
- Exterior features: Vinyl siding; Rain gutters; Asphalt road access
Interior
- Kitchen: Range hood; Refrigerator
- Bedrooms: 3 bedrooms
- Flooring: Linoleum
- Bathrooms: 2 full bathrooms
- Heating & cooling: Central heating; Central air conditioning
- Interior features: Range hood; Refrigerator; Rain gutters
- Laundry & utility: Laundry located outside
Neighborhood map
What this means for you Summary
Snapshot
- This is a 2-bed/2.0-bath manufactured listed at $125k.
Deal economics
- At list price, monthly cash flow is $405 ($5k/yr) — positive.
- The deal already cash-flows at list — no discount required.
- Meets the 1% rule at list price ($2k rent vs $125k).
- Recommended offer: $110k (12.0% below list) — sets the bar for market timing.
- Cap rate 10.2% vs local median 6.3% in Brookridge — top-decile yield for the area; either an underpriced asset or a hidden risk that comps aren't pricing in. Stress-test before assuming the spread holds.
Location & tenants
- Location reads 70/100 on livability (#421 in FL) — a middle-class / working-renter tenant base. Strengths: cost of living A+, housing A+, crime B+; Watch: employment C-, health & safety C-, schools F.
- Hernando (suburban): math 50% / reading 50% proficiency, ranked #38 of 73 in FL (top 52%) — acceptable for families but not a draw, mixed tenant base, ~2y average lease.
- Market conditions: 691 active listings in the ZIP; 7 comparable units currently listed for rent nearby; rentals at typical pace (median 22d on market — plan ~3-4 weeks tenant-placement turnaround); 2,505 units permitted in Hernando County in 2024 (318 in 5+ unit buildings).
- This rent runs 32% of the median local income ($59k/yr) — at the standard rent-burdened threshold; future hikes will face affordability resistance.
Forward outlook
- Local home prices are declining (-3.0%/yr); year-one equity from $864 of loan paydown is wiped out by about $4k of value loss. Plan a longer hold.
- Hernando County population projected at +11% by 2050 — modest demand growth; plan on rents tracking national, not racing it.
- At projected returns (-3.0% appreciation + 3.0% rent growth), your $35k cash investment doubles in ~9 years — after that, you're playing with house money.
Negotiation context
- It's been on market 336 days — a 12% lower offer ($110k) is reasonable based on typical stale-listing flexibility.
- 7 sale attempts since 12y ago; this cycle's ask has dropped $50k (29%) from the opening price — seller is motivated, your offer sets the floor, not the list.
- Current owner paid $46k; list at $125k implies a 172% gain — meaningful room to come down on a strong offer.
Risks & watch-outs
- Climate carrying-cost: severe wind risk, 99% chance of damaging wind over 30y; moderate wildfire risk; extreme-heat days projected 7→27/yr by 2055 (HVAC capex compounding) — expect insurance premiums to compound above CPI over the hold.
Questions for the listing agent
- It's been on market 336 days. Have you received any prior offers? Is the seller open to a 12% concession, seller financing, or rate buy-down credit?
- What does the HOA fee cover, when was the last increase, and are there any pending special assessments or reserve-fund shortfalls?
- Why hasn't it sold? Are there any deal-killer items the seller is aware of (foundation, flood, title, zoning, code violations)?
- Is there a deadline driving the sale (1031 exchange, divorce, estate, relocation)? That informs how much negotiation room exists.
- Schools are F-rated, which usually means shorter tenancies and higher turnover. Who's the typical renter profile here, and what's been the actual vacancy rate?
- What's the average days-on-market for RENTAL listings here right now (not sales)? A rising rental-DOM trend means longer vacancies and softer asking-rent achievability than the comps imply.
- What's the recent tenant-quality profile in this submarket — average credit score on applications, eviction rate, late-payment / NSF rate, and stable-employment percentage? A property-management company in the area should have these aggregated.
- How much new for-sale + rental construction is in the pipeline within 1–3 miles? Heavy new supply typically softens prices + rents 12–24 months out; constrained supply supports both.
Investment metrics
- 1% rule
- 1.23% ✓
- Cap rate
- 10.18%
- Cash-on-cash
- 13.88%
- DSCR
- 1.62
- GRM
- 6.8
CMA / ARV
- ARV (on-the-fly)
- $143,520
- Comps found
- 12
Show comp detail 12 sales within ~0.75 mi
| Address | Dist | Beds/Ba | Sqft | Sold | Price | $/sf | Match |
|---|---|---|---|---|---|---|---|
| 15682 Brookridge Blvd | 0.19mi | 2/2.0 | 1,104 (0%) | 0mo | $144,000 | $130 | 91 |
| 14883 Rialto Ave | 0.43mi | 2/2.0 | 1,144 (+4%) | 0mo | $148,000 | $129 | 74 |
| 9259 Salvini Dr | 0.42mi | 2/2.0 | 1,152 (+4%) | 1mo | $165,000 | $143 | 72 |
| 14986 Rialto Ave | 0.35mi | 2/2.0 | 1,188 (+8%) | 2mo | $185,000 | $156 | 69 |
| 9847 Scepter Ave | 0.19mi | 2/2.0 | 1,248 (+13%) | 0mo | $154,000 | $123 | 69 |
| 9847 Scepter Ave | 0.19mi | 2/2.0 | 1,248 (+13%) | 0mo | $154,000 | $123 | 69 |
| 15712 Brookridge Blvd | 0.26mi | 2/2.0 | 1,246 (+13%) | 2mo | $200,000 | $161 | 64 |
| 9839 Scepter Ave | 0.20mi | 3/2.0 (+1) | 960 (-13%) | 1mo | $145,000 | $151 | 63 |
| 8304 Weatherford Ave | 0.65mi | 2/2.0 | 1,056 (-4%) | 1mo | $109,000 | $103 | 61 |
| 15472 Brookridge Blvd | 0.21mi | 3/2.0 (+1) | 960 (-13%) | 3mo | $166,000 | $173 | 61 |
| 14517 Rialto Ave | 0.42mi | 2/2.0 | 1,226 (+11%) | 3mo | $152,500 | $124 | 60 |
| 8271 Modena Ave | 0.51mi | 2/2.0 | 1,265 (+15%) | 0mo | $107,000 | $85 | 52 |
Match score weights: distance 35% · size 25% · config 20% · recency 20%. Top-matched comps best support the ARV.
Projected returns pro-forma
-3.0% appreciation · 3.0% rent growth · sell at horizon
- IRR
- 4.1%
- Equity multiple
- 1.16×
- Total profit
- $5,518
- Equity at exit
- $18,638
- IRR
- 13.6%
- Equity multiple
- 2.08×
- Total profit
- $37,972
- Equity at exit
- $10,808
Cash invested: $35,000 (down + closing). Projections, not guarantees.
Landlord ↔ Tenant lean methodology
- Overall (STATE)
- 87 Strongly Landlord-Friendly
- State Florida
- 87 Strongly Landlord-Friendly · R+3
- County
- — inherits STATE
- City
- — inherits STATE
ZIP-level market 34613
- Home prices YoY
- -17.2%
- Active inventory
- 691
- Price-to-rent
- 6.8×
Monthly cashflow live
- Estimated rent
- $1,543 high interval (Pro) →
- Mortgage (P&I)
- −$656
- Tax from tax record
- −$56 /mo · $676/yr
- Insurance
- −$52
- HOA
- −$50
- Vacancy / Maint / Mgmt
- −$324
- Net cashflow
- $405
Break-even live
UW: 25.0% down · 7.5% · 30yr · 1.5% tax · 5.0% vac · 8.0% maint · 8.0% mgmt
Financing live
Cash to close
- Down payment
- $31,250
- Closing costs
- $3,750
- Reserves months
- —
- Total cash needed
- —
Loan-product check · same deal, 3 products live
Conventional
25% down · 7.5% · 30yr
- Down + closing
- —
- Monthly P&I
- —
- Monthly cashflow
- —
- DSCR
- —
- Eligible?
- —
Personal DTI + credit; lowest rate.
DSCR
20% down · 8.5% · 30yr
- Down + closing
- —
- Monthly P&I
- —
- Monthly cashflow
- —
- DSCR
- —
- Eligible?
- —
No personal income docs; deal must DSCR.
Hard money
10% down · 12.0% · 12mo
- Down + closing
- —
- Monthly P&I
- —
- Monthly cashflow
- —
- DSCR
- —
- Eligible?
- —
Short-term bridge; refi at stabilization.
Rent comps 7 comps
| Address | Beds | Baths | Sqft | Rent | $/sqft | DOM | Units | Dist |
|---|---|---|---|---|---|---|---|---|
| 9919 Scepter Ave Brooksville, FL | 3.0 | 2.0 | 1188 | $1,250 | $1.05 | 5d | 1 | 0.13mi |
| 15466 Brookridge Blvd Brooksville, FL | 2.0 | 2.0 | 828 | $1,225 | $1.48 | 24d | 1 | 0.21mi |
| 8917 Southern Charm Cir Brooksville, FL | 3.0 | 2.0 | 1437 | $1,695 | $1.18 | 3d | 1 | 0.50mi |
| 8871 Southern Charm Cir Brooksville, FL | 3.0 | 2.0 | 1482 | $2,050 | $1.38 | 24d | 1 | 0.50mi |
| 8407 Weatherford Ave Brooksville, FL | 2.0 | 2.0 | 1104 | $1,500 | $1.36 | 17d | 1 | 0.50mi |
| 14342 Starcross St Brooksville, FL | 2.0 | 1.0 | 900 | $1,025 | $1.14 | 21d | 1 | 0.89mi |
| 14697 Brookridge Blvd Brooksville, FL | 2.0 | 2.0 | 1056 | $1,350 | $1.28 | 24d | 1 | 1.18mi |
HOA detail
- Monthly dues
- $50 · $600/yr
- Likely covers
- security
Listing history 32 events
-
2026-06-18days on market $125,000 Active 336 DOM
-
2026-06-17days on market $125,000 Active 335 DOM
-
2026-06-16days on market $125,000 Active 334 DOM
-
2026-06-15days on market $125,000 Active 333 DOM
-
2026-06-13days on market $125,000 Active 331 DOM
-
2026-06-13days on market $125,000 Active 330 DOM
-
2026-06-09days on market $125,000 Active 327 DOM
-
2026-06-08days on market $125,000 Active 326 DOM
-
2026-06-07days on market $125,000 Active 325 DOM
-
2026-06-04days on market $125,000 Active 322 DOM
-
2026-06-03days on market $125,000 Active 321 DOM
-
2026-06-02days on market $125,000 Active 320 DOM
-
2026-06-01days on market $125,000 Active 319 DOM
-
2026-05-31days on market $125,000 Active 318 DOM
-
2026-05-14price $125,000
-
2025-12-12price $140,000
-
2025-11-12price $150,000
-
2025-09-11price $170,000
-
2025-07-17$175,000 Active
-
2015-10-22soldstatus $46,000
-
2015-10-21soldstatus $46,000 271-char remark
Show marketing remark (271 chars)
'JUST REDUCED'' Furnished 3 bedroom split plan with two baths, Large closets, roof over, A/C new in 2004, cooper pipes, plywood floors, new sinks & faucets. Maintenance free rock yard, Large storage area. Located in a 55+ gated community where you ''OWN YOUR LAND '
-
2015-07-06$48,500 271-char remark
Show marketing remark (271 chars)
'JUST REDUCED'' Furnished 3 bedroom split plan with two baths, Large closets, roof over, A/C new in 2004, cooper pipes, plywood floors, new sinks & faucets. Maintenance free rock yard, Large storage area. Located in a 55+ gated community where you ''OWN YOUR LAND '
-
2015-06-15soldstatus $44,000
-
2015-06-15soldstatus $44,000
-
2015-03-30soldstatus $35,000
-
2015-03-30soldstatus $35,000
-
2015-03-30$47,500
-
2015-03-30$47,500
-
2014-06-20$59,900
-
2014-06-20$59,900
ⓘ Source: listings_history table (triggers on properties + properties_extension) + one-shot
backfill from property_details.listing_events for pre-trigger history.
Tax reassessment forecast FL · Resets to sale price
- Current annual tax
- $676 · $56/mo
- Projected year-2 tax
- $1,038 · $86/mo
- Expected delta
- +$362/yr (+$30/mo · 53.5%)
ⓘ Screening estimate from a state-policy table — verify with the county assessor before closing.
Climate risk First Street
- Flood 1/10 Low FEMA zone X (unshaded) · 0% chance over 30 yrs
- Wildfire 5/10 Major
- Heat 10/10 Extreme 7 d/yr ≥109°F today · 27 d/yr by 30 yrs out
- Wind 9/10 Extreme 99% chance of damaging wind over 30 yrs
- Air quality 2/10 Low 1 unhealthy d/yr today · 1 by 30 yrs out
Nearby sold comps map
Loading sold comps map…
Walkable amenities ~0.75 mi
Loading nearby amenities…
Taxation est. · year 1
- Rental income
- $18,512
- − Mortgage interest
- −$7,002
- − Property taxes
- −$676
- − Insurance
- −$625
- − Repairs & maintenance
- −$1,481
- − Management
- −$1,481
- − HOA
- −$600
- − Depreciation
- −$3,636
- Taxable income
- $3,011
- Est. tax owed @ 24.0%
- −$723
- After-tax cash flow
- $4,135/yr
For passive investors: Depreciation is non-cash, so a rental often shows a tax loss while cash-flowing — sheltering income. Rental losses are passive: they offset passive income freely, and up to $25,000/yr can offset ordinary (W-2) income if you actively participate and your MAGI is under $100k (phasing out to $0 by $150k); unused losses carry forward. On sale, claimed depreciation is recaptured at up to 25%, and gains may owe capital-gains tax (a 1031 exchange can defer both). Figures are a year-1 estimate at your 24.0% rate — not tax advice; consult a CPA.
Schools (NCES district)
- District
- Hernando
- NCES district ID
- 1200810
- Math proficiency
- 50% ▼ -8.00%
- Reading proficiency
- 50% ▼ -4.00%
- Median HH income
- $41,985
- Composite
- 42.03/100
- National rank
- #3329
- State rank
- #38 of 73 in FL
Livability — Brookridge
- Score
- 70/100
- State rank
- #421
- US rank
- #7529
Category grades
Schools grade is shown separately in the Schools card above.
Census & demographics
- Census place
- Brookridge, FL
- County
- Hernando County · 169,677 people
- Metro
- Tampa-St. Petersburg-Clearwater, FL
- Population (ZIP)
- 19,337
- Household income
- $58,596
- Rent vs Own
- Severe rent burden
- 307.0
Population outlook (Hernando County) Hauer SSP2
- Today (2025)
- 189,218 people
- By 2030
- 194,367 · +2.7%
- By 2040
- 203,398 · +7.5%
- By 2050
- 209,589 · +10.8%
- By 2075
- 218,452 · +15.4%
- By 2100
- 205,923 · +8.8%
Race, ethnicity, and origin ACS 2023
- Neighborhood character
- Predominantly White (88%)
- Race & ethnicity
- White 88% Hispanic / Latino 6% Two or more races 4% Black 2% Asian 1%
- Hispanic origin (detail)
- Mexican 1% Puerto Rican 2% Cuban 1%
- Common ancestry
- Romanian 4% Lithuanian 3% Slovak 2%
- Foreign-born
- 8% · Canada, Vietnam
- Languages at home
- 92% English-only · Spanish 3% French/Haitian/Cajun 1% Russian/Polish/Slavic 1%
Political lean MEDSL · Hernando
- 2024 margin
- Solid R (+37.0) · D 31.1% · R 68.2%
- 2008→2024 swing
- -33.5pp toward R · 2008: -3.6pp · 2024: -37.0pp
- All cycles
- 2024: R+37.0 2020: R+30.2 2016: R+29.0 2012: R+8.5 2008: R+3.6
Not yet ingested
- Civics
- —
Market trends
- HPI YoY
- ▼ -57.51%
- Current HPI
- 276.2229
- Rent YoY
- —
- Metro
- Tampa-St. Petersburg-Clearwater, FL
- State GDP YoY
- ▲ 3.28%
- F500 in state
- 36
Industry mix (Fortune 500 HQ in FL)
| Industry | F500 HQs | Revenue |
|---|---|---|
| Industrial Technology | 2 | $29B |
|
||
| Insurance | 2 | $17B |
|
||
| Retail | 1 | $60B |
|
||
| Technology Distribution | 1 | $58B |
|
||
| Homebuilding | 1 | $35B |
|
||
| Technology Manufacturing | 1 | $35B |
|
||
Price history
+108.7% since first listed18 events — show timeline
- 2026-05-14 Price Changed $125,000 Stellar MLS as Distributed by MLS Grid
- 2025-12-12 Price Changed $140,000 Stellar MLS as Distributed by MLS Grid
- 2025-11-12 Price Changed $150,000 Stellar MLS as Distributed by MLS Grid
- 2025-09-11 Price Changed $170,000 Stellar MLS as Distributed by MLS Grid
- 2025-07-17 Listed $175,000 Stellar MLS as Distributed by MLS Grid
- 2015-10-22 Sold (Public Records) $46,000 Public Records
- 2015-10-21 Sold (MLS) $46,000 St. Augustine and St. Johns County Board of REALTORS®
- 2015-10-21 Sold (MLS) $46,000 HCAR
- 2015-07-06 Listed $48,500 St. Augustine and St. Johns County Board of REALTORS®
- 2015-07-06 Listed $48,500 HCAR
- 2015-06-15 Sold (MLS) $44,000 St. Augustine and St. Johns County Board of REALTORS®
- 2015-06-15 Sold (MLS) $44,000 HCAR
- 2015-03-30 Listed $47,500 St. Augustine and St. Johns County Board of REALTORS®
- 2015-03-30 Listed $47,500 HCAR
- 2015-03-30 Sold (MLS) $35,000 St. Augustine and St. Johns County Board of REALTORS®
- 2015-03-30 Sold (MLS) $35,000 HCAR
- 2014-06-20 Listed $59,900 St. Augustine and St. Johns County Board of REALTORS®
- 2014-06-20 Listed $59,900 HCAR
Property tax history
-0.1%/yrLatest (2025): $676 · +0.7% YoY. Source: county tax records.
Cash-flow waterfall
monthlySold comps — $/sqft
last 12 mo · ≤1 miLoading sold comps…