640 Maple Dr · Riverdale, GA
Flood risk 1/10 · Minimal
- FEMA flood zone
- X (unshaded)
- Chance of flooding over 30 yrs
- 0.0%
- Est. flood insurance / yr
- $507 – $1,088
Fire risk 3/10 · Minor
- Est. fire insurance / yr
- $963 – $1,789
Heat risk 5/10 · Moderate
- Hot days now (above 105°F)
- 7 days/yr
- Hot days in 30 yrs
- 17 days/yr
Wind risk 6/10 · Moderate
- Chance of severe wind over 30 yrs
- 27.0%
Air-quality risk 4/10 · Minor
- Unhealthy air days now
- 4 days/yr
- Unhealthy air days in 30 yrs
- 6 days/yr
Risk factors via First Street. Map © Google.
Why this score? — see what drove the C- grade
The composite is a weighted blend of 9 inputs, each scored 0–100. Each bar is that input's sub-score; the figure is the points it added to the 100-point composite (weight × sub-score).
- Cash flow +21.2/30.0
- ARV discount +12.0/15.0
- DSCR +6.8/10.0
- 1% rule +4.6/10.0
- Livability +3.5/5.0
- Rent growth +2.8/5.0
- Condition / age +2.5/5.0
- Schools +1.3/10.0
- Appreciation +0.0/10.0
$175,000
🖨 Deal sheet 📄 Offer letter ✓ Due diligence
Listing remarks
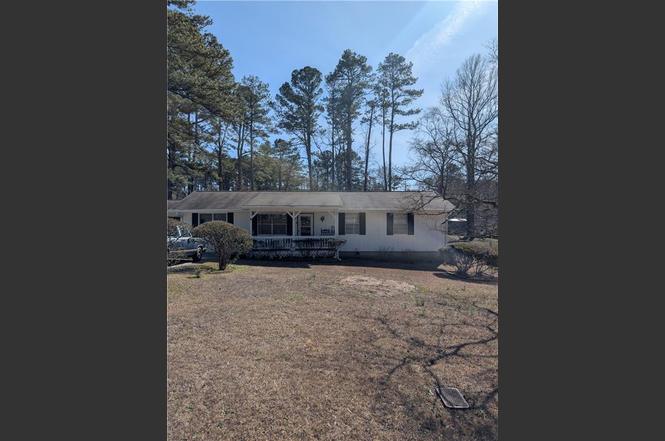
Estate-owned 3-bedroom, 1.5-bath ranch located in Riverdale, GA, offering approximately 1,050 square feet of single-level living space. Built in 1971, this home features a functional layout with abundant natural sunlight throughout. The property includes a spacious backyard with plenty of room for outdoor activities, gardening, or future improvements. Additional features include a covered carport for convenient parking and no HOA. With solid bones and classic ranch-style design, this property presents an excellent opportunity for buyers looking to renovate or investors seeking their next project. Conveniently located near shopping, dining, schools, and major roadways. Property is being sold
Key facts
- 0.46 acre lot
- Parking
- Built 1971
Neighborhood map
What this means for you Summary
Snapshot
- This is a 3-bed/1.0-bath single-family listed at $175k.
Deal economics
- At list price, monthly cash flow is $254 ($3k/yr) — positive.
- The deal already cash-flows at list — no discount required.
- To meet the 1% rule (rent ≥ 1% of price), the offer needs to be $168k (3.9% below list).
- Recommended offer: $168k (3.9% below list) — sets the bar for 1% rule.
- Cap rate 8.0% vs local median 5.5% in Riverdale — top-decile yield for the area; either an underpriced asset or a hidden risk that comps aren't pricing in. Stress-test before assuming the spread holds.
Location & tenants
- Location reads 70/100 on livability (#100 in GA) — a middle-class / working-renter tenant base. Strengths: cost of living A+, housing A+; Watch: crime D, amenities F, commute F.
- Clayton County (suburban): math 11% / reading 20% proficiency, ranked #155 of 174 in GA (top 89%) — low school quality limits family demand, transient renter base, plan for 1-2y turnover; 78% free/reduced lunch — lower-income household profile, screen leases tightly.
- Zoned schools: Pointe South Elementary School (math 5% / reading 17%, grade F, #1,071 of 1,228 statewide, top 88%, 531 students, 90% FRL); Pointe South Middle School (math 8% / reading 22%, grade F, #399 of 470 statewide, top 86%, 760 students, 90% FRL); Riverdale High School (math 12% / reading 17%, grade F, #315 of 424 statewide, top 76%, 1,333 students, 90% FRL).
- Market conditions: Rents rising (+1.3%/yr); 182 active listings in the ZIP; 40 comparable units currently listed for rent nearby; rentals at typical pace (median 22d on market — plan ~3-4 weeks tenant-placement turnaround); 865 units permitted in Clayton County in 2024 (448 in 5+ unit buildings).
- This rent runs 39% of the median local income ($52k/yr) — at the standard rent-burdened threshold; future hikes will face affordability resistance.
Forward outlook
- Local home prices are declining (-3.0%/yr); year-one equity from $1k of loan paydown is wiped out by about $5k of value loss. Plan a longer hold.
- Clayton County population projected at +29% by 2050 — long-run rental-demand tailwind backs the buy-and-hold thesis.
Negotiation context
- It's been on market 15 days — a 2% lower offer ($172k) is reasonable based on typical stale-listing flexibility.
- 3 sale attempts with the ask held roughly flat each time — persistent listings suggest the price (not the market) is what's stuck; bring a comps-based counter.
Risks & watch-outs
- Climate carrying-cost: major wind risk, 27% chance of damaging wind over 30y; extreme-heat days projected 7→17/yr by 2055 (HVAC capex compounding) — expect insurance premiums to compound above CPI over the hold.
Questions for the listing agent
- Built in 1971 — when were the roof, HVAC, electrical panel, plumbing, and water heater last replaced?
- Is there a deadline driving the sale (1031 exchange, divorce, estate, relocation)? That informs how much negotiation room exists.
- Schools are D-rated, which usually means shorter tenancies and higher turnover. Who's the typical renter profile here, and what's been the actual vacancy rate?
- Crime grade is D in this area — have there been break-ins, vandalism, or insurance claims at this property in the last 3 years? What carrier currently insures it and at what premium?
- What's the average days-on-market for RENTAL listings here right now (not sales)? A rising rental-DOM trend means longer vacancies and softer asking-rent achievability than the comps imply.
- What's the recent tenant-quality profile in this submarket — average credit score on applications, eviction rate, late-payment / NSF rate, and stable-employment percentage? A property-management company in the area should have these aggregated.
- How much new for-sale + rental construction is in the pipeline within 1–3 miles? Heavy new supply typically softens prices + rents 12–24 months out; constrained supply supports both.
Investment metrics
- 1% rule
- 0.96% ✗
- Cap rate
- 8.04%
- Cash-on-cash
- 6.22%
- DSCR
- 1.28
- GRM
- 8.7
CMA / ARV
- ARV (on-the-fly)
- $194,250
- Comps found
- 12
Show comp detail 12 sales within ~0.75 mi
| Address | Dist | Beds/Ba | Sqft | Sold | Price | $/sf | Match |
|---|---|---|---|---|---|---|---|
| 725 Oak Dr | 0.16mi | 3/2.0 | 1,050 (0%) | 6mo | $215,000 | $205 | 84 |
| 8479 Alden Dr | 0.45mi | 3/2.0 | 1,084 (+3%) | 11mo | $200,000 | $185 | 61 |
| 763 Waterview Dr | 0.34mi | 3/2.0 | 1,084 (+3%) | 17mo | $180,000 | $166 | 60 |
| 787 Bartow Ct | 0.30mi | 3/2.0 | 1,030 (-2%) | 23mo | $230,000 | $223 | 60 |
| 812 Bartow Ct | 0.36mi | 3/2.0 | 1,110 (+6%) | 12mo | $205,000 | $185 | 60 |
| 8427 N Pond Ct | 0.22mi | 3/1.5 | 1,120 (+7%) | 22mo | $164,700 | $147 | 59 |
| 8685 Woodside Ln | 0.67mi | 2/1.5 (-1) | 1,034 (-2%) | 4mo | $160,000 | $155 | 55 |
| 8636 Woodside Ln | 0.60mi | 2/1.5 (-1) | 1,034 (-2%) | 9mo | $120,000 | $116 | 55 |
| 8651 Woodside Ln | 0.63mi | 2/1.5 (-1) | 1,034 (-2%) | 17mo | $155,000 | $150 | 47 |
| 8489 Alden Ct | 0.40mi | 3/2.0 | 1,142 (+9%) | 19mo | $219,000 | $192 | 47 |
| 1124 Brandon Hill Way | 0.72mi | 3/2.5 | 1,156 (+10%) | 12mo | $176,000 | $152 | 33 |
| 949 Forest Pointe Way | 0.61mi | 3/2.0 | 1,156 (+10%) | 22mo | $230,000 | $199 | 32 |
Match score weights: distance 35% · size 25% · config 20% · recency 20%. Top-matched comps best support the ARV.
Projected returns pro-forma
-3.0% appreciation · 1.3% rent growth · sell at horizon
- IRR
- -8.5%
- Equity multiple
- 0.69×
- Total profit
- $-15,054
- Equity at exit
- $26,093
- IRR
- -1.2%
- Equity multiple
- 0.92×
- Total profit
- $-3,711
- Equity at exit
- $15,131
Cash invested: $49,000 (down + closing). Projections, not guarantees.
Landlord ↔ Tenant lean methodology
- Overall (STATE)
- 90 Strongly Landlord-Friendly
- State Georgia
- 90 Strongly Landlord-Friendly · R+3
- County
- — inherits STATE
- City
- — inherits STATE
ZIP-level market 30274
- Home prices YoY
- -19.6%
- Rents YoY
- 1.3%
- Active inventory
- 182
- Price-to-rent
- 8.7×
Monthly cashflow live
- Estimated rent
- $1,681 high interval (Pro) →
- Mortgage (P&I)
- −$918
- Tax from tax record
- −$83 /mo · $998/yr
- Insurance
- −$73
- HOA
- −$0
- Vacancy / Maint / Mgmt
- −$353
- Net cashflow
- $254
Break-even live
UW: 25.0% down · 7.5% · 30yr · 1.5% tax · 5.0% vac · 8.0% maint · 8.0% mgmt
Financing live
Cash to close
- Down payment
- $43,750
- Closing costs
- $5,250
- Reserves months
- —
- Total cash needed
- —
Loan-product check · same deal, 3 products live
Conventional
25% down · 7.5% · 30yr
- Down + closing
- —
- Monthly P&I
- —
- Monthly cashflow
- —
- DSCR
- —
- Eligible?
- —
Personal DTI + credit; lowest rate.
DSCR
20% down · 8.5% · 30yr
- Down + closing
- —
- Monthly P&I
- —
- Monthly cashflow
- —
- DSCR
- —
- Eligible?
- —
No personal income docs; deal must DSCR.
Hard money
10% down · 12.0% · 12mo
- Down + closing
- —
- Monthly P&I
- —
- Monthly cashflow
- —
- DSCR
- —
- Eligible?
- —
Short-term bridge; refi at stabilization.
Rent comps 40 comps
| Address | Beds | Baths | Sqft | Rent | $/sqft | DOM | Units | Dist |
|---|---|---|---|---|---|---|---|---|
| 693 Oak Dr Riverdale, GA | 4.0 | 2.5 | 1325 | $1,825 | $1.38 | 5d | 1 | 0.11mi |
| 8443 Cedar Creek Rdg Riverdale, GA | 3.0 | 2.0 | 1476 | $1,735 | $1.18 | 19d | 1 | 0.35mi |
| 100 Chase Ridge Dr Riverdale, GA | 1.0–2.0 | 1.0–2.0 | 1002 | $1,545 | $1.54 | 5d | 6 | 0.51mi |
| 100 Chase Ridge Dr Riverdale, GA | 2.0 | 2.0 | 1175 | $1,545 | $1.31 | 43d | 1 | 0.51mi |
| 8588 Creekwood Way Jonesboro, GA | 3.0 | 1.5 | 1344 | $1,300 | $0.97 | 5d | 1 | 0.57mi |
| 8104 Webb Rd Riverdale, GA | 1.0–2.0 | 1.0–2.0 | 890 | $1,549 | $1.74 | 1d | 18 | 0.58mi |
| 634 Morton Ct Unit 636 Jonesboro, GA | 2.0 | 1.5 | 1050 | $1,225 | $1.17 | 43d | 1 | 0.59mi |
| 100 Chase Ridge Dr Unit 1005 Riverdale, GA | 2.0 | 2.0 | 1175 | $1,395 | $1.19 | 43d | 1 | 0.60mi |
| 785 Redland Dr Jonesboro, GA | 4.0 | 2.0 | 1496 | $1,935 | $1.29 | 12d | 1 | 0.62mi |
| 8062 Creekstone Way Riverdale, GA | 2.0 | 2.5 | 1232 | $1,286 | $1.04 | 43d | 1 | 0.65mi |
| 801 Redland Dr Jonesboro, GA | 3.0 | 2.0 | 1370 | $1,725 | $1.26 | 12d | 1 | 0.66mi |
| 801 Redland Dr Jonesboro, GA | 3.0 | 2.0 | 1370 | $1,750 | $1.28 | 43d | 1 | 0.66mi |
| 8584 Guthrie Dr Riverdale, GA | 3.0 | 2.0 | 1445 | $1,650 | $1.14 | 15d | 1 | 0.68mi |
| 8671 Woodside Ln Jonesboro, GA | 2.0 | 2.0 | 1025 | $1,350 | $1.32 | 12d | 1 | 0.68mi |
| 8671 Woodside Ln Jonesboro, GA | 2.0 | 2.0 | 1025 | $1,350 | $1.32 | 22d | 1 | 0.68mi |
| 8078 Woodlake Dr Riverdale, GA | 2.0 | 2.5 | 1280 | $1,445 | $1.13 | 1d | 1 | 0.69mi |
| 8066 Woodlake Dr Riverdale, GA | 2.0 | 2.5 | 1280 | $1,505 | $1.18 | 3d | 1 | 0.71mi |
| 772 Pointe South Pkwy Jonesboro, GA | 3.0 | 2.5 | 1202 | $1,384 | $1.15 | 43d | 1 | 0.85mi |
| 8194 Canyon Forge Dr Riverdale, GA | 3.0 | 2.5 | 1488 | $1,555 | $1.05 | 4d | 1 | 0.90mi |
| 8050 Taylor Rd Riverdale, GA | 1.0–3.0 | 1.0–2.0 | 944 | $1,315 | $1.39 | 1d | 12 | 0.92mi |
| 222 Peartree Ln Riverdale, GA | 3.0 | 1.5 | 1028 | $1,480 | $1.44 | 24d | 1 | 0.94mi |
| 1022 Brandon Hill Way Jonesboro, GA | 3.0 | 2.0 | 1022 | $1,615 | $1.58 | 24d | 1 | 0.95mi |
| 7943 Taylor Cir Riverdale, GA | 3.0 | 2.0 | 1344 | $1,665 | $1.24 | 43d | 1 | 0.96mi |
| 8238 Canyon Forge Dr Riverdale, GA | 2.0 | 2.5 | 1246 | $1,400 | $1.12 | 4d | 1 | 0.98mi |
| 1 Lakeview Way Jonesboro, GA | 2.0 | 2.0 | 1160 | $1,531 | $1.32 | 43d | 1 | 0.99mi |
| 1 Lakeview Way Jonesboro, GA | 2.0 | 2.0 | 1160 | $1,937 | $1.67 | 24d | 1 | 0.99mi |
| 432 Wesley Park Dr Jonesboro, GA | 3.0 | 2.0 | 1350 | $1,685 | $1.25 | 24d | 1 | 1.00mi |
| 950 Lake Ridge Pkwy Riverdale, GA | 1.0–2.0 | 1.0–2.0 | 966 | $1,462 | $1.51 | 1d | 30 | 1.02mi |
| 575 Oak Trace Ct Jonesboro, GA | 3.0 | 2.0 | 1302 | $1,761 | $1.35 | 43d | 1 | 1.06mi |
| 102 Palisades Pointe Riverdale, GA | 2.0 | 2.5 | 1224 | $1,673 | $1.37 | 4d | 1 | 1.07mi |
| 8147 Mountain Pass Riverdale, GA | 3.0 | 2.0 | 1432 | $1,960 | $1.37 | 5d | 1 | 1.16mi |
| 1000 Lake Ridge Pkwy Riverdale, GA | 2.0 | 2.0 | 1036 | $1,610 | $1.55 | 24d | 1 | 1.16mi |
| 1000 Lake Ridge Pkwy Riverdale, GA | 1.0–3.0 | 1.0–2.0 | 1016 | $1,764 | $1.74 | 43d | 25 | 1.16mi |
| 1000 Lake Ridge Pkwy Unit 0501 Riverdale, GA | 2.0 | 2.0 | 1036 | $1,414 | $1.36 | 3d | 1 | 1.17mi |
| 8931 Wesley Pl Jonesboro, GA | 3.0 | 2.0 | 1216 | $1,498 | $1.23 | 24d | 1 | 1.19mi |
| 372 Cheri Pl Jonesboro, GA | 3.0 | 2.0 | 1468 | $1,749 | $1.19 | 24d | 1 | 1.20mi |
| 8038 Flamingo Dr Jonesboro, GA | 3.0 | 1.5 | 1178 | $1,553 | $1.32 | 24d | 1 | 1.26mi |
| 8268 Dunellen Ln Jonesboro, GA | 4.0 | 2.0 | 1352 | $1,805 | $1.34 | 43d | 1 | 1.28mi |
| 8542 Taylor Rd Riverdale, GA | 3.0 | 1.0 | 1120 | $1,435 | $1.28 | 5d | 1 | 1.30mi |
| 655 Post Oak Rd Jonesboro, GA | 3.0 | 1.0 | 1302 | $1,600 | $1.23 | 15d | 1 | 1.32mi |
Listing history 10 events
-
2026-03-22status Pending
-
2026-03-16historical Active Under Contract
-
2026-03-06$175,000 Active
-
2026-03-05historical $175,000
-
2025-04-30historical
-
2025-04-30historical
-
2025-04-02price $220,000
-
2025-04-02price $220,000
-
2025-03-18$230,000 Active
-
2025-03-18$230,000 New
ⓘ Source: listings_history table (triggers on properties + properties_extension) + one-shot
backfill from property_details.listing_events for pre-trigger history.
Tax reassessment forecast GA · Resets to sale price
- Current annual tax
- $998 · $83/mo
- Projected year-2 tax
- $1,610 · $134/mo
- Expected delta
- +$612/yr (+$51/mo · 61.4%)
ⓘ Screening estimate from a state-policy table — verify with the county assessor before closing.
Climate risk First Street
- Flood 1/10 Low FEMA zone X (unshaded) · 0% chance over 30 yrs
- Wildfire 3/10 Moderate
- Heat 5/10 Major 7 d/yr ≥105°F today · 17 d/yr by 30 yrs out
- Wind 6/10 Major 27% chance of damaging wind over 30 yrs
- Air quality 4/10 Moderate 4 unhealthy d/yr today · 6 by 30 yrs out
Nearby sold comps map
Loading sold comps map…
Walkable amenities ~0.75 mi
Loading nearby amenities…
Taxation est. · year 1
- Rental income
- $20,171
- − Mortgage interest
- −$9,803
- − Property taxes
- −$998
- − Insurance
- −$875
- − Repairs & maintenance
- −$1,614
- − Management
- −$1,614
- − Depreciation
- −$5,091
- Taxable income
- $178
- Est. tax owed @ 24.0%
- −$43
- After-tax cash flow
- $3,008/yr
For passive investors: Depreciation is non-cash, so a rental often shows a tax loss while cash-flowing — sheltering income. Rental losses are passive: they offset passive income freely, and up to $25,000/yr can offset ordinary (W-2) income if you actively participate and your MAGI is under $100k (phasing out to $0 by $150k); unused losses carry forward. On sale, claimed depreciation is recaptured at up to 25%, and gains may owe capital-gains tax (a 1031 exchange can defer both). Figures are a year-1 estimate at your 24.0% rate — not tax advice; consult a CPA.
Schools (NCES district)
- District
- Clayton County
- NCES district ID
- 1301230
- Math proficiency
- 11% ▼ -13.00%
- Reading proficiency
- 20% ▼ -9.00%
- Median HH income
- $42,266
- Composite
- 13.41/100
- National rank
- #9527
- State rank
- #155 of 174 in GA
Livability — Riverdale
- Score
- 70/100
- State rank
- #100
- US rank
- #7907
Category grades
Schools grade is shown separately in the Schools card above.
Census & demographics
- County
- Clayton County · 230,153 people
- City population
- 61,126
- Metro
- Atlanta-Sandy Springs-Alpharetta, GA
- Population (ZIP)
- 34,081
- Household income
- $52,209
- Rent vs Own
- Severe rent burden
- 2586.0
Population outlook (Clayton County) Hauer SSP2
- Today (2025)
- 310,777 people
- By 2030
- 329,762 · +6.1%
- By 2040
- 368,052 · +18.4%
- By 2050
- 401,196 · +29.1%
- By 2075
- 472,488 · +52.0%
- By 2100
- 500,446 · +61.0%
Race, ethnicity, and origin ACS 2023
- Neighborhood character
- Predominantly Black (76%)
- Race & ethnicity
- Black 76% Hispanic / Latino 14% Two or more races 5% Asian 5% White 5%
- Hispanic origin (detail)
- Mexican 9% Puerto Rican 1%
- Foreign-born
- 15% · Canada, Vietnam
- Languages at home
- 80% English-only · Spanish 12% Vietnamese 2% Other Asian/Pacific 2%
Political lean MEDSL · Clayton
- 2024 margin
- Solid D (+69.2) · D 84.3% · R 15.1%
- 2008→2024 swing
- +2.8pp toward D · 2008: 66.4pp · 2024: 69.2pp
- All cycles
- 2024: D+69.2 2020: D+70.9 2016: D+71.9 2012: D+70.1 2008: D+66.4
Not yet ingested
- Civics
- —
Market trends
- HPI YoY
- ▼ -57.82%
- Current HPI
- 236.3592
- Rent YoY
- ▲ 1.30%
- Metro
- Atlanta-Sandy Springs-Alpharetta, GA
- State GDP YoY
- ▲ 2.66%
- F500 in state
- 28
Industry mix (Fortune 500 HQ in GA)
| Industry | F500 HQs | Revenue |
|---|---|---|
| Paper / Packaging | 2 | $29B |
|
||
| Retail | 1 | $160B |
|
||
| Transportation / Logistics | 1 | $91B |
|
||
| Airlines | 1 | $62B |
|
||
| Consumer Goods | 1 | $47B |
|
||
| Utilities | 1 | $25B |
|
||
Price history
-23.9% since first listed10 events — show timeline
- 2026-03-22 Pending — FMLS
- 2026-03-16 Contingent — FMLS
- 2026-03-06 Listed $175,000 FMLS
- 2026-03-05 Coming Soon $175,000 FMLS
- 2025-04-30 Listing Removed — GAMLS
- 2025-04-30 Listing Removed — FMLS
- 2025-04-02 Price Changed $220,000 GAMLS
- 2025-04-02 Price Changed $220,000 FMLS
- 2025-03-18 Listed $230,000 GAMLS
- 2025-03-18 Listed $230,000 FMLS
Property tax history
+9.4%/yrLatest (2025): $998 · -2.2% YoY. Source: county tax records.
Cash-flow waterfall
monthlySold comps — $/sqft
last 12 mo · ≤1 miLoading sold comps…