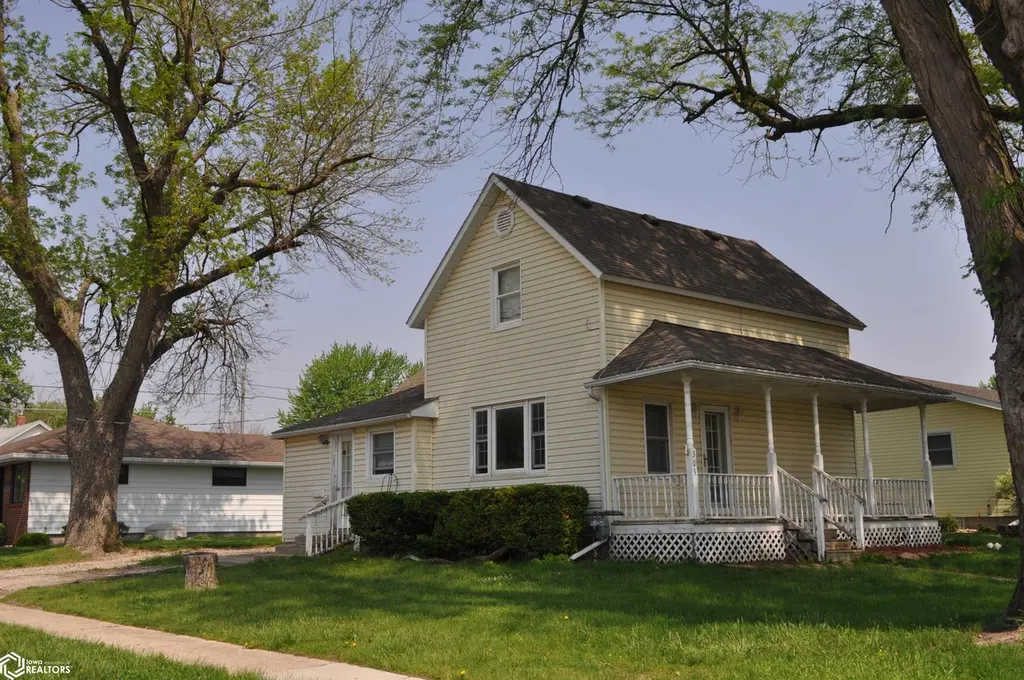
303 West St · Carroll, IA
Flood risk 1/10 · Minimal
- FEMA flood zone
- X (unshaded)
- Chance of flooding over 30 yrs
- 0.0%
- Est. flood insurance / yr
- $473 – $860
Fire risk 4/10 · Minor
- Est. fire insurance / yr
- $902 – $1,676
Heat risk 2/10 · Minimal
- Hot days now (above 101°F)
- 7 days/yr
- Hot days in 30 yrs
- 15 days/yr
Wind risk 2/10 · Minimal
- Chance of severe wind over 30 yrs
- —
Air-quality risk 1/10 · Minimal
- Unhealthy air days now
- 0 days/yr
- Unhealthy air days in 30 yrs
- 0 days/yr
Risk factors via First Street. Map © Google.
Why this score? — see what drove the C grade
The composite is a weighted blend of 9 inputs, each scored 0–100. Each bar is that input's sub-score; the figure is the points it added to the 100-point composite (weight × sub-score).
- Cash flow +18.2/30.0
- ARV discount +12.9/15.0
- Schools +6.1/10.0
- DSCR +5.7/10.0
- 1% rule +4.1/10.0
- Livability +4.1/5.0
- Rent growth +2.5/5.0
- Condition / age +2.5/5.0
- Appreciation +0.0/10.0
$125,000
🖨 Deal sheet 📄 Offer letter ✓ Due diligence
Listing remarks
Take a look at this 3 bed, 1 bath home which features a main floor bedroom and main floor laundry. Vinyl siding, replacement windows, and other updated features highlight this home. Detached single car garage. Priced to sell! Call today
Key facts
- Main floor laundry
- Vinyl siding
- Main floor bedroom
Tags
Property features AI
Finance
- Financial info: Annual tax amount reported
Exterior
- Parking: Detached 1-car garage
- Utilities: Public water; Public sewer
- Home design: Single-family residence; One and one-half stories
- Construction: Vinyl siding; Foundation area approximately 1,185
- Exterior features: Lot approximately 0.13 acres (66 x 86)
Interior
- Bathrooms: One full bathroom
- Heating & cooling: Central air conditioning; Forced air heating
- Interior features: Basement present
Neighborhood map
What this means for you Summary
Snapshot
- This is a 3-bed/1.0-bath single-family listed at $125k.
Deal economics
- At list price, monthly cash flow is $113 ($1k/yr) — positive.
- The deal already cash-flows at list — no discount required.
- To meet the 1% rule (rent ≥ 1% of price), the offer needs to be $114k (8.9% below list).
- Recommended offer: $114k (8.9% below list) — sets the bar for 1% rule.
- Cap rate 7.4% vs local median 3.2% in Carroll — top-decile yield for the area; either an underpriced asset or a hidden risk that comps aren't pricing in. Stress-test before assuming the spread holds.
Location & tenants
- Location reads 82/100 on livability (#54 in IA, #1,282 nationally) — a professional / high-income tenant draw. Strengths: crime A+, cost of living A+, housing A+; Watch: amenities D+, commute F.
- Carroll Community School District (town): math 72% / reading 72% proficiency, ranked #113 of 289 in IA (top 39%) — strong family-tenant draw, lease renewals of 3-5y typical.
- Market conditions: 92 active listings in the ZIP; 32 units permitted in Carroll County in 2024 (0 in 5+ unit buildings).
Forward outlook
- Local home prices are declining (-3.0%/yr); year-one equity from $864 of loan paydown is wiped out by about $4k of value loss. Plan a longer hold.
- Carroll County population projected at -13% by 2050 — secular population decline; favor cash flow + early exit over multi-decade hold.
Negotiation context
- Only 2 days on market — expect competitive offers; lowballing is unlikely to land.
- 2 sale attempts since 2y ago with the ask held roughly flat each time — persistent listings suggest the price (not the market) is what's stuck; bring a comps-based counter.
Risks & watch-outs
- Watch-outs: built in 1890 — expect roof / HVAC / electrical / plumbing capex.
Questions for the listing agent
- Built in 1890 — when were the roof, HVAC, electrical panel, plumbing, and water heater last replaced?
- Is there a deadline driving the sale (1031 exchange, divorce, estate, relocation)? That informs how much negotiation room exists.
- Schools are A-rated — typically a magnet for longer-tenancy family renters. What's the average tenant stay here, and is there a school-zone premium baked into asking?
- What's the average days-on-market for RENTAL listings here right now (not sales)? A rising rental-DOM trend means longer vacancies and softer asking-rent achievability than the comps imply.
- What's the recent tenant-quality profile in this submarket — average credit score on applications, eviction rate, late-payment / NSF rate, and stable-employment percentage? A property-management company in the area should have these aggregated.
- How much new for-sale + rental construction is in the pipeline within 1–3 miles? Heavy new supply typically softens prices + rents 12–24 months out; constrained supply supports both.
Investment metrics
- 1% rule
- 0.91% ✗
- Cap rate
- 7.38%
- Cash-on-cash
- 3.88%
- DSCR
- 1.17
- GRM
- 9.1
CMA / ARV
- ARV (on-the-fly)
- $142,200
- Comps found
- 12
Show comp detail 12 sales within ~0.75 mi
| Address | Dist | Beds/Ba | Sqft | Sold | Price | $/sf | Match |
|---|---|---|---|---|---|---|---|
| 209 N East St | 0.48mi | 3/1.0 | 1,200 (+1%) | 11mo | $135,000 | $113 | 67 |
| 326 N West St | 0.06mi | 2/1.0 (-1) | 1,008 (-15%) | 2mo | $65,000 | $64 | 66 |
| 807 N Court St | 0.49mi | 3/1.0 | 1,089 (-8%) | 6mo | $65,000 | $60 | 58 |
| 1021 Simon Ave | 0.59mi | 3/1.0 | 1,128 (-5%) | 10mo | $132,000 | $117 | 56 |
| 926 N Court St | 0.61mi | 2/2.0 (-1) | 1,124 (-5%) | 3mo | $179,500 | $160 | 52 |
| 926 Boylan Ave | 0.56mi | 3/1.0 | 1,316 (+11%) | 10mo | $99,500 | $76 | 47 |
| 1036 N Crawford St | 0.61mi | 2/2.5 (-1) | 1,247 (+5%) | 7mo | $150,000 | $120 | 46 |
| 519 E 1st St | 0.63mi | 3/1.5 | 1,040 (-12%) | 3mo | $151,500 | $146 | 46 |
| 318 W 13th St | 0.69mi | 2/2.0 (-1) | 1,244 (+5%) | 6mo | $169,660 | $136 | 45 |
| 204 W 11th St | 0.62mi | 2/1.0 (-1) | 1,301 (+10%) | 8mo | $143,000 | $110 | 44 |
| 308 Prairie View Dr | 0.52mi | 4/3.0 (+1) | 1,334 (+13%) | 5mo | $320,000 | $240 | 37 |
| 641 W 14th St | 0.67mi | 2/1.5 (-1) | 1,007 (-15%) | 0mo | $180,000 | $179 | 36 |
Match score weights: distance 35% · size 25% · config 20% · recency 20%. Top-matched comps best support the ARV.
Projected returns pro-forma
-3.0% appreciation · 3.0% rent growth · sell at horizon
- IRR
- -10.2%
- Equity multiple
- 0.63×
- Total profit
- $-13,076
- Equity at exit
- $18,638
- IRR
- -0.9%
- Equity multiple
- 0.94×
- Total profit
- $-2,225
- Equity at exit
- $10,808
Cash invested: $35,000 (down + closing). Projections, not guarantees.
Landlord ↔ Tenant lean methodology
- Overall (STATE)
- 83 Strongly Landlord-Friendly
- State Iowa
- 83 Strongly Landlord-Friendly · R+6
- County
- — inherits STATE
- City
- — inherits STATE
ZIP-level market 51401
- Home prices YoY
- -22.3%
- Active inventory
- 92
- Price-to-rent
- 9.1×
Monthly cashflow live
- Estimated rent
- $1,139 medium interval (Pro) →
- Mortgage (P&I)
- −$656
- Tax from tax record
- −$79 /mo · $948/yr
- Insurance
- −$52
- HOA
- −$0
- Vacancy / Maint / Mgmt
- −$239
- Net cashflow
- $113
Break-even live
UW: 25.0% down · 7.5% · 30yr · 1.5% tax · 5.0% vac · 8.0% maint · 8.0% mgmt
Financing live
Cash to close
- Down payment
- $31,250
- Closing costs
- $3,750
- Reserves months
- —
- Total cash needed
- —
Loan-product check · same deal, 3 products live
Conventional
25% down · 7.5% · 30yr
- Down + closing
- —
- Monthly P&I
- —
- Monthly cashflow
- —
- DSCR
- —
- Eligible?
- —
Personal DTI + credit; lowest rate.
DSCR
20% down · 8.5% · 30yr
- Down + closing
- —
- Monthly P&I
- —
- Monthly cashflow
- —
- DSCR
- —
- Eligible?
- —
No personal income docs; deal must DSCR.
Hard money
10% down · 12.0% · 12mo
- Down + closing
- —
- Monthly P&I
- —
- Monthly cashflow
- —
- DSCR
- —
- Eligible?
- —
Short-term bridge; refi at stabilization.
Listing history 3 events
-
2026-06-04days on market $125,000 Active 2 DOM
-
2026-06-02remarks 236-char remark
-
2026-06-02$125,000 Active 1 DOM
ⓘ Source: listings_history table (triggers on properties + properties_extension) + one-shot
backfill from property_details.listing_events for pre-trigger history.
Tax reassessment forecast IA · Partial reset (capped growth)
- Current annual tax
- $948 · $79/mo
- Projected year-2 tax
- $1,455 · $121/mo
- Expected delta
- +$507/yr (+$42/mo · 53.5%)
ⓘ Screening estimate from a state-policy table — verify with the county assessor before closing.
Climate risk First Street
- Flood 1/10 Low FEMA zone X (unshaded) · 0% chance over 30 yrs
- Wildfire 4/10 Moderate
- Heat 2/10 Low 7 d/yr ≥101°F today · 15 d/yr by 30 yrs out
- Wind 2/10 Low
- Air quality 1/10 Low 0 unhealthy d/yr today · 0 by 30 yrs out
Nearby sold comps map
Loading sold comps map…
Walkable amenities ~0.75 mi
Loading nearby amenities…
Taxation est. · year 1
- Rental income
- $13,668
- − Mortgage interest
- −$7,002
- − Property taxes
- −$948
- − Insurance
- −$625
- − Repairs & maintenance
- −$1,093
- − Management
- −$1,093
- − Depreciation
- −$3,636
- Taxable loss
- −$730
- Est. tax savings @ 24.0%
- +$175
- After-tax cash flow
- $1,534/yr
For passive investors: Depreciation is non-cash, so a rental often shows a tax loss while cash-flowing — sheltering income. Rental losses are passive: they offset passive income freely, and up to $25,000/yr can offset ordinary (W-2) income if you actively participate and your MAGI is under $100k (phasing out to $0 by $150k); unused losses carry forward. On sale, claimed depreciation is recaptured at up to 25%, and gains may owe capital-gains tax (a 1031 exchange can defer both). Figures are a year-1 estimate at your 24.0% rate — not tax advice; consult a CPA.
Schools (NCES district)
- District
- Carroll Community School District
- NCES district ID
- 1906330
- Math proficiency
- 72% ▼ -6.00%
- Reading proficiency
- 72% ▲ 2.00%
- Median HH income
- $50,124
- Composite
- 61.04/100
- National rank
- #793
- State rank
- #113 of 289 in IA
Livability — Carroll
- Score
- 82/100
- State rank
- #54
- US rank
- #1282
Category grades
Schools grade is shown separately in the Schools card above.
Census & demographics
- Census place
- Carroll, IA
- City population
- 12,113
- Population (ZIP)
- 12,113
Population outlook (Carroll County) Hauer SSP2
- Today (2025)
- 19,745 people
- By 2030
- 19,244 · -2.5%
- By 2040
- 18,251 · -7.6%
- By 2050
- 17,223 · -12.8%
- By 2075
- 16,258 · -17.7%
- By 2100
- 15,591 · -21.0%
Race, ethnicity, and origin ACS 2023
- Neighborhood character
- Predominantly White (92%)
- Race & ethnicity
- White 92% Hispanic / Latino 4% Two or more races 3%
- Common ancestry
- Italian 2% Lithuanian 2% Iranian 1%
- Foreign-born
- 2% · Canada, South Korea
- Languages at home
- 98% English-only · Spanish 2%
Political lean MEDSL · Carroll
- 2024 margin
- Solid R (+41.9) · D 28.4% · R 70.3% · Other 1.4%
- 2008→2024 swing
- -45.6pp toward R · 2008: 3.6pp · 2024: -41.9pp
- All cycles
- 2024: R+41.9 2020: R+37.8 2016: R+31.8 2012: R+6.3 2008: D+3.6
Not yet ingested
- Civics
- —
Market trends
- HPI YoY
- ▼ -76.74%
- Current HPI
- 267.0068
- Rent YoY
- —
- Metro
- —
- State GDP YoY
- ▲ 2.48%
- F500 in state
- 4
Industry mix (Fortune 500 HQ in IA)
| Industry | F500 HQs | Revenue |
|---|---|---|
| Financial Services | 1 | $16B |
|
||
| Retail / Convenience | 1 | $15B |
|
||
Price history
+0.0% since first listed3 events — show timeline
- 2026-06-01 Listed $125,000 IAR
- 2024-06-03 Price Changed $119,000 IAR
- 2024-05-14 Listed $125,000 IAR
Property tax history
+3.1%/yrLatest (2025): $948 · +2.4% YoY. Source: county tax records.
Cash-flow waterfall
monthlySold comps — $/sqft
last 12 mo · ≤1 miLoading sold comps…