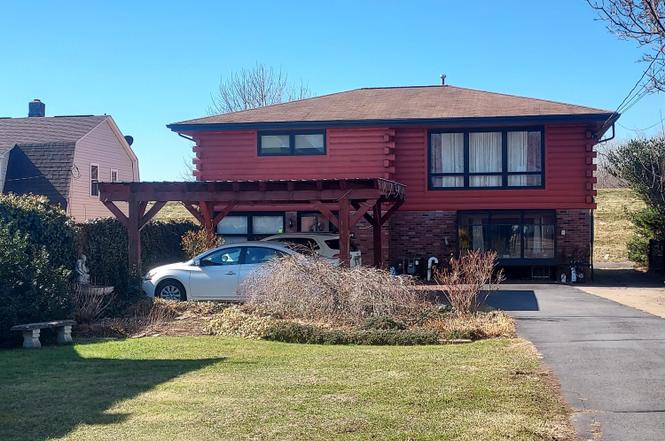
372 Union St · Pringle, PA
Flood risk 7/10 · Major
- FEMA flood zone
- X (unshaded)
- Chance of flooding over 30 yrs
- 0.78%
- Est. flood insurance / yr
- $507 – $1,088
Fire risk 3/10 · Minor
- Est. fire insurance / yr
- $511 – $949
Heat risk 4/10 · Minor
- Hot days now (above 97°F)
- 7 days/yr
- Hot days in 30 yrs
- 16 days/yr
Wind risk 3/10 · Minor
- Chance of severe wind over 30 yrs
- 5.0%
Air-quality risk 3/10 · Minor
- Unhealthy air days now
- 2 days/yr
- Unhealthy air days in 30 yrs
- 4 days/yr
Risk factors via First Street. Map © Google.
Why this score? — see what drove the D grade
The composite is a weighted blend of 9 inputs, each scored 0–100. Each bar is that input's sub-score; the figure is the points it added to the 100-point composite (weight × sub-score).
- Appreciation +10.0/10.0
- Cash flow +9.0/30.0
- ARV discount +8.6/15.0
- Livability +3.9/5.0
- DSCR +2.5/10.0
- Rent growth +2.5/5.0
- Schools +2.5/10.0
- Condition / age +2.5/5.0
- 1% rule +2.4/10.0
$255,000
🖨 Deal sheet 📄 Offer letter ✓ Due diligence
Listing remarks
4 Bedroom 2 bath well cared for Raised Ranch with log cabin style siding. Beautiful hardwood floors in Living room and dining room. Enjoy the covered porch and deck in private setting in the rear of the home. The backyard extends behind the neighboring properties on each side. Master bedroom on lower level with jacuzzi tub, hw floor and walk-in closet. 2 car carport and extra parking in rear.
Key facts
- 0.23 acre lot
- 2 garage spots
- Listed 6 days
Neighborhood map
What this means for you Summary
Snapshot
- This is a 4-bed/2.0-bath single-family listed at $255k.
Deal economics
- At list price, monthly cash flow is $-267 ($-3k/yr) — negative.
- To cash-flow at today's rent, offer at most $208k (18.5% below list).
- To meet the 1% rule (rent ≥ 1% of price), the offer needs to be $188k (26.1% below list).
- Recommended offer: $188k (26.1% below list) — sets the bar for 1% rule.
Location & tenants
- Location reads 77/100 on livability (#337 in PA, #2,954 nationally) — a middle-class / working-renter tenant base. Strengths: cost of living A+, housing A+, health & safety A+; Watch: employment D+, commute F.
- Wyoming Valley West SD (suburban): math 18% / reading 42% proficiency, ranked #445 of 539 in PA (top 83%) — families likely to look elsewhere, expect single-tenant / working-renter base with shorter leases.
- Market conditions: 17 active listings in the ZIP; 9 comparable units currently listed for rent nearby; rentals at typical pace (median 21d on market — plan ~3-4 weeks tenant-placement turnaround); 349 units permitted in Luzerne County in 2024 (16 in 5+ unit buildings).
Forward outlook
- In year one you build about $27k of equity ($2k loan paydown + $26k appreciation (10.0% local appreciation)).
- Luzerne County population projected at +4% by 2050 — modest demand growth; plan on rents tracking national, not racing it.
- By year 2, paydown + projected appreciation supports a ~$44k cash-out refi (75% LTV) — recoverable capital for the next deal without selling this one.
Negotiation context
- Only 6 days on market — expect competitive offers; lowballing is unlikely to land.
Risks & watch-outs
- Watch-outs: flood insurance adds $66/mo; built in 1950 — expect roof / HVAC / electrical / plumbing capex.
- Climate carrying-cost: major flood risk — expect insurance premiums to compound above CPI over the hold.
Questions for the listing agent
- What do current leases actually rent for vs. the listed asking? Can we see a recent rent roll and the last 12 months of T-12 income?
- Built in 1950 — when were the roof, HVAC, electrical panel, plumbing, and water heater last replaced?
- What's the actual annual flood-insurance premium (NFIP or private), and is the property in a SFHA with mandatory coverage?
- Is there a deadline driving the sale (1031 exchange, divorce, estate, relocation)? That informs how much negotiation room exists.
- Schools are B-rated — typically a magnet for longer-tenancy family renters. What's the average tenant stay here, and is there a school-zone premium baked into asking?
- The area grade is low — what's the realistic commute time and amenity access for the typical tenant pool here? Any planned neighborhood developments (good or bad) we should know about?
- What's the average days-on-market for RENTAL listings here right now (not sales)? A rising rental-DOM trend means longer vacancies and softer asking-rent achievability than the comps imply.
- What's the recent tenant-quality profile in this submarket — average credit score on applications, eviction rate, late-payment / NSF rate, and stable-employment percentage? A property-management company in the area should have these aggregated.
- How much new for-sale + rental construction is in the pipeline within 1–3 miles? Heavy new supply typically softens prices + rents 12–24 months out; constrained supply supports both.
Investment metrics
- 1% rule
- 0.74% ✗
- Cap rate
- 5.35%
- Cash-on-cash
- -3.37%
- DSCR
- 0.85
- GRM
- 11.3
CMA / ARV
- ARV (on-the-fly)
- $261,516
- Comps found
- 12
Show comp detail 12 sales within ~0.75 mi
| Address | Dist | Beds/Ba | Sqft | Sold | Price | $/sf | Match |
|---|---|---|---|---|---|---|---|
| 22 Pettebone St | 0.65mi | 3/1.5 (-1) | 2,300 (+0%) | 1mo | $305,000 | $133 | 61 |
| 86 Dorrance St | 0.47mi | 5/2.0 (+1) | 2,220 (-3%) | 10mo | $245,000 | $110 | 59 |
| 16 Flannagan St | 0.55mi | 4/2.0 | 2,109 (-8%) | 4mo | $269,500 | $128 | 58 |
| 262 Bennett St | 0.30mi | 5/2.0 (+1) | 2,089 (-9%) | 12mo | $196,000 | $94 | 57 |
| 317 Frederick St | 0.49mi | 3/1.0 (-1) | 2,200 (-4%) | 7mo | $175,000 | $80 | 55 |
| 32 Hughes St | 0.43mi | 3/1.0 (-1) | 2,162 (-6%) | 9mo | $213,000 | $99 | 54 |
| 7 Korn St | 0.61mi | 3/1.5 (-1) | 2,208 (-4%) | 10mo | $285,000 | $129 | 50 |
| 129 Vaughn St | 0.35mi | 5/3.0 (+1) | 2,496 (+9%) | 13mo | $290,000 | $116 | 49 |
| 756 Bennett St | 0.69mi | 4/2.0 | 2,126 (-7%) | 16mo | $110,000 | $52 | 42 |
| 51 Pettebone St | 0.65mi | 4/1.5 | 2,001 (-13%) | 8mo | $228,000 | $114 | 39 |
| 433 Chestnut Ave | 0.71mi | 4/2.0 | 2,012 (-12%) | 14mo | $176,000 | $87 | 35 |
| 45 Broad St | 0.64mi | 3/2.5 (-1) | 2,033 (-11%) | 20mo | $240,000 | $118 | 28 |
Match score weights: distance 35% · size 25% · config 20% · recency 20%. Top-matched comps best support the ARV.
Projected returns pro-forma
10.0% appreciation · 3.0% rent growth · sell at horizon
- IRR
- 21.1%
- Equity multiple
- 2.71×
- Total profit
- $121,896
- Equity at exit
- $229,724
- IRR
- 19.1%
- Equity multiple
- 6.22×
- Total profit
- $372,386
- Equity at exit
- $495,409
Cash invested: $71,400 (down + closing). Projections, not guarantees.
Landlord ↔ Tenant lean methodology
- Overall (STATE)
- 62 Landlord-Friendly
- State Pennsylvania
- 62 Landlord-Friendly · EVEN
- County
- — inherits STATE
- City
- — inherits STATE
ZIP-level market 18709
- Home prices YoY
- 12.7%
- Active inventory
- 17
- Price-to-rent
- 11.3×
Monthly cashflow live
- Estimated rent
- $1,883 high interval (Pro) →
- Mortgage (P&I)
- −$1,337
- Tax from tax record
- −$245 /mo · $2,940/yr
- Insurance
- −$106
- Flood insurance flood zone
- −$66 /mo · $798/yr
- HOA
- −$0
- Vacancy / Maint / Mgmt
- −$396
- Net cashflow
- $-267
Break-even live
UW: 25.0% down · 7.5% · 30yr · 1.5% tax · 5.0% vac · 8.0% maint · 8.0% mgmt
Financing live
Cash to close
- Down payment
- $63,750
- Closing costs
- $7,650
- Reserves months
- —
- Total cash needed
- —
Loan-product check · same deal, 3 products live
Conventional
25% down · 7.5% · 30yr
- Down + closing
- —
- Monthly P&I
- —
- Monthly cashflow
- —
- DSCR
- —
- Eligible?
- —
Personal DTI + credit; lowest rate.
DSCR
20% down · 8.5% · 30yr
- Down + closing
- —
- Monthly P&I
- —
- Monthly cashflow
- —
- DSCR
- —
- Eligible?
- —
No personal income docs; deal must DSCR.
Hard money
10% down · 12.0% · 12mo
- Down + closing
- —
- Monthly P&I
- —
- Monthly cashflow
- —
- DSCR
- —
- Eligible?
- —
Short-term bridge; refi at stabilization.
Rent comps 9 comps
| Address | Beds | Baths | Sqft | Rent | $/sqft | DOM | Units | Dist |
|---|---|---|---|---|---|---|---|---|
| 147 W Dorrance St Kingston, PA | 3.0 | 1.5 | 2000 | $1,900 | $0.95 | 21d | 1 | 0.32mi |
| 143 W Dorrance St Kingston, PA | 5.0 | 1.5 | 2200 | $2,500 | $1.14 | 21d | 1 | 0.33mi |
| 255 Zerby Ave Kingston, PA | 3.0 | 1.0 | 2380 | $1,350 | $0.57 | 21d | 1 | 0.66mi |
| 365 N Maple Ave Kingston, PA | 3.0 | 1.0 | 1600 | $1,400 | $0.88 | 21d | 1 | 0.79mi |
| 54 Butler St Kingston, PA | 4.0 | 2.5 | 2174 | $2,000 | $0.92 | 44d | 1 | 0.83mi |
| 56 E Grove St Kingston, PA | 3.0 | 2.0 | 2296 | $1,250 | $0.54 | 21d | 1 | 0.94mi |
| 58 Jackson St Kingston, PA | 4.0 | 2.0 | 1600 | $2,000 | $1.25 | 44d | 1 | 1.11mi |
| 79 Washington St Kingston, PA | 4.0 | 1.5 | 1800 | $1,750 | $0.97 | 13d | 1 | 1.26mi |
| 321 Shoemaker St Kingston, PA | 3.0 | 1.5 | 1598 | $1,750 | $1.10 | 21d | 1 | 1.27mi |
Listing history 2 events
-
2026-03-17status Pending
-
2026-03-11$255,000 Active
ⓘ Source: listings_history table (triggers on properties + properties_extension) + one-shot
backfill from property_details.listing_events for pre-trigger history.
Tax reassessment forecast PA · Partial reset (capped growth)
- Current annual tax
- $2,940 · $245/mo
- Projected year-2 tax
- $3,485 · $290/mo
- Expected delta
- +$544/yr (+$45/mo · 18.5%)
ⓘ Screening estimate from a state-policy table — verify with the county assessor before closing.
Climate risk First Street
- Flood 7/10 Severe FEMA zone X (unshaded) · 78% chance over 30 yrs
- Wildfire 3/10 Moderate
- Heat 4/10 Moderate 7 d/yr ≥97°F today · 16 d/yr by 30 yrs out
- Wind 3/10 Moderate 5% chance of damaging wind over 30 yrs
- Air quality 3/10 Moderate 2 unhealthy d/yr today · 4 by 30 yrs out
Nearby sold comps map
Loading sold comps map…
Walkable amenities ~0.75 mi
Loading nearby amenities…
Taxation est. · year 1
- Rental income
- $22,602
- − Mortgage interest
- −$14,284
- − Property taxes
- −$2,940
- − Insurance
- −$2,072
- − Repairs & maintenance
- −$1,808
- − Management
- −$1,808
- − Depreciation
- −$7,418
- Taxable loss
- −$7,730
- Est. tax savings @ 24.0%
- +$1,855
- After-tax cash flow
- $-1,349/yr
For passive investors: Depreciation is non-cash, so a rental often shows a tax loss while cash-flowing — sheltering income. Rental losses are passive: they offset passive income freely, and up to $25,000/yr can offset ordinary (W-2) income if you actively participate and your MAGI is under $100k (phasing out to $0 by $150k); unused losses carry forward. On sale, claimed depreciation is recaptured at up to 25%, and gains may owe capital-gains tax (a 1031 exchange can defer both). Figures are a year-1 estimate at your 24.0% rate — not tax advice; consult a CPA.
Schools (NCES district)
- District
- Wyoming Valley West SD
- NCES district ID
- 4225950
- Math proficiency
- 18% ▼ -11.00%
- Reading proficiency
- 42% ▼ -12.00%
- Median HH income
- $42,437
- Composite
- 25.38/100
- National rank
- #7470
- State rank
- #445 of 539 in PA
Livability — Pringle
- Score
- 77/100
- State rank
- #337
- US rank
- #2954
Category grades
Schools grade is shown separately in the Schools card above.
Census & demographics
- Census place
- Pringle, PA
- City population
- 30,997
- Population (ZIP)
- 2,959
Population outlook (Luzerne County) Hauer SSP2
- Today (2025)
- 319,505 people
- By 2030
- 319,943 · +0.1%
- By 2040
- 322,643 · +1.0%
- By 2050
- 330,817 · +3.5%
- By 2075
- 379,145 · +18.7%
- By 2100
- 431,908 · +35.2%
Race, ethnicity, and origin ACS 2023
- Neighborhood character
- Predominantly White (89%)
- Race & ethnicity
- White 89% Two or more races 6% Black 4% Hispanic / Latino 1%
- Common ancestry
- Romanian 18% Scotch-Irish 8% Iranian 4%
- Foreign-born
- 1%
- Languages at home
- 99% English-only · Other Indo-European 1%
Political lean MEDSL · Luzerne
- 2024 margin
- R (+19.2) · D 40.0% · R 59.2%
- 2008→2024 swing
- -27.6pp toward R · 2008: 8.4pp · 2024: -19.2pp
- All cycles
- 2024: R+19.2 2020: R+14.4 2016: R+19.6 2012: D+4.8 2008: D+8.4
Not yet ingested
- Civics
- —
Market trends
- HPI YoY
- ▲ 28.54%
- Current HPI
- 254.1718
- Rent YoY
- —
- Metro
- —
- State GDP YoY
- ▲ 1.68%
- F500 in state
- 34
Industry mix (Fortune 500 HQ in PA)
| Industry | F500 HQs | Revenue |
|---|---|---|
| Healthcare | 2 | $309B |
|
||
| Insurance | 2 | $27B |
|
||
| Telecommunications / Media | 1 | $124B |
|
||
| Industrial Distribution | 1 | $22B |
|
||
| Financial Services | 1 | $20B |
|
||
| Chemicals / Materials | 1 | $18B |
|
||
Price history
2 events — show timeline
- 2026-03-17 Pending — LCAR
- 2026-03-11 Listed $255,000 LCAR
Property tax history
+2.0%/yrLatest (2026): $2,940 · +0.4% YoY. Source: county tax records.
Cash-flow waterfall
monthlySold comps — $/sqft
last 12 mo · ≤1 miLoading sold comps…