 🔨 Auction
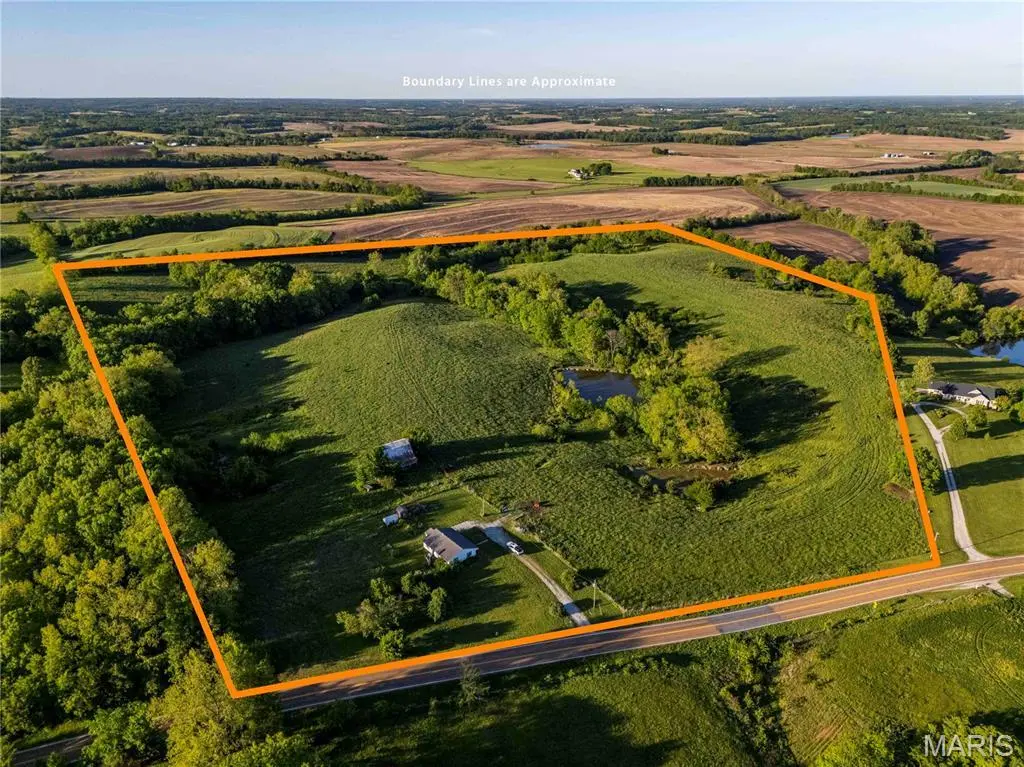
6096 Highway 87 · Franklin, MO
Flood risk 1/10 · Minimal
- FEMA flood zone
- X (unshaded)
- Chance of flooding over 30 yrs
- 0.0%
- Est. flood insurance / yr
- $507 – $1,088
Fire risk 3/10 · Minor
- Est. fire insurance / yr
- $1,054 – $1,958
Heat risk 4/10 · Minor
- Hot days now (above 106°F)
- 7 days/yr
- Hot days in 30 yrs
- 18 days/yr
Wind risk 2/10 · Minimal
- Chance of severe wind over 30 yrs
- —
Air-quality risk 2/10 · Minimal
- Unhealthy air days now
- 0 days/yr
- Unhealthy air days in 30 yrs
- 1 days/yr
Risk factors via First Street. Map © Google.
Why this score? — see what drove the C- grade
The composite is a weighted blend of 9 inputs, each scored 0–100. Each bar is that input's sub-score; the figure is the points it added to the 100-point composite (weight × sub-score).
- Cash flow +15.0/30.0
- ARV discount +7.5/15.0
- Appreciation +6.3/10.0
- 1% rule +5.0/10.0
- DSCR +5.0/10.0
- Schools +3.6/10.0
- Livability +2.6/5.0
- Rent growth +2.5/5.0
- Condition / age +2.5/5.0
$1
🖨 Deal sheet 📄 Offer letter ✓ Due diligence
Listing remarks
AUCTION LISTING - List price is not indicative of Seller’s final reserve amount. This property is part of an online bidding event. This sale will be executed with a no-contingency contract provided by the brokerage representing the Seller. See MLS Supplement Document for complete details. Just north of Boonville with Highway 87 frontage, this southern Howard County farm consisting of 63.1± acres offers a strong combination of productive pasture ground, livestock setup, and country living. The farm is well-suited for cattle with established fencing already in place, multiple scattered ponds for water sources, and gently rolling pasture that lies well. From several spots across t
Key facts
- Livestock setup
- Established fencing
- Highway 87 frontage
Tags
Property features AI
Finance
- Other: Approximately 63.1 acres
- Financial info: Auction listed; Lease not considered
Exterior
- Parking: Gravel parking
- Utilities: Public water available; Septic required; Electricity connected (single-phase); Propane available; Phone service available
- Home design: Single-family house; One story; Private ownership; Property described as fixer
- Construction: Frame construction; Shingle roof; Block and combination foundation; Built (year per public records)
- Exterior features: Wire fencing; Barn(s) on property; Pond on the lot; Meadow, pasture and scattered woods; Rolling slope and secluded setting; Suitable for horses; Asphalt road access
Interior
- Kitchen: Gas range
- Bedrooms: Three bedrooms on the main level
- Flooring: Linoleum flooring
- Bathrooms: One full bathroom (main level)
- Heating & cooling: Propane forced-air heating; Other cooling
- Interior features: Gas range; Unfinished basement; No fireplace
Neighborhood map
What this means for you Summary
Snapshot
- This is a 3-bed/1.0-bath other listed at $1.
Deal economics
- At list price, monthly cash flow is $838 ($10k/yr) — positive.
- The deal already cash-flows at list — no discount required.
- Meets the 1% rule at list price ($1k rent vs $1).
Location & tenants
- Location reads 52/100 on livability (#846 in MO) — a working-class tenant base; expect higher turnover. Strengths: cost of living A+, crime A; Watch: amenities F, commute F, employment F.
- New Franklin R-I (town): math 34% / reading 52% proficiency, ranked #116 of 324 in MO (top 36%) — families likely to look elsewhere, expect single-tenant / working-renter base with shorter leases.
- Zoned schools: New Franklin Elementary (math 47% / reading 47%, grade D-, #347 of 1,115 statewide, top 35%, 203 students, 37% FRL); New Franklin Middle-High (math 22% / reading 57%, grade F, #247 of 521 statewide, top 55%, 219 students, 32% FRL) — zoned schools at 35% FRL track the district average.
- Market conditions: 15 active listings in the ZIP; 9 units permitted in Howard County in 2024 (5 in 5+ unit buildings).
Forward outlook
- Howard County population projected to shrink 6% by 2050 — rents likely to lag national; underwrite the cash flow, not the appreciation.
- At projected returns (2.7% appreciation + 3.0% rent growth), your $0 cash investment doubles in ~1 year — after that, you're playing with house money.
Negotiation context
- It's been on market 33 days — a 3% lower offer ($0) is reasonable based on typical stale-listing flexibility.
Questions for the listing agent
- It's been on market 33 days. Have you received any prior offers? Is the seller open to a 5% concession, seller financing, or rate buy-down credit?
- Built in 1961 — when were the roof, HVAC, electrical panel, plumbing, and water heater last replaced?
- Is there a deadline driving the sale (1031 exchange, divorce, estate, relocation)? That informs how much negotiation room exists.
- Schools are F-rated, which usually means shorter tenancies and higher turnover. Who's the typical renter profile here, and what's been the actual vacancy rate?
- What's the average days-on-market for RENTAL listings here right now (not sales)? A rising rental-DOM trend means longer vacancies and softer asking-rent achievability than the comps imply.
- What's the recent tenant-quality profile in this submarket — average credit score on applications, eviction rate, late-payment / NSF rate, and stable-employment percentage? A property-management company in the area should have these aggregated.
- How much new for-sale + rental construction is in the pipeline within 1–3 miles? Heavy new supply typically softens prices + rents 12–24 months out; constrained supply supports both.
Investment metrics
- 1% rule
- 106032.00% ✓
- Cap rate
- 1005181.36%
- Cash-on-cash
- 3589910.95%
- DSCR
- 159731.84
- GRM
- 0.0
CMA / ARV
No comps found within radius.
Projected returns pro-forma
2.66% appreciation · 3.0% rent growth · sell at horizon
- IRR
- —
- Equity multiple
- 190594.61×
- Total profit
- $53,366
- Equity at exit
- $0
- IRR
- —
- Equity multiple
- 411545.45×
- Total profit
- $115,232
- Equity at exit
- $1
Cash invested: $0 (down + closing). Projections, not guarantees.
Landlord ↔ Tenant lean methodology
- Overall (STATE)
- 81 Strongly Landlord-Friendly
- State Missouri
- 81 Strongly Landlord-Friendly · R+10
- County
- — inherits STATE
- City
- — inherits STATE
ZIP-level market 65274
- Home prices YoY
- 1.4%
- Active inventory
- 15
Monthly cashflow live
- Estimated rent
- $1,060 medium interval (Pro) →
- Mortgage (P&I)
- −$0
- Tax est. 1.5%
- −$0 /mo · $0/yr
- Insurance
- −$0
- HOA
- −$0
- Vacancy / Maint / Mgmt
- −$223
- Net cashflow
- $838
Break-even live
UW: 25.0% down · 7.5% · 30yr · 1.5% tax · 5.0% vac · 8.0% maint · 8.0% mgmt
Financing live
Cash to close
- Down payment
- $0
- Closing costs
- $0
- Reserves months
- —
- Total cash needed
- —
Loan-product check · same deal, 3 products live
Conventional
25% down · 7.5% · 30yr
- Down + closing
- —
- Monthly P&I
- —
- Monthly cashflow
- —
- DSCR
- —
- Eligible?
- —
Personal DTI + credit; lowest rate.
DSCR
20% down · 8.5% · 30yr
- Down + closing
- —
- Monthly P&I
- —
- Monthly cashflow
- —
- DSCR
- —
- Eligible?
- —
No personal income docs; deal must DSCR.
Hard money
10% down · 12.0% · 12mo
- Down + closing
- —
- Monthly P&I
- —
- Monthly cashflow
- —
- DSCR
- —
- Eligible?
- —
Short-term bridge; refi at stabilization.
Listing history 10 events
-
2026-06-12statusdays on market $1 Pending 33 DOM
-
2026-06-09days on market $1 Active 32 DOM
-
2026-06-08days on market $1 Active 31 DOM
-
2026-06-07days on market $1 Active 30 DOM
-
2026-06-05days on market $1 Active 28 DOM
-
2026-06-04days on market $1 Active 26 DOM
-
2026-06-02days on market $1 Active 25 DOM
-
2026-06-01days on market $1 Active 24 DOM
-
2026-05-31days on market $1 Active 23 DOM
-
2026-05-08$1 Active 1363-char remark
ⓘ Source: listings_history table (triggers on properties + properties_extension) + one-shot
backfill from property_details.listing_events for pre-trigger history.
Climate risk First Street
- Flood 1/10 Low FEMA zone X (unshaded) · 0% chance over 30 yrs
- Wildfire 3/10 Moderate
- Heat 4/10 Moderate 7 d/yr ≥106°F today · 18 d/yr by 30 yrs out
- Wind 2/10 Low
- Air quality 2/10 Low 0 unhealthy d/yr today · 1 by 30 yrs out
Nearby sold comps map
Loading sold comps map…
Walkable amenities ~0.75 mi
Loading nearby amenities…
Taxation est. · year 1
- Rental income
- $12,724
- − Mortgage interest
- −$0
- − Property taxes
- −$0
- − Insurance
- −$0
- − Repairs & maintenance
- −$1,018
- − Management
- −$1,018
- − Depreciation
- −$0
- Taxable income
- $10,688
- Est. tax owed @ 24.0%
- −$2,565
- After-tax cash flow
- $7,487/yr
For passive investors: Depreciation is non-cash, so a rental often shows a tax loss while cash-flowing — sheltering income. Rental losses are passive: they offset passive income freely, and up to $25,000/yr can offset ordinary (W-2) income if you actively participate and your MAGI is under $100k (phasing out to $0 by $150k); unused losses carry forward. On sale, claimed depreciation is recaptured at up to 25%, and gains may owe capital-gains tax (a 1031 exchange can defer both). Figures are a year-1 estimate at your 24.0% rate — not tax advice; consult a CPA.
Schools (NCES district)
- District
- New Franklin R-I
- NCES district ID
- 2921940
- Math proficiency
- 34% ▼ -6.00%
- Reading proficiency
- 52% ▲ 1.00%
- Median HH income
- $43,121
- Composite
- 36.25/100
- National rank
- #4711
- State rank
- #116 of 324 in MO
Livability — Franklin
- Score
- 52/100
- State rank
- #846
- US rank
- #24722
Category grades
Schools grade is shown separately in the Schools card above.
Census & demographics
- Population (ZIP)
- 1,886
Population outlook (Howard County) Hauer SSP2
- Today (2025)
- 10,041 people
- By 2030
- 9,994 · -0.5%
- By 2040
- 9,780 · -2.6%
- By 2050
- 9,482 · -5.6%
- By 2075
- 9,009 · -10.3%
- By 2100
- 8,332 · -17.0%
Race, ethnicity, and origin ACS 2023
- Neighborhood character
- Predominantly White (83%)
- Race & ethnicity
- White 83% Two or more races 13% Black 2%
- Common ancestry
- Italian 7% Serbian 1% Scottish 1%
Political lean MEDSL · Howard
- 2024 margin
- Solid R (+44.3) · D 27.1% · R 71.3% · Other 1.6%
- 2008→2024 swing
- -30.4pp toward R · 2008: -13.8pp · 2024: -44.3pp
- All cycles
- 2024: R+44.3 2020: R+42.0 2016: R+41.2 2012: R+26.5 2008: R+13.8
Not yet ingested
- Civics
- —
Market trends
- HPI YoY
- ▲ 2.66%
- Current HPI
- 199.0729
- Rent YoY
- —
- Metro
- —
- State GDP YoY
- ▲ 1.84%
- F500 in state
- 20
Industry mix (Fortune 500 HQ in MO)
| Industry | F500 HQs | Revenue |
|---|---|---|
| Healthcare | 1 | $163B |
|
||
| Insurance | 1 | $21B |
|
||
| Industrial Technology | 1 | $17B |
|
||
| Retail | 1 | $16B |
|
||
| Industrial Distribution | 1 | $10B |
|
||
| Utilities | 1 | $9B |
|
||
Property tax history
+2.2%/yrLatest (2025): $1,060 · -0.3% YoY. Source: county tax records.
Cash-flow waterfall
monthlySold comps — $/sqft
last 12 mo · ≤1 miLoading sold comps…