5153 Tremont St · Port Arthur, TX
Flood risk 10/10 · Severe
- FEMA flood zone
- AE
- Chance of flooding over 30 yrs
- 0.99%
- Est. flood insurance / yr
- $1,737 – $8,500
Fire risk 5/10 · Moderate
- Est. fire insurance / yr
- $1,222 – $2,270
Heat risk 10/10 · Severe
- Hot days now (above 108°F)
- 7 days/yr
- Hot days in 30 yrs
- 27 days/yr
Wind risk 10/10 · Severe
- Chance of severe wind over 30 yrs
- 99.0%
Air-quality risk 2/10 · Minimal
- Unhealthy air days now
- 1 days/yr
- Unhealthy air days in 30 yrs
- 1 days/yr
Risk factors via First Street. Map © Google.
Why this score? — see what drove the B+ grade
The composite is a weighted blend of 9 inputs, each scored 0–100. Each bar is that input's sub-score; the figure is the points it added to the 100-point composite (weight × sub-score).
- Cash flow +30.0/30.0
- ARV discount +15.0/15.0
- 1% rule +10.0/10.0
- DSCR +10.0/10.0
- Schools +3.8/10.0
- Livability +3.1/5.0
- Rent growth +2.5/5.0
- Condition / age +2.2/5.0
- Appreciation +0.0/10.0
$80,000
🖨 Deal sheet 📄 Offer letter ✓ Due diligence
Listing remarks MLS
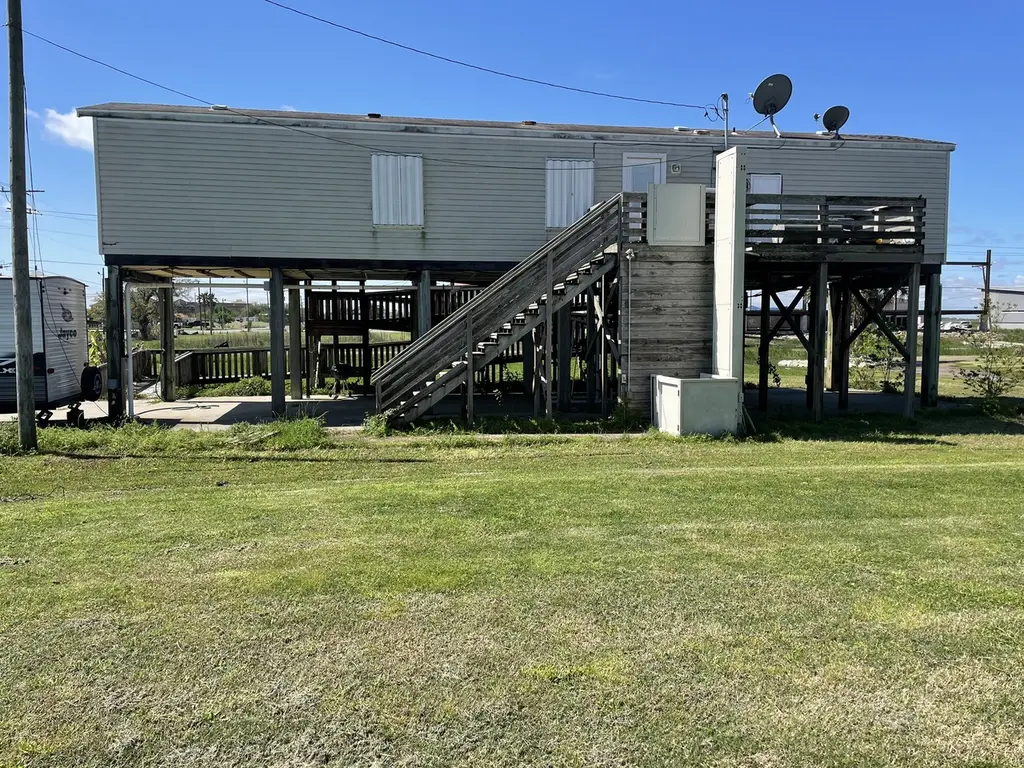
Charmin manufactured 2 bedroom 1 bath located in Sabine Pass near all the refinery expansions. This is a great opportunity to own an income producing property.
Key facts
- Built 2000
- Listed 817 days
Neighborhood map
What this means for you Summary
Snapshot
- This is a 2-bed/1.0-bath single-family listed at $80k. Condition is rated fair.
Deal economics
- At list price, monthly cash flow is $-27 ($-320/yr) — negative.
- To cash-flow at today's rent, offer at most $76k (4.8% below list).
- Meets the 1% rule at list price ($1k rent vs $80k).
- Recommended offer: $70k (12.0% below list) — sets the bar for market timing.
- Cap rate 12.3% vs local median 5.0% in Port Arthur — top-decile yield for the area; either an underpriced asset or a hidden risk that comps aren't pricing in. Stress-test before assuming the spread holds.
Location & tenants
- Location reads 61/100 on livability (#1,014 in TX) — a middle-class / working-renter tenant base. Strengths: cost of living A+, housing A+; Watch: schools D-, crime F, amenities F.
- Sabine Pass ISD (rural): math 37% / reading 51% proficiency, ranked #280 of 826 in TX (top 34%) — families likely to look elsewhere, expect single-tenant / working-renter base with shorter leases.
- Market conditions: 148 active listings in the ZIP; 343 units permitted in Jefferson County in 2024 (0 in 5+ unit buildings).
Forward outlook
- Local home prices are declining (-3.0%/yr); year-one equity from $553 of loan paydown is wiped out by about $2k of value loss. Plan a longer hold.
Negotiation context
- It's been on market 817 days — a 12% lower offer ($70k) is reasonable based on typical stale-listing flexibility.
- 2 sale attempts since 2y ago; this cycle's ask has dropped $35k (30%) from the opening price — seller is motivated, your offer sets the floor, not the list.
Risks & watch-outs
- Watch-outs: flood insurance adds $427/mo.
- Climate carrying-cost: in FEMA flood zone AE (mandatory federal flood insurance); severe wind risk, 99% chance of damaging wind over 30y; moderate wildfire risk; extreme-heat days projected 7→27/yr by 2055 (HVAC capex compounding) — expect insurance premiums to compound above CPI over the hold.
Questions for the listing agent
- What do current leases actually rent for vs. the listed asking? Can we see a recent rent roll and the last 12 months of T-12 income?
- It's been on market 817 days. Have you received any prior offers? Is the seller open to a 12% concession, seller financing, or rate buy-down credit?
- Have any recent inspections been done? Can we get a copy of the seller's disclosures and any deferred-maintenance estimates?
- What's the actual annual flood-insurance premium (NFIP or private), and is the property in a SFHA with mandatory coverage?
- Why hasn't it sold? Are there any deal-killer items the seller is aware of (foundation, flood, title, zoning, code violations)?
- Is there a deadline driving the sale (1031 exchange, divorce, estate, relocation)? That informs how much negotiation room exists.
- Schools are D-rated, which usually means shorter tenancies and higher turnover. Who's the typical renter profile here, and what's been the actual vacancy rate?
- Crime grade is F in this area — have there been break-ins, vandalism, or insurance claims at this property in the last 3 years? What carrier currently insures it and at what premium?
- What's the average days-on-market for RENTAL listings here right now (not sales)? A rising rental-DOM trend means longer vacancies and softer asking-rent achievability than the comps imply.
- What's the recent tenant-quality profile in this submarket — average credit score on applications, eviction rate, late-payment / NSF rate, and stable-employment percentage? A property-management company in the area should have these aggregated.
- How much new for-sale + rental construction is in the pipeline within 1–3 miles? Heavy new supply typically softens prices + rents 12–24 months out; constrained supply supports both.
Investment metrics
- 1% rule
- 1.51% ✓
- Cap rate
- 12.29%
- Cash-on-cash
- 21.42%
- DSCR
- 1.95
- GRM
- 5.5
CMA / ARV
- ARV (median comp)
- $108,788
- List price
- $80,000
- Delta
- -26.46%
- Verdict
- UNDERPRICED
- Comps
- 2 within 2.0 mi
Show comp detail 1 sale within ~0.75 mi
| Address | Dist | Beds/Ba | Sqft | Sold | Price | $/sf | Match |
|---|---|---|---|---|---|---|---|
| 5204 15th S | 0.59mi | 2/1.0 | 832 (-1%) | 23mo | $125,000 | $150 | 51 |
Match score weights: distance 35% · size 25% · config 20% · recency 20%. Top-matched comps best support the ARV.
Projected returns pro-forma
-3.0% appreciation · 3.0% rent growth · sell at horizon
- IRR
- -18.2%
- Equity multiple
- 0.36×
- Total profit
- $-14,382
- Equity at exit
- $11,928
- IRR
- -9.7%
- Equity multiple
- 0.39×
- Total profit
- $-13,573
- Equity at exit
- $6,917
Cash invested: $22,400 (down + closing). Projections, not guarantees.
Landlord ↔ Tenant lean methodology
- Overall (STATE)
- 87 Strongly Landlord-Friendly
- State Texas
- 87 Strongly Landlord-Friendly · R+5
- County
- — inherits STATE
- City
- — inherits STATE
ZIP-level market 77640
- Home prices YoY
- -22.2%
- Active inventory
- 148
- Price-to-rent
- 5.5×
Monthly cashflow live
- Estimated rent
- $1,206 medium interval (Pro) →
- Mortgage (P&I)
- −$420
- Tax est. 1.5%
- −$100 /mo · $1,200/yr
- Insurance
- −$33
- Flood insurance flood zone
- −$427 /mo · $5,118/yr
- HOA
- −$0
- Vacancy / Maint / Mgmt
- −$253
- Net cashflow
- $-27
Break-even live
UW: 25.0% down · 7.5% · 30yr · 1.5% tax · 5.0% vac · 8.0% maint · 8.0% mgmt
Financing live
Cash to close
- Down payment
- $20,000
- Closing costs
- $2,400
- Reserves months
- —
- Total cash needed
- —
Loan-product check · same deal, 3 products live
Conventional
25% down · 7.5% · 30yr
- Down + closing
- —
- Monthly P&I
- —
- Monthly cashflow
- —
- DSCR
- —
- Eligible?
- —
Personal DTI + credit; lowest rate.
DSCR
20% down · 8.5% · 30yr
- Down + closing
- —
- Monthly P&I
- —
- Monthly cashflow
- —
- DSCR
- —
- Eligible?
- —
No personal income docs; deal must DSCR.
Hard money
10% down · 12.0% · 12mo
- Down + closing
- —
- Monthly P&I
- —
- Monthly cashflow
- —
- DSCR
- —
- Eligible?
- —
Short-term bridge; refi at stabilization.
Listing history 21 events
-
2026-06-18days on market $80,000 Active 817 DOM
-
2026-06-17days on market $80,000 Active 816 DOM
-
2026-06-16days on market $80,000 Active 815 DOM
-
2026-06-15days on market $80,000 Active 814 DOM
-
2026-06-14days on market $80,000 Active 812 DOM
-
2026-06-13days on market $80,000 Active 811 DOM
-
2026-06-10days on market $80,000 Active 809 DOM
-
2026-06-09days on market $80,000 Active 808 DOM
-
2026-06-08days on market $80,000 Active 807 DOM
-
2026-06-07days on market $80,000 Active 806 DOM
-
2026-06-03days on market $80,000 Active 802 DOM
-
2026-06-02days on market $80,000 Active 801 DOM
-
2026-06-01days on market $80,000 Active 800 DOM
-
2026-05-31days on market $80,000 Active 799 DOM
-
2026-05-30days on market $80,000 Active 798 DOM
-
2025-11-14status Active 159-char remark
Show marketing remark (159 chars)
Charmin manufactured 2 bedroom 1 bath located in Sabine Pass near all the refinery expansions. This is a great opportunity to own an income producing property.
-
2025-11-12historical 159-char remark
Show marketing remark (159 chars)
Charmin manufactured 2 bedroom 1 bath located in Sabine Pass near all the refinery expansions. This is a great opportunity to own an income producing property.
-
2025-09-23price $80,000 159-char remark
Show marketing remark (159 chars)
Charmin manufactured 2 bedroom 1 bath located in Sabine Pass near all the refinery expansions. This is a great opportunity to own an income producing property.
-
2024-10-14price $90,000 159-char remark
Show marketing remark (159 chars)
Charmin manufactured 2 bedroom 1 bath located in Sabine Pass near all the refinery expansions. This is a great opportunity to own an income producing property.
-
2024-10-02price $100,000 159-char remark
Show marketing remark (159 chars)
Charmin manufactured 2 bedroom 1 bath located in Sabine Pass near all the refinery expansions. This is a great opportunity to own an income producing property.
-
2024-03-22$115,000 Active 159-char remark
Show marketing remark (159 chars)
Charmin manufactured 2 bedroom 1 bath located in Sabine Pass near all the refinery expansions. This is a great opportunity to own an income producing property.
ⓘ Source: listings_history table (triggers on properties + properties_extension) + one-shot
backfill from property_details.listing_events for pre-trigger history.
Climate risk First Street
- Flood 10/10 Extreme FEMA zone AE · 99% chance over 30 yrs
- Wildfire 5/10 Major
- Heat 10/10 Extreme 7 d/yr ≥108°F today · 27 d/yr by 30 yrs out
- Wind 10/10 Extreme 99% chance of damaging wind over 30 yrs
- Air quality 2/10 Low 1 unhealthy d/yr today · 1 by 30 yrs out
Nearby sold comps map
Loading sold comps map…
Walkable amenities ~0.75 mi
Loading nearby amenities…
Taxation est. · year 1
- Rental income
- $14,472
- − Mortgage interest
- −$4,481
- − Property taxes
- −$1,200
- − Insurance
- −$5,518
- − Repairs & maintenance
- −$1,158
- − Management
- −$1,158
- − Depreciation
- −$2,327
- Taxable loss
- −$1,371
- Est. tax savings @ 24.0%
- +$329
- After-tax cash flow
- $9/yr
For passive investors: Depreciation is non-cash, so a rental often shows a tax loss while cash-flowing — sheltering income. Rental losses are passive: they offset passive income freely, and up to $25,000/yr can offset ordinary (W-2) income if you actively participate and your MAGI is under $100k (phasing out to $0 by $150k); unused losses carry forward. On sale, claimed depreciation is recaptured at up to 25%, and gains may owe capital-gains tax (a 1031 exchange can defer both). Figures are a year-1 estimate at your 24.0% rate — not tax advice; consult a CPA.
Condition & rehab AI · 7 photos
This single-family home requires moderate repairs to its exterior and foundation, but has good interior walls and flooring. Repairs would significantly increase its resale and rental value.
Repairs flagged
- Major exterior siding — Significant wear and tear
- Major foundation — Structural damage visible
Value-add opportunities
- Both repair exterior siding — Improves curb appeal and structural integrity
- Both repair foundation — Stabilizes the structure and enhances value
- Both paint exterior — Enhances curb appeal and property value
Renovation cost estimate screening
| Repair item | Severity | Est. cost |
|---|---|---|
| exterior siding · Significant wear and tear | Major | $15,000–50,000 |
| foundation · Structural damage visible | Major | $15,000–50,000 |
| Total estimated repair cost · 2 items | $30,000–100,000 |
Value-add ROI direction
- Both repair exterior siding — Improves curb appeal and structural integrity ↑
- Both repair foundation — Stabilizes the structure and enhances value ↑
- Both paint exterior — Enhances curb appeal and property value ↑
ⓘ Cost ranges are severity-bucket heuristics (US national rule-of-thumb). Get contractor quotes + a written scope before underwriting a rehab budget.
Schools (NCES district)
- District
- Sabine Pass ISD
- NCES district ID
- 4838490
- Math proficiency
- 37% ▼ -8.00%
- Reading proficiency
- 51% ▼ -12.00%
- Median HH income
- $50,222
- Composite
- 37.78/100
- National rank
- #4344
- State rank
- #280 of 826 in TX
Livability — Port Arthur
- Score
- 61/100
- State rank
- #1014
- US rank
- #18061
Category grades
Schools grade is shown separately in the Schools card above.
Census & demographics
- Census place
- Port Arthur, TX
- City population
- 38,358
- Population (ZIP)
- 17,480
Population outlook (Jefferson County) Hauer SSP2
- Today (2025)
- 259,015 people
- By 2030
- 260,685 · +0.6%
- By 2040
- 263,309 · +1.7%
- By 2050
- 265,237 · +2.4%
- By 2075
- 270,193 · +4.3%
- By 2100
- 255,628 · -1.3%
Race, ethnicity, and origin ACS 2023
- Neighborhood character
- Diverse neighborhood (Simpson 0.62)
- Race & ethnicity
- Black 54% White 22% Hispanic / Latino 21% Two or more races 8% Asian 2%
- Hispanic origin (detail)
- Mexican 16% Dominican 1%
- Common ancestry
- Lithuanian 3%
- Foreign-born
- 11% · Canada
- Languages at home
- 79% English-only · Spanish 17% Other Indo-European 2% German/W. Germanic 1%
Political lean MEDSL · Jefferson
- 2024 margin
- Lean R (+8.9) · D 45.1% · R 54.0%
- 2008→2024 swing
- -11.1pp toward R · 2008: 2.2pp · 2024: -8.9pp
- All cycles
- 2024: R+8.9 2020: R+1.6 2016: R+0.5 2012: D+1.6 2008: D+2.2
Not yet ingested
- Civics
- —
Market trends
- HPI YoY
- ▼ -47.78%
- Current HPI
- 167.6359
- Rent YoY
- —
- Metro
- —
- State GDP YoY
- ▲ 3.95%
- F500 in state
- 110
Industry mix (Fortune 500 HQ in TX)
| Industry | F500 HQs | Revenue |
|---|---|---|
| Energy | 16 | $1,198B |
|
||
| Technology | 5 | $198B |
|
||
| Engineering / Construction | 4 | $72B |
|
||
| Energy Services | 3 | $60B |
|
||
| Utilities | 3 | $41B |
|
||
| Healthcare | 2 | $330B |
|
||
Price history
-30.4% since first listed6 events — show timeline
- 2025-11-14 Relisted — HARMLS
- 2025-11-12 Listing Removed — HARMLS
- 2025-09-23 Price Changed $80,000 HARMLS
- 2024-10-14 Price Changed $90,000 HARMLS
- 2024-10-02 Price Changed $100,000 HARMLS
- 2024-03-22 Listed $115,000 HARMLS
Cash-flow waterfall
monthlySold comps — $/sqft
last 12 mo · ≤1 miLoading sold comps…