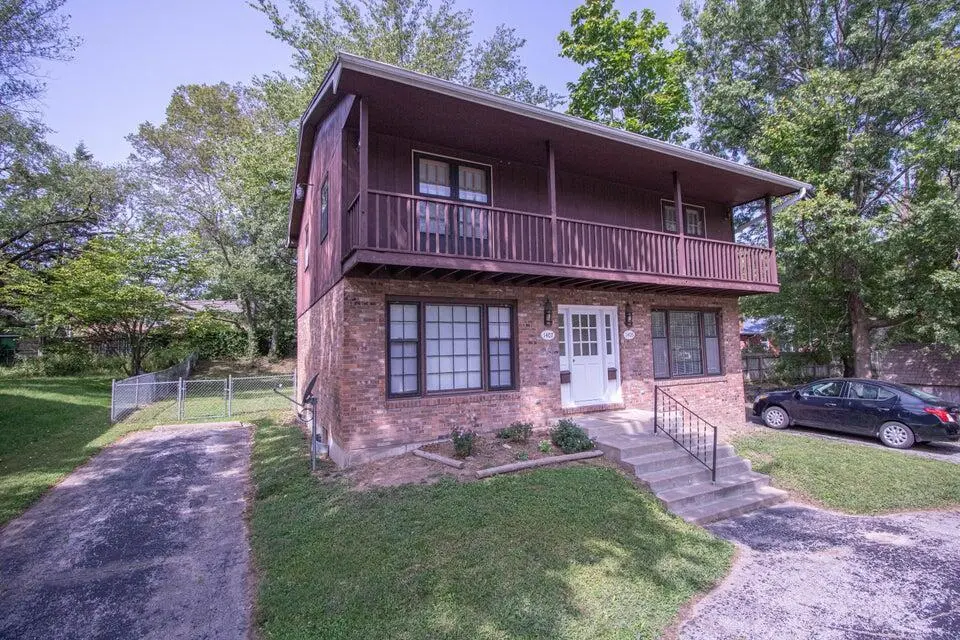
 Duplex
1405-1407 Joann St · Columbia, MO
Flood risk 1/10 · Minimal
- FEMA flood zone
- X (unshaded)
- Chance of flooding over 30 yrs
- 0.0%
- Est. flood insurance / yr
- $473 – $860
Fire risk 3/10 · Minor
- Est. fire insurance / yr
- $1,054 – $1,958
Heat risk 4/10 · Minor
- Hot days now (above 107°F)
- 7 days/yr
- Hot days in 30 yrs
- 19 days/yr
Wind risk 2/10 · Minimal
- Chance of severe wind over 30 yrs
- —
Air-quality risk 2/10 · Minimal
- Unhealthy air days now
- 1 days/yr
- Unhealthy air days in 30 yrs
- 1 days/yr
Risk factors via First Street. Map © Google.
Why this score? — see what drove the C- grade
The composite is a weighted blend of 9 inputs, each scored 0–100. Each bar is that input's sub-score; the figure is the points it added to the 100-point composite (weight × sub-score).
- Cash flow +21.6/30.0
- ARV discount +7.5/15.0
- DSCR +6.9/10.0
- 1% rule +4.7/10.0
- Livability +4.2/5.0
- Rent growth +4.0/5.0
- Schools +3.1/10.0
- Condition / age +2.5/5.0
- Appreciation +0.0/10.0
$290,000
🖨 Deal sheet 📄 Offer letter ✓ Due diligence
Multi-family units
County records classify this as Multi-Family (2-4 Unit). Listing-text estimate: 2 units. confirmed
Listing remarks MLS
1405 $450MO 7/31/00 1407 $450MO 7/31/00 1407 PREVIOUSLY OWNER OCCUPIED NICE 7/2/2X2 7/2/2X2
Key facts
- Decks
- Fenced back yards
- Investment duplex
Tags
Property features AI
Finance
- Financial info: Annual tax amount listed
Exterior
- Home design: Duplex (residential income property)
- Exterior features: Lot dimensions approximately 67.5 x 140; Zoned R-2 (Two-family dwelling)
Interior
- Heating & cooling: Central Air; Forced air heating; Electric heating
- Interior features: Basement
Neighborhood map
What this means for you Summary
Snapshot
- This is a 2 × 2-bed/2.0-bath units multifamily listed at $290k.
Deal economics
- At list price, monthly cash flow is $439 ($5k/yr) — positive. Per door: $220/mo.
- The deal already cash-flows at list — no discount required.
- To meet the 1% rule (rent ≥ 1% of price), the offer needs to be $281k (3.2% below list).
- Recommended offer: $281k (3.2% below list) — sets the bar for 1% rule.
- Cap rate 8.1% vs local median 2.9% in Columbia — top-decile yield for the area; either an underpriced asset or a hidden risk that comps aren't pricing in. Stress-test before assuming the spread holds.
Location & tenants
- Location reads 83/100 on livability (#9 in MO, #862 nationally) — a professional / high-income tenant draw. Strengths: amenities A+, commute A+, cost of living A+; Watch: crime D+.
- Columbia 93 (urban): math 30% / reading 43% proficiency, ranked #194 of 324 in MO (top 60%) — families likely to look elsewhere, expect single-tenant / working-renter base with shorter leases.
- Zoned schools: Ann Hawkins Gentry Middle (math 40% / reading 47%, grade D, #127 of 391 statewide, top 34%, 719 students, 31% FRL); Rock Bridge Sr. High (math 39% / reading 68%, grade C-, #83 of 521 statewide, top 16%, 2,032 students, 18% FRL).
- Zoned-school proficiency averages 48% at this address vs 36% district-wide (+12 pts) — the actual schools serving this property are materially stronger than the Columbia 93 average implies; a family-tenant draw the district grade alone would hide.
- Market conditions: Rents rising fast (+6.1%/yr); 459 active listings in the ZIP; 6 comparable units currently listed for rent nearby; rentals lingering (median 44d on market — plan ~5-8 weeks vacancy on turnover, expect pricing pressure); 50% of comp listings sitting > 30 days — soft ceiling on asking rent; solid renter incomes; 1,303 units permitted in Boone County in 2024 (549 in 5+ unit buildings).
- This rent runs 42% of the median local income ($80k/yr) — at the standard rent-burdened threshold; future hikes will face affordability resistance.
Forward outlook
- Local home prices are declining (-3.0%/yr); year-one equity from $2k of loan paydown is wiped out by about $9k of value loss. Plan a longer hold.
- Boone County population projected at +36% by 2050 — long-run rental-demand tailwind backs the buy-and-hold thesis.
- At projected returns (-3.0% appreciation + 6.1% rent growth), your $81k cash investment doubles in ~10 years — after that, you're playing with house money.
Negotiation context
- Only 12 days on market — expect competitive offers; lowballing is unlikely to land.
- 3 sale attempts since 27y ago with the ask held roughly flat each time — persistent listings suggest the price (not the market) is what's stuck; bring a comps-based counter.
Questions for the listing agent
- Can we see the unit-by-unit rent roll, current vacancy, and any below-market leases? What's the average tenancy length?
- What capital expenditures (roof, boiler, parking lot, exteriors) have been made in the last 5 years, and what's planned in the next 2?
- Built in 1977 — when were the roof, HVAC, electrical panel, plumbing, and water heater last replaced?
- Is there a deadline driving the sale (1031 exchange, divorce, estate, relocation)? That informs how much negotiation room exists.
- Schools are B-rated — typically a magnet for longer-tenancy family renters. What's the average tenant stay here, and is there a school-zone premium baked into asking?
- Crime grade is D in this area — have there been break-ins, vandalism, or insurance claims at this property in the last 3 years? What carrier currently insures it and at what premium?
- What's the average days-on-market for RENTAL listings here right now (not sales)? A rising rental-DOM trend means longer vacancies and softer asking-rent achievability than the comps imply.
- What's the recent tenant-quality profile in this submarket — average credit score on applications, eviction rate, late-payment / NSF rate, and stable-employment percentage? A property-management company in the area should have these aggregated.
- How much new apartment / multifamily construction is in the pipeline within 1–3 miles? Heavy new supply (>2% of stock underway) typically softens rents 12–24 months out; light construction supports rent growth.
Investment metrics
- 1% rule
- 0.97% ✗
- Cap rate
- 8.11%
- Cash-on-cash
- 6.49%
- DSCR
- 1.29
- GRM
- 8.6
CMA / ARV
No comps found within radius.
Projected returns pro-forma
-3.0% appreciation · 6.09% rent growth · sell at horizon
- IRR
- -3.2%
- Equity multiple
- 0.88×
- Total profit
- $-10,116
- Equity at exit
- $43,240
- IRR
- 9.4%
- Equity multiple
- 1.81×
- Total profit
- $66,163
- Equity at exit
- $25,074
Cash invested: $81,200 (down + closing). Projections, not guarantees.
Landlord ↔ Tenant lean methodology
- Overall (STATE)
- 81 Strongly Landlord-Friendly
- State Missouri
- 81 Strongly Landlord-Friendly · R+10
- County
- — inherits STATE
- City
- — inherits STATE
ZIP-level market 65203
- Rents YoY
- 6.1%
- Active inventory
- 459
- Price-to-rent
- 17.2×
Monthly cashflow live
- Estimated rent
- $2,807 high interval (Pro) →
- Mortgage (P&I)
- −$1,521
- Tax from tax record
- −$137 /mo · $1,640/yr
- Insurance
- −$121
- HOA
- −$0
- Vacancy / Maint / Mgmt
- −$589
- Net cashflow
- $439
Break-even live
2-unit breakdown (identical units grouped — click to expand)
| Units | Beds | Baths | Est. rent |
|---|---|---|---|
| 2× units | 2 | 2 | $2,808 |
| #1 | 2 | 2 | $1,404 |
| #2 | 2 | 2 | $1,404 |
| Total (2 units) | $2,807 | ||
UW: 25.0% down · 7.5% · 30yr · 1.5% tax · 5.0% vac · 8.0% maint · 8.0% mgmt
Financing live
Cash to close
- Down payment
- $72,500
- Closing costs
- $8,700
- Reserves months
- —
- Total cash needed
- —
Loan-product check · same deal, 3 products live
Conventional
25% down · 7.5% · 30yr
- Down + closing
- —
- Monthly P&I
- —
- Monthly cashflow
- —
- DSCR
- —
- Eligible?
- —
Personal DTI + credit; lowest rate.
DSCR
20% down · 8.5% · 30yr
- Down + closing
- —
- Monthly P&I
- —
- Monthly cashflow
- —
- DSCR
- —
- Eligible?
- —
No personal income docs; deal must DSCR.
Hard money
10% down · 12.0% · 12mo
- Down + closing
- —
- Monthly P&I
- —
- Monthly cashflow
- —
- DSCR
- —
- Eligible?
- —
Short-term bridge; refi at stabilization.
Rent comps 6 comps
| Address | Beds | Baths | Sqft | Rent | $/sqft | DOM | Units | Dist |
|---|---|---|---|---|---|---|---|---|
| 1810 Highridge Dr Columbia, MO | 4.0 | 3.0 | 1636 | $2,200 | $1.34 | 21d | 1 | 0.13mi |
| 1207 White Oak Ln Columbia, MO | 5.0 | 2.0 | 1920 | $1,895 | $0.99 | 21d | 1 | 0.47mi |
| 3104 Oak Lawn Dr Columbia, MO | 4.0 | 3.5 | 2476 | $3,500 | $1.41 | 44d | 1 | 1.36mi |
| 3006 Lynnwood Dr Columbia, MO | 5.0 | 3.0 | 2250 | $2,400 | $1.07 | 21d | 1 | 1.41mi |
| 1011 W Ash St Columbia, MO | 4.0 | 2.0 | 1456 | $1,550 | $1.06 | 44d | 1 | 1.49mi |
| 1007 W Ash St Columbia, MO | 4.0 | 2.0 | 1456 | $1,550 | $1.06 | 44d | 1 | 1.49mi |
Listing history 11 events
-
2026-06-17statusdays on market $290,000 Pending 12 DOM
-
2026-06-16days on market $290,000 Active 11 DOM
-
2026-06-15days on market $290,000 Active 10 DOM
-
2026-06-14days on market $290,000 Active 8 DOM
-
2026-06-13days on market $290,000 Active 7 DOM
-
2026-06-10days on market $290,000 Active 5 DOM
-
2026-06-09days on market $290,000 Active 4 DOM
-
2026-06-09remarks 699-char remark
-
2026-06-08days on market $290,000 Active 3 DOM
-
2026-06-07remarks 626-char remark
-
2026-06-07$290,000 Active 2 DOM
ⓘ Source: listings_history table (triggers on properties + properties_extension) + one-shot
backfill from property_details.listing_events for pre-trigger history.
Tax reassessment forecast MO · Resets to sale price
- Current annual tax
- $1,640 · $137/mo
- Projected year-2 tax
- $2,813 · $234/mo
- Expected delta
- +$1,173/yr (+$98/mo · 71.5%)
ⓘ Screening estimate from a state-policy table — verify with the county assessor before closing.
Climate risk First Street
- Flood 1/10 Low FEMA zone X (unshaded) · 0% chance over 30 yrs
- Wildfire 3/10 Moderate
- Heat 4/10 Moderate 7 d/yr ≥107°F today · 19 d/yr by 30 yrs out
- Wind 2/10 Low
- Air quality 2/10 Low 1 unhealthy d/yr today · 1 by 30 yrs out
Nearby sold comps map
Loading sold comps map…
Walkable amenities ~0.75 mi
Loading nearby amenities…
Taxation est. · year 1
- Rental income
- $33,684
- − Mortgage interest
- −$16,245
- − Property taxes
- −$1,640
- − Insurance
- −$1,450
- − Repairs & maintenance
- −$2,695
- − Management
- −$2,695
- − Depreciation
- −$8,436
- Taxable income
- $524
- Est. tax owed @ 24.0%
- −$126
- After-tax cash flow
- $5,145/yr
For passive investors: Depreciation is non-cash, so a rental often shows a tax loss while cash-flowing — sheltering income. Rental losses are passive: they offset passive income freely, and up to $25,000/yr can offset ordinary (W-2) income if you actively participate and your MAGI is under $100k (phasing out to $0 by $150k); unused losses carry forward. On sale, claimed depreciation is recaptured at up to 25%, and gains may owe capital-gains tax (a 1031 exchange can defer both). Figures are a year-1 estimate at your 24.0% rate — not tax advice; consult a CPA.
Schools (NCES district)
- District
- Columbia 93
- NCES district ID
- 2901000
- Math proficiency
- 30% ▼ -12.00%
- Reading proficiency
- 43% ▼ -4.00%
- Median HH income
- $46,547
- Composite
- 31.21/100
- National rank
- #6036
- State rank
- #194 of 324 in MO
Livability — Columbia
- Score
- 83/100
- State rank
- #9
- US rank
- #862
Category grades
Schools grade is shown separately in the Schools card above.
Census & demographics
- Census place
- Columbia, MO
- County
- Boone County · 158,877 people
- City population
- 158,877
- Metro
- Columbia, MO
- Population (ZIP)
- 61,539
- Household income
- $79,960
- Rent vs Own
- Severe rent burden
- 1991.0
Population outlook (Boone County) Hauer SSP2
- Today (2025)
- 202,891 people
- By 2030
- 217,799 · +7.3%
- By 2040
- 246,789 · +21.6%
- By 2050
- 276,116 · +36.1%
- By 2075
- 348,426 · +71.7%
- By 2100
- 400,856 · +97.6%
Race, ethnicity, and origin ACS 2023
- Neighborhood character
- Predominantly White (77%)
- Race & ethnicity
- White 77% Black 9% Asian 6% Two or more races 5% Hispanic / Latino 3%
- Common ancestry
- Italian 3% Slovak 2% Romanian 2%
- Foreign-born
- 7% · China, South Korea, Canada
- Languages at home
- 91% English-only · Chinese 2% Spanish 2% Korean 1%
Political lean MEDSL · Boone
- 2024 margin
- Lean D (+9.8) · D 53.9% · R 44.1% · Other 2.1%
- 2008→2024 swing
- -2.2pp toward R · 2008: 12.0pp · 2024: 9.8pp
- All cycles
- 2024: D+9.8 2020: D+12.5 2016: D+5.9 2012: D+3.1 2008: D+12.0
Not yet ingested
- Civics
- —
Market trends
- HPI YoY
- ▼ -274.18%
- Current HPI
- 194.3615
- Rent YoY
- ▲ 6.09%
- Metro
- Columbia, MO
- State GDP YoY
- ▲ 1.84%
- F500 in state
- 20
Industry mix (Fortune 500 HQ in MO)
| Industry | F500 HQs | Revenue |
|---|---|---|
| Healthcare | 1 | $163B |
|
||
| Insurance | 1 | $21B |
|
||
| Industrial Technology | 1 | $17B |
|
||
| Retail | 1 | $16B |
|
||
| Industrial Distribution | 1 | $10B |
|
||
| Utilities | 1 | $9B |
|
||
Price history
+202.1% since first listed5 events — show timeline
- 2026-06-05 Listed $290,000 CBORMLS
- 2025-01-30 Rental Removed $950 CBORMLS
- 2025-01-29 Listed for Rent $950 CBORMLS
- 1999-10-15 Sold (MLS) — CBORMLS
- 1999-09-08 Listed $96,000 CBORMLS
Property tax history
+2.7%/yrLatest (2025): $1,640 · +6.8% YoY. Source: county tax records.
Cash-flow waterfall
monthlySold comps — $/sqft
last 12 mo · ≤1 miLoading sold comps…