2406 Gordon St · Brunswick, GA
Flood risk 7/10 · Major
- FEMA flood zone
- X (shaded)
- Chance of flooding over 30 yrs
- 0.76%
- Est. flood insurance / yr
- $507 – $1,088
Fire risk 5/10 · Moderate
- Est. fire insurance / yr
- $963 – $1,789
Heat risk 10/10 · Severe
- Hot days now (above 108°F)
- 7 days/yr
- Hot days in 30 yrs
- 20 days/yr
Wind risk 9/10 · Severe
- Chance of severe wind over 30 yrs
- 99.0%
Air-quality risk 4/10 · Minor
- Unhealthy air days now
- 5 days/yr
- Unhealthy air days in 30 yrs
- 5 days/yr
Risk factors via First Street. Map © Google.
Why this score? — see what drove the D+ grade
The composite is a weighted blend of 9 inputs, each scored 0–100. Each bar is that input's sub-score; the figure is the points it added to the 100-point composite (weight × sub-score).
- Cash flow +15.0/30.0
- ARV discount +7.5/15.0
- 1% rule +5.0/10.0
- DSCR +5.0/10.0
- Rent growth +3.8/5.0
- Schools +3.4/10.0
- Livability +3.0/5.0
- Condition / age +2.5/5.0
- Appreciation +0.0/10.0
$22,000
🖨 Deal sheet (PDF) 📄 Offer letter ✓ Due diligence
Listing remarks MLS
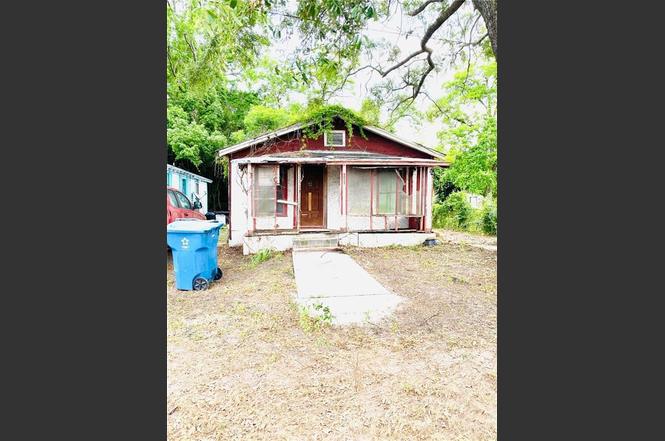
This property is perfect for a investor willing to remodel property. House has is own character with a screen porch area and large patio in the back with a small storage shed. Driveaway. Owner started project and removed many trees, stump grinded etc. Property is ready to be remodeled. Property had power and water on at one time so don’t have to pay for new water and sewer tap fee (HUGE SAVINGS) maybe a meter fee. Property being Sold AS IS and can only be purchased with CASH. Seller is licensed Realtor in state of GA
Key facts
- Large patio
- Screen porch area
- Small storage shed
Tags
Property features AI
Exterior
- Utilities: Electric, gas, sewer, and water connections nearby (feet)
- Home design: Single-story home; Metal roof
- Construction: Lot approximately 0.08 acres (about 3,484.8 sq ft)
- Exterior features: Asphalt road access
Interior
- Bedrooms: Three main-level bedrooms
- Bathrooms: One full bathroom
- Interior features: Six total rooms
Neighborhood map
What this means for you Summary
Snapshot
- This is a 3-bed/1.0-bath single-family listed at $22k.
Deal economics
- At list price, monthly cash flow is $1k ($14k/yr) — positive.
- The deal already cash-flows at list — no discount required.
- Meets the 1% rule at list price ($2k rent vs $22k).
- Cap rate 71.9% vs local median 3.5% in Brunswick — top-decile yield for the area; either an underpriced asset or a hidden risk that comps aren't pricing in. Stress-test before assuming the spread holds.
Location & tenants
- Location reads 59/100 on livability (#401 in GA) — a working-class tenant base; expect higher turnover. Strengths: cost of living A+, housing B+; Watch: crime D, amenities F, commute F.
- Glynn County (other): math 37% / reading 42% proficiency, ranked #47 of 174 in GA (top 27%) — families likely to look elsewhere, expect single-tenant / working-renter base with shorter leases.
- Zoned schools: Burroughs-Molette Elementary School (math 21% / reading 14%, grade F, #931 of 1,228 statewide, top 76%, 593 students, 96% FRL); Risley Middle School (math 29% / reading 44%, grade F, #167 of 470 statewide, top 38%, 635 students, 61% FRL); Brunswick High School (math 32% / reading 37%, grade F, #88 of 424 statewide, top 22%, 1,932 students, 61% FRL) — zoned schools average 73% FRL vs 55% district-wide (18 pts higher); higher-poverty schools than district average — tighter screening recommended.
- Market conditions: Rents rising fast (+5.1%/yr); 183 active listings in the ZIP; 10 comparable units currently listed for rent nearby; rentals lingering (median 46d on market — plan ~5-8 weeks vacancy on turnover, expect pricing pressure); 80% of comp listings sitting > 30 days — soft ceiling on asking rent; lower-income renter base — watch delinquency; 734 units permitted in Glynn County in 2024 (136 in 5+ unit buildings).
- At $1,691/mo this rent would consume 51% of the median local household income ($40k/yr) (locally 1406% of renters already pay >50% of income on rent) — very limited rent-growth headroom before tenants either downsize or default.
Forward outlook
- Local home prices are declining (-3.0%/yr); year-one equity from $152 of loan paydown is wiped out by about $660 of value loss. Plan a longer hold.
- Glynn County population projected at +13% by 2050 — modest demand growth; plan on rents tracking national, not racing it.
- At projected returns (-3.0% appreciation + 5.1% rent growth), your $6k cash investment doubles in ~1 year — after that, you're playing with house money.
Negotiation context
- Only 10 days on market — expect competitive offers; lowballing is unlikely to land.
- 3 sale attempts since 18y ago with the ask held roughly flat each time — persistent listings suggest the price (not the market) is what's stuck; bring a comps-based counter.
- Current owner paid $12k; list at $22k implies a 76% gain — meaningful room to come down on a strong offer.
Risks & watch-outs
- Watch-outs: flood insurance adds $66/mo; built in 1953 — expect roof / HVAC / electrical / plumbing capex.
- Climate carrying-cost: major flood risk; severe wind risk, 99% chance of damaging wind over 30y; moderate wildfire risk; extreme-heat days projected 7→20/yr by 2055 (HVAC capex compounding) — expect insurance premiums to compound above CPI over the hold.
Questions for the listing agent
- Built in 1953 — when were the roof, HVAC, electrical panel, plumbing, and water heater last replaced?
- What's the actual annual flood-insurance premium (NFIP or private), and is the property in a SFHA with mandatory coverage?
- Is there a deadline driving the sale (1031 exchange, divorce, estate, relocation)? That informs how much negotiation room exists.
- Schools are D-rated, which usually means shorter tenancies and higher turnover. Who's the typical renter profile here, and what's been the actual vacancy rate?
- Crime grade is D in this area — have there been break-ins, vandalism, or insurance claims at this property in the last 3 years? What carrier currently insures it and at what premium?
- The area grade is low — what's the realistic commute time and amenity access for the typical tenant pool here? Any planned neighborhood developments (good or bad) we should know about?
- What's the average days-on-market for RENTAL listings here right now (not sales)? A rising rental-DOM trend means longer vacancies and softer asking-rent achievability than the comps imply.
- What's the recent tenant-quality profile in this submarket — average credit score on applications, eviction rate, late-payment / NSF rate, and stable-employment percentage? A property-management company in the area should have these aggregated.
- How much new for-sale + rental construction is in the pipeline within 1–3 miles? Heavy new supply typically softens prices + rents 12–24 months out; constrained supply supports both.
Investment metrics
- 1% rule
- 7.69% ✓
- Cap rate
- 71.91%
- Cash-on-cash
- 234.35%
- DSCR
- 11.43
- GRM
- 1.1
CMA / ARV
- ARV (on-the-fly)
- $97,824
- Comps found
- 12
Show comp detail 12 sales within ~0.75 mi
| Address | Dist | Beds/Ba | Sqft | Sold | Price | $/sf | Match |
|---|---|---|---|---|---|---|---|
| 2407 Bartow St | 0.08mi | 3/1.0 | 1,000 (-2%) | 9mo | $130,000 | $130 | 85 |
| 1926 Wilson Ave | 0.59mi | 3/1.0 | 960 (-6%) | 3mo | $120,000 | $125 | 60 |
| 2210 J | 0.48mi | 2/1.0 (-1) | 972 (-5%) | 6mo | $33,000 | $34 | 60 |
| 1203 M St | 0.33mi | 3/2.0 | 1,144 (+12%) | 1mo | $55,000 | $48 | 60 |
| 1701 Niles Ave | 0.72mi | 3/1.0 | 1,000 (-2%) | 6mo | $139,000 | $139 | 58 |
| 2229 Reynolds St | 0.59mi | 2/1.0 (-1) | 1,053 (+3%) | 5mo | $135,000 | $128 | 58 |
| 2308 Albany St | 0.28mi | 2/1.0 (-1) | 1,140 (+12%) | 7mo | $95,000 | $83 | 57 |
| 1709 Amherst St | 0.71mi | 3/1.0 | 960 (-6%) | 4mo | $80,000 | $83 | 54 |
| 2611 Albany St | 0.36mi | 3/2.0 | 1,142 (+12%) | 7mo | $110,000 | $96 | 53 |
| 2219 Reynolds St | 0.60mi | 4/1.0 (+1) | 1,104 (+8%) | 8mo | $72,500 | $66 | 47 |
| 2119 Reynolds St | 0.63mi | 2/1.0 (-1) | 918 (-10%) | 12mo | $105,000 | $114 | 39 |
| 2817 Ellis St | 0.64mi | 2/1.0 (-1) | 891 (-13%) | 11mo | $60,000 | $67 | 35 |
Match score weights: distance 35% · size 25% · config 20% · recency 20%. Top-matched comps best support the ARV.
Projected returns pro-forma
-3.0% appreciation · 5.08% rent growth · sell at horizon
- IRR
- —
- Equity multiple
- 12.77×
- Total profit
- $72,487
- Equity at exit
- $3,280
- IRR
- —
- Equity multiple
- 28.92×
- Total profit
- $172,018
- Equity at exit
- $1,902
Cash invested: $6,160 (down + closing). Projections, not guarantees.
Landlord ↔ Tenant lean methodology
- Overall (STATE)
- 90 Strongly Landlord-Friendly
- State Georgia
- 90 Strongly Landlord-Friendly · R+3
- County
- — inherits STATE
- City
- — inherits STATE
ZIP-level market 31520
- Rents YoY
- 5.1%
- Active inventory
- 183
- Price-to-rent
- 1.1×
Monthly cashflow live
- Estimated rent
- $1,691 high interval (Pro) →
- Mortgage (P&I)
- −$115
- Tax from tax record
- −$8 /mo · $101/yr
- Insurance
- −$9
- Flood insurance flood zone
- −$66 /mo · $798/yr
- HOA
- −$0
- Vacancy / Maint / Mgmt
- −$355
- Net cashflow
- $1,137
Break-even live
Sensitivity live
| Price | -10% $1,149 | -5% $1,143 | +0% $1,137 | +5% $1,130 | +10% $1,124 |
|---|---|---|---|---|---|
| Rent | -10% $1,003 | -5% $1,070 | +0% $1,137 | +5% $1,203 | +10% $1,270 |
| Rate | -1.0pp $1,148 | -0.5pp $1,142 | base $1,137 | +0.5pp $1,131 | +1.0pp $1,125 |
UW: 25.0% down · 7.5% · 30yr · 1.5% tax · 5.0% vac · 8.0% maint · 8.0% mgmt
Financing live
Cash to close
- Down payment
- $5,500
- Closing costs
- $660
- Reserves months
- —
- Total cash needed
- —
Loan-product check · same deal, 3 products live
Conventional
25% down · 7.5% · 30yr
- Down + closing
- —
- Monthly P&I
- —
- Monthly cashflow
- —
- DSCR
- —
- Eligible?
- —
Personal DTI + credit; lowest rate.
DSCR
20% down · 8.5% · 30yr
- Down + closing
- —
- Monthly P&I
- —
- Monthly cashflow
- —
- DSCR
- —
- Eligible?
- —
No personal income docs; deal must DSCR.
Hard money
10% down · 12.0% · 12mo
- Down + closing
- —
- Monthly P&I
- —
- Monthly cashflow
- —
- DSCR
- —
- Eligible?
- —
Short-term bridge; refi at stabilization.
Rent comps 10 comps
| Address | Beds | Baths | Sqft | Rent | $/sqft | DOM | Units | Dist |
|---|---|---|---|---|---|---|---|---|
| 2408 Gordon St Brunswick, GA | 3.0 | 2.0 | 1100 | $1,550 | $1.41 | 45d | 1 | 0.03mi |
| 1501 G St Brunswick, GA | 3.0 | 2.0 | 1064 | $1,200 | $1.13 | 45d | 1 | 0.70mi |
| 2928 Reynolds St Brunswick, GA | 4.0 | 1.0 | 1398 | $1,800 | $1.29 | 45d | 1 | 0.75mi |
| 3220 Altama Ave Brunswick, GA | 3.0 | 2.0 | 1300 | $1,650 | $1.27 | 45d | 1 | 0.90mi |
| 2640 Canary Dr Brunswick, GA | 4.0 | 2.0 | 1450 | $2,200 | $1.52 | 45d | 1 | 1.13mi |
| 3518 Hardee Ave Brunswick, GA | 3.0 | 1.0 | 948 | $1,550 | $1.64 | 45d | 1 | 1.16mi |
| 3602 Norwich St Brunswick, GA | 3.0 | 1.0 | 1012 | $1,550 | $1.53 | 45d | 1 | 1.19mi |
| 3742 Ogg Ave Brunswick, GA | 2.0 | 1.0 | 797 | $1,250 | $1.57 | 45d | 1 | 1.28mi |
| 1105 Grant St Brunswick, GA | 2.0 | 1.0 | 925 | $2,600 | $2.81 | 25d | 1 | 1.41mi |
| 900 Pointe Grand Way Brunswick, GA | 2.0 | 2.0 | 1170 | $1,520 | $1.30 | 4d | 10 | 1.50mi |
Listing history 9 events
-
2026-06-21days on market $22,000 Active 10 DOM
-
2026-06-19days on market $22,000 Active 8 DOM
-
2026-06-18days on market $22,000 Active 7 DOM
-
2026-06-17days on market $22,000 Active 6 DOM
-
2026-06-16days on market $22,000 Active 5 DOM
-
2026-06-15days on market $22,000 Active 4 DOM
-
2026-06-14days on market $22,000 Active 2 DOM
-
2026-06-13remarks 522-char remark
-
2026-06-13$22,000 Active 1 DOM
ⓘ Source: listings_history table (triggers on properties + properties_extension) + one-shot
backfill from property_details.listing_events for pre-trigger history.
Tax reassessment forecast GA · Resets to sale price
- Current annual tax
- $101 · $8/mo
- Projected year-2 tax
- $202 · $17/mo
- Expected delta
- +$101/yr (+$8/mo · 100.1%)
ⓘ Screening estimate from a state-policy table — verify with the county assessor before closing.
Climate risk First Street
- Flood 7/10 Severe FEMA zone X (shaded) · 76% chance over 30 yrs
- Wildfire 5/10 Major
- Heat 10/10 Extreme 7 d/yr ≥108°F today · 20 d/yr by 30 yrs out
- Wind 9/10 Extreme 99% chance of damaging wind over 30 yrs
- Air quality 4/10 Moderate 5 unhealthy d/yr today · 5 by 30 yrs out
Nearby sold comps map
Loading sold comps map…
Walkable amenities ~0.75 mi
Loading nearby amenities…
Taxation est. · year 1
- Rental income
- $20,293
- − Mortgage interest
- −$1,232
- − Property taxes
- −$101
- − Insurance
- −$908
- − Repairs & maintenance
- −$1,623
- − Management
- −$1,623
- − Depreciation
- −$640
- Taxable income
- $14,165
- Est. tax owed @ 24.0%
- −$3,400
- After-tax cash flow
- $10,239/yr
For passive investors: Depreciation is non-cash, so a rental often shows a tax loss while cash-flowing — sheltering income. Rental losses are passive: they offset passive income freely, and up to $25,000/yr can offset ordinary (W-2) income if you actively participate and your MAGI is under $100k (phasing out to $0 by $150k); unused losses carry forward. On sale, claimed depreciation is recaptured at up to 25%, and gains may owe capital-gains tax (a 1031 exchange can defer both). Figures are a year-1 estimate at your 24.0% rate — not tax advice; consult a CPA.
Schools (NCES district)
- District
- Glynn County
- NCES district ID
- 1302400
- Math proficiency
- 37% ▼ -9.00%
- Reading proficiency
- 42% ▼ -7.00%
- Median HH income
- $47,554
- Composite
- 33.83/100
- National rank
- #5359
- State rank
- #47 of 174 in GA
Livability — Brunswick
- Score
- 59/100
- State rank
- #401
- US rank
- #19832
Category grades
Schools grade is shown separately in the Schools card above.
Census & demographics
- Census place
- Brunswick, GA
- County
- Glynn County · 69,019 people
- City population
- 51,239
- Metro
- Brunswick, GA
- Population (ZIP)
- 22,313
- Household income
- $40,071
- Rent vs Own
- Severe rent burden
- 1406.0
Population outlook (Glynn County) Hauer SSP2
- Today (2025)
- 91,404 people
- By 2030
- 94,806 · +3.7%
- By 2040
- 100,060 · +9.5%
- By 2050
- 103,258 · +13.0%
- By 2075
- 107,970 · +18.1%
- By 2100
- 103,363 · +13.1%
Race, ethnicity, and origin ACS 2023
- Neighborhood character
- Diverse neighborhood (Simpson 0.63)
- Race & ethnicity
- Black 50% White 33% Hispanic / Latino 11% Two or more races 9% Asian 1%
- Hispanic origin (detail)
- Mexican 7%
- Common ancestry
- Italian 2% Slovak 1% Serbian 1%
- Foreign-born
- 8% · Canada, South Korea
- Languages at home
- 87% English-only · Spanish 10% French/Haitian/Cajun 1% Korean 1%
Political lean MEDSL · Glynn
- 2024 margin
- Strong R (+26.0) · D 36.8% · R 62.8%
- 2008→2024 swing
- -2.6pp toward R · 2008: -23.4pp · 2024: -26.0pp
- All cycles
- 2024: R+26.0 2020: R+23.2 2016: R+28.6 2012: R+27.0 2008: R+23.4
Not yet ingested
- Civics
- —
Market trends
- HPI YoY
- ▼ -274.83%
- Current HPI
- 180.4581
- Rent YoY
- ▲ 5.08%
- Metro
- Brunswick, GA
- State GDP YoY
- ▲ 2.66%
- F500 in state
- 28
Industry mix (Fortune 500 HQ in GA)
| Industry | F500 HQs | Revenue |
|---|---|---|
| Paper / Packaging | 2 | $29B |
|
||
| Retail | 1 | $160B |
|
||
| Transportation / Logistics | 1 | $91B |
|
||
| Airlines | 1 | $62B |
|
||
| Consumer Goods | 1 | $47B |
|
||
| Utilities | 1 | $25B |
|
||
Price history
+47.7% since first listed5 events — show timeline
- 2026-06-11 Listed $22,000 GIAR
- 2021-07-12 Sold (MLS) $12,500 GIAR
- 2021-06-04 Listed $15,000 GIAR
- 2009-04-20 Sold (MLS) $8,000 GIAR
- 2008-12-17 Listed $14,900 GIAR
Property tax history
-14.0%/yrLatest (2025): $101 · -45.5% YoY. Source: county tax records.
Cash-flow waterfall
monthlySold comps — $/sqft
last 12 mo · ≤1 miLoading sold comps…