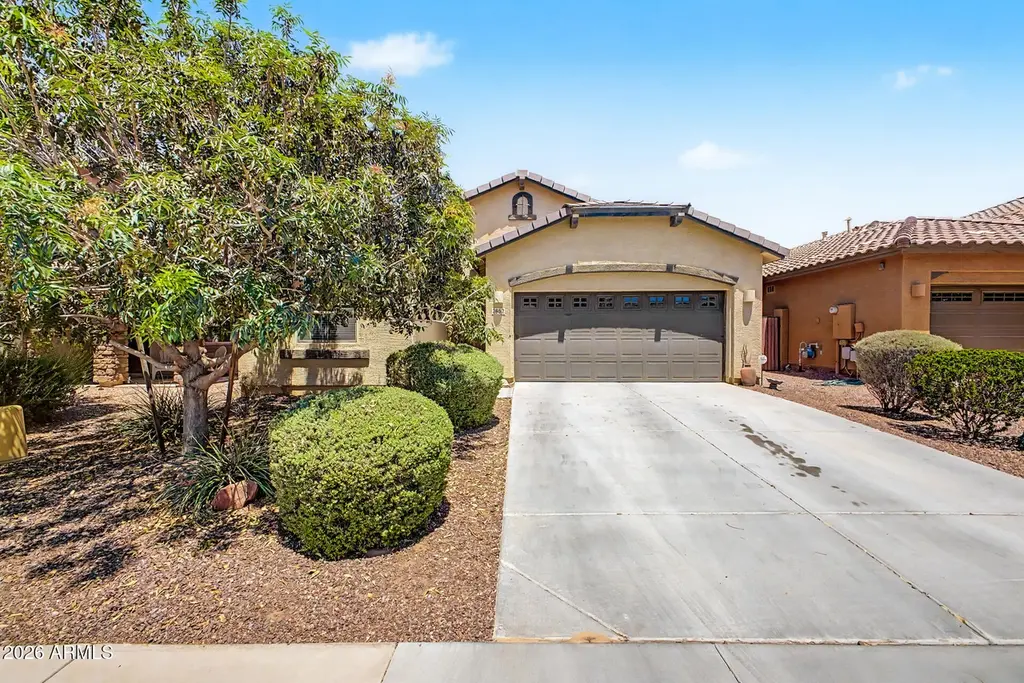
3862 E Narrowleaf Dr · Gilbert, AZ
Flood risk 1/10 · Minimal
- FEMA flood zone
- X (shaded)
- Chance of flooding over 30 yrs
- 0.0%
- Est. flood insurance / yr
- $507 – $1,088
Fire risk 5/10 · Moderate
- Est. fire insurance / yr
- $610 – $1,132
Heat risk 9/10 · Severe
- Hot days now (above 111°F)
- 7 days/yr
- Hot days in 30 yrs
- 19 days/yr
Wind risk 1/10 · Minimal
- Chance of severe wind over 30 yrs
- —
Air-quality risk 2/10 · Minimal
- Unhealthy air days now
- 1 days/yr
- Unhealthy air days in 30 yrs
- 1 days/yr
Risk factors via First Street. Map © Google.
Why this score? — see what drove the D grade
The composite is a weighted blend of 9 inputs, each scored 0–100. Each bar is that input's sub-score; the figure is the points it added to the 100-point composite (weight × sub-score).
- ARV discount +11.1/15.0
- Appreciation +9.2/10.0
- Cash flow +6.3/30.0
- Schools +5.2/10.0
- Livability +4.4/5.0
- Rent growth +3.6/5.0
- Condition / age +2.5/5.0
- 1% rule +0.6/10.0
- DSCR +0.6/10.0
$535,000
🖨 Deal sheet (PDF) 📄 Offer letter ✓ Due diligence
Key facts
- 5,175 sq ft lot
- 2 garage spots
- Built 2016
Property features AI
Finance
- HOA & community: Homeowners association with quarterly fee of $350; Community biking/walking path
Exterior
- Parking: Covered parking for 2 cars; 2-car garage with direct access and garage door opener
- Utilities: City water; Public sewer
- Home design: Single-family residence; Fee simple ownership
- Construction: Stucco and wood frame construction; Painted exterior; Tile roof
- Exterior features: Block fencing; Sprinklers in rear; Desert-style front landscaping; Gravel/stone front and back; Grass in back yard; Automatic water timer front and back
Interior
- Kitchen: Built-in microwave; Dishwasher; Disposal; Reverse osmosis / water purifier; Pantry
- Bedrooms: Up to 4 bedrooms
- Flooring: Carpet; Tile
- Bathrooms: 3 full bathrooms
- Heating & cooling: Electric heating; Central air conditioning; Ceiling fans; Programmable thermostat
- Interior features: High-speed internet; Granite counters; Double vanity; Eat-in kitchen; Breakfast bar; Pantry
- Laundry & utility: Inside laundry; Washer/dryer hookups
Neighborhood map
What this means for you Summary
Snapshot
- This is a 4-bed/4.0-bath single-family listed at $535k.
Deal economics
- At list price, monthly cash flow is $-944 ($-11k/yr) — negative.
- To cash-flow at today's rent, offer at most $368k (31.2% below list).
- To meet the 1% rule (rent ≥ 1% of price), the offer needs to be $302k (43.6% below list).
- Recommended offer: $302k (43.6% below list) — sets the bar for 1% rule.
- Cap rate 4.2% vs local median 3.2% in Gilbert — top-decile yield for the area; either an underpriced asset or a hidden risk that comps aren't pricing in. Stress-test before assuming the spread holds.
Location & tenants
- Location reads 87/100 on livability (#1 in AZ, #240 nationally) — a professional / high-income tenant draw. Strengths: amenities A+, employment A+, housing A+; Watch: health & safety C-, cost of living F.
- Higley Unified School District (4248) (suburban): math 56% / reading 58% proficiency, ranked #21 of 249 in AZ (top 8%) — acceptable for families but not a draw, mixed tenant base, ~2y average lease; only 15% free/reduced lunch — higher-income household profile.
- Zoned schools: Bridges Elementary School (math 80% / reading 79%, grade A, #13 of 1,109 statewide, top 1%, 759 students, 7% FRL); Sossaman Middle School (math 59% / reading 60%, grade B, #4 of 218 statewide, top 1%, 1,043 students, 13% FRL); Higley High School (math 49% / reading 47%, grade D, #46 of 381 statewide, top 12%, 2,137 students, 12% FRL) — zoned schools at 11% FRL track the district average.
- Market conditions: Rents rising fast (+4.3%/yr); 340 active listings in the ZIP; 23 comparable units currently listed for rent nearby; rentals at typical pace (median 17d on market — plan ~3-4 weeks tenant-placement turnaround); high-income renter base; 36,011 units permitted in Maricopa County in 2024 (12,801 in 5+ unit buildings).
Forward outlook
- In year one you build about $48k of equity ($4k loan paydown + $45k appreciation (8.4% local appreciation)).
- Maricopa County population projected at +38% by 2050 — long-run rental-demand tailwind backs the buy-and-hold thesis.
- By year 2, paydown + projected appreciation supports a ~$78k cash-out refi (75% LTV) — recoverable capital for the next deal without selling this one.
Negotiation context
- It's been on market 23 days — a 2% lower offer ($527k) is reasonable based on typical stale-listing flexibility.
- 3 sale attempts since 2y ago with the ask held roughly flat each time — persistent listings suggest the price (not the market) is what's stuck; bring a comps-based counter.
Risks & watch-outs
- Climate carrying-cost: moderate wildfire risk; extreme-heat days projected 7→19/yr by 2055 (HVAC capex compounding) — expect insurance premiums to compound above CPI over the hold.
Questions for the listing agent
- What do current leases actually rent for vs. the listed asking? Can we see a recent rent roll and the last 12 months of T-12 income?
- What does the HOA fee cover, when was the last increase, and are there any pending special assessments or reserve-fund shortfalls?
- Is there a deadline driving the sale (1031 exchange, divorce, estate, relocation)? That informs how much negotiation room exists.
- Schools are A-rated — typically a magnet for longer-tenancy family renters. What's the average tenant stay here, and is there a school-zone premium baked into asking?
- The area grade is low — what's the realistic commute time and amenity access for the typical tenant pool here? Any planned neighborhood developments (good or bad) we should know about?
- What's the average days-on-market for RENTAL listings here right now (not sales)? A rising rental-DOM trend means longer vacancies and softer asking-rent achievability than the comps imply.
- What's the recent tenant-quality profile in this submarket — average credit score on applications, eviction rate, late-payment / NSF rate, and stable-employment percentage? A property-management company in the area should have these aggregated.
- How much new for-sale + rental construction is in the pipeline within 1–3 miles? Heavy new supply typically softens prices + rents 12–24 months out; constrained supply supports both.
Investment metrics
- 1% rule
- 0.56% ✗
- Cap rate
- 4.18%
- Cash-on-cash
- -7.56%
- DSCR
- 0.66
- GRM
- 14.8
CMA / ARV
- ARV (on-the-fly)
- $582,000
- Comps found
- 12
Show comp detail 12 sales within ~0.75 mi
| Address | Dist | Beds/Ba | Sqft | Sold | Price | $/sf | Match |
|---|---|---|---|---|---|---|---|
| 3918 E Narrowleaf Dr | 0.08mi | 5/3.0 (+1) | 1,940 (0%) | 3mo | $502,000 | $259 | 84 |
| 3911 E Sourwood Dr | 0.10mi | 5/3.0 (+1) | 1,940 (0%) | 4mo | $475,000 | $245 | 83 |
| 3843 E Narrowleaf Dr | 0.04mi | 4/2.0 | 1,800 (-7%) | 4mo | $540,000 | $300 | 75 |
| 3870 E Ficus Way | 0.09mi | 3/2.5 (-1) | 2,173 (+12%) | 2mo | $633,000 | $291 | 63 |
| 4033 E Narrowleaf Dr | 0.22mi | 3/2.0 (-1) | 2,114 (+9%) | 0mo | $615,000 | $291 | 61 |
| 3667 E Jude Ln | 0.37mi | 4/3.0 | 2,202 (+14%) | 2mo | $685,000 | $311 | 54 |
| 3716 E Lodgepole Dr | 0.18mi | 3/2.0 (-1) | 1,677 (-14%) | 3mo | $521,700 | $311 | 54 |
| 5066 S Moccasin Trl | 0.72mi | 3/2.5 (-1) | 2,004 (+3%) | 1mo | $585,000 | $292 | 49 |
| 3392 E Myrtabel Way | 0.68mi | 4/2.0 | 2,079 (+7%) | 1mo | $645,000 | $310 | 48 |
| 5199 S Moccasin Trl | 0.56mi | 4/2.5 | 2,177 (+12%) | 1mo | $690,000 | $317 | 47 |
| 5193 S Moccasin Trl | 0.57mi | 4/2.5 | 2,177 (+12%) | 2mo | $675,000 | $310 | 46 |
| 3420 E Indigo St | 0.68mi | 4/2.5 | 2,177 (+12%) | 2mo | $600,000 | $276 | 40 |
Match score weights: distance 35% · size 25% · config 20% · recency 20%. Top-matched comps best support the ARV.
Projected returns pro-forma
8.36% appreciation · 4.31% rent growth · sell at horizon
- IRR
- 15.5%
- Equity multiple
- 2.18×
- Total profit
- $176,590
- Equity at exit
- $419,734
- IRR
- 15.3%
- Equity multiple
- 4.78×
- Total profit
- $566,222
- Equity at exit
- $846,163
Cash invested: $149,800 (down + closing). Projections, not guarantees.
Landlord ↔ Tenant lean methodology
- Overall (STATE)
- 87 Strongly Landlord-Friendly
- State Arizona
- 87 Strongly Landlord-Friendly · R+3
- County
- — inherits STATE
- City
- — inherits STATE
ZIP-level market 85298
- Home prices YoY
- 2.5%
- Rents YoY
- 4.3%
- Active inventory
- 340
- Price-to-rent
- 14.8×
Monthly cashflow live
- Estimated rent
- $3,017 high interval (Pro) →
- Mortgage (P&I)
- −$2,806
- Tax from tax record
- −$182 /mo · $2,181/yr
- Insurance
- −$223
- HOA
- −$117
- Vacancy / Maint / Mgmt
- −$634
- Net cashflow
- $-944
Break-even live
Sensitivity live
| Price | -10% $-641 | -5% $-793 | +0% $-944 | +5% $-1,096 | +10% $-1,247 |
|---|---|---|---|---|---|
| Rent | -10% $-1,182 | -5% $-1,063 | +0% $-944 | +5% $-825 | +10% $-706 |
| Rate | -1.0pp $-675 | -0.5pp $-808 | base $-944 | +0.5pp $-1,083 | +1.0pp $-1,224 |
UW: 25.0% down · 7.5% · 30yr · 1.5% tax · 5.0% vac · 8.0% maint · 8.0% mgmt
Financing live
Cash to close
- Down payment
- $133,750
- Closing costs
- $16,050
- Reserves months
- —
- Total cash needed
- —
Loan-product check · same deal, 3 products live
Conventional
25% down · 7.5% · 30yr
- Down + closing
- —
- Monthly P&I
- —
- Monthly cashflow
- —
- DSCR
- —
- Eligible?
- —
Personal DTI + credit; lowest rate.
DSCR
20% down · 8.5% · 30yr
- Down + closing
- —
- Monthly P&I
- —
- Monthly cashflow
- —
- DSCR
- —
- Eligible?
- —
No personal income docs; deal must DSCR.
Hard money
10% down · 12.0% · 12mo
- Down + closing
- —
- Monthly P&I
- —
- Monthly cashflow
- —
- DSCR
- —
- Eligible?
- —
Short-term bridge; refi at stabilization.
Rent comps 23 comps
| Address | Beds | Baths | Sqft | Rent | $/sqft | DOM | Units | Dist |
|---|---|---|---|---|---|---|---|---|
| 5434 S Forest Ave Gilbert, AZ | 4.0 | 2.0 | 2341 | $2,900 | $1.24 | 20d | 1 | 0.06mi |
| 3710 E Lodgepole Dr Gilbert, AZ | 3.0 | 2.0 | 1818 | $2,650 | $1.46 | 14d | 1 | 0.20mi |
| 3636 E Lodgepole Dr Gilbert, AZ | 3.0 | 2.0 | 1818 | $3,075 | $1.69 | 18d | 1 | 0.29mi |
| 4279 E Sourwood Dr Gilbert, AZ | 3.0 | 2.0 | 2156 | $10,600 | $4.92 | 0d | 1 | 0.52mi |
| 5149 S Moccasin Trl Gilbert, AZ | 3.0 | 2.5 | 1675 | $2,575 | $1.54 | 0d | 1 | 0.61mi |
| 3486 E Anika Ct Gilbert, AZ | 4.0 | 2.0 | 1749 | $2,600 | $1.49 | 45d | 1 | 0.88mi |
| 3432 E Strawberry Dr Gilbert, AZ | 4.0 | 3.0 | 2080 | $3,695 | $1.78 | 3d | 1 | 0.92mi |
| 3830 E Thornton Ave Unit 1546326P Gilbert, AZ | 3.0 | 2.0 | 2292 | $3,902 | $1.70 | 18d | 1 | 0.94mi |
| 3868 E Palmer St Gilbert, AZ | 3.0 | 2.5 | 1899 | $2,000 | $1.05 | 45d | 1 | 1.07mi |
| 3462 E Powell Way Gilbert, AZ | 3.0 | 2.0 | 1665 | $2,295 | $1.38 | 26d | 1 | 1.08mi |
| 6334 S Blake St Gilbert, AZ | 3.0 | 2.0 | 1421 | $2,100 | $1.48 | 45d | 1 | 1.10mi |
| 3808 E Flower Ct Gilbert, AZ | 3.0 | 2.5 | 1628 | $2,095 | $1.29 | 7d | 1 | 1.15mi |
| 3441 E Baranca Ct Gilbert, AZ | 5.0 | 2.0 | 1903 | $2,855 | $1.50 | 3d | 1 | 1.15mi |
| 3329 E Powell Ct Gilbert, AZ | 3.0 | 2.0 | 1486 | $2,345 | $1.58 | 16d | 1 | 1.19mi |
| 2983 E Ironside Ln Gilbert, AZ | 3.0 | 2.0 | 2450 | $2,450 | $1.00 | 45d | 1 | 1.20mi |
| 2954 E Coconino Dr Gilbert, AZ | 4.0 | 2.0 | 2180 | $2,590 | $1.19 | 5d | 1 | 1.23mi |
| 4231 E Marshall Ave Gilbert, AZ | 4.0 | 2.0 | 2209 | $2,700 | $1.22 | 5d | 1 | 1.29mi |
| 3570 E Meadowview Dr Gilbert, AZ | 4.0 | 3.0 | 2536 | $3,200 | $1.26 | 4d | 1 | 1.32mi |
| 3725 E Meadowview Dr Gilbert, AZ | 3.0 | 2.0 | 1404 | $2,750 | $1.96 | 26d | 1 | 1.37mi |
| 2965 E Blue Ridge Way Gilbert, AZ | 4.0 | 2.0 | 1651 | $2,400 | $1.45 | 0d | 1 | 1.38mi |
| 2927 E Mead Dr Gilbert, AZ | 4.0 | 2.0 | 1651 | $2,250 | $1.36 | 20d | 1 | 1.39mi |
| 4374 S Woodshed Rd Gilbert, AZ | 3.0 | 2.5 | 1724 | $2,249 | $1.30 | 22d | 1 | 1.46mi |
| 2717 E Ficus Way Gilbert, AZ | 3.0 | 2.0 | 2295 | $2,550 | $1.11 | 0d | 1 | 1.47mi |
HOA detail
- Monthly dues
- $117 · $1,404/yr
Listing history 25 events
-
2026-06-21days on market $535,000 Active 23 DOM
-
2026-06-18days on market $535,000 Active 20 DOM
-
2026-06-17days on market $535,000 Active 19 DOM
-
2026-06-16days on market $535,000 Active 18 DOM
-
2026-06-15days on market $535,000 Active 17 DOM
-
2026-06-13days on market $535,000 Active 15 DOM
-
2026-06-10price $535,000 Active 11 DOM
-
2026-06-09days on market $540,000 Active 11 DOM
-
2026-06-08days on market $540,000 Active 10 DOM
-
2026-06-07days on market $540,000 Active 9 DOM
-
2026-06-04days on market $540,000 Active 6 DOM
-
2026-06-03days on market $540,000 Active 5 DOM
-
2026-06-02days on market $540,000 Active 4 DOM
-
2026-06-01days on market $540,000 Active 3 DOM
-
2026-05-31days on market $540,000 Active 2 DOM
-
2026-05-29$540,000 Active
-
2025-01-10status Active
-
2025-01-10historical
-
2025-01-09historical
-
2025-01-04price $545,000
-
2024-12-07price $550,000
-
2024-11-20price $564,900
-
2024-10-26price $575,000
-
2024-10-05price $584,900
-
2024-08-22$599,000 Active
ⓘ Source: listings_history table (triggers on properties + properties_extension) + one-shot
backfill from property_details.listing_events for pre-trigger history.
Tax reassessment forecast AZ · Resets to sale price
- Current annual tax
- $2,181 · $182/mo
- Projected year-2 tax
- $3,531 · $294/mo
- Expected delta
- +$1,350/yr (+$113/mo · 61.9%)
ⓘ Screening estimate from a state-policy table — verify with the county assessor before closing.
Climate risk First Street
- Flood 1/10 Low FEMA zone X (shaded) · 0% chance over 30 yrs
- Wildfire 5/10 Major
- Heat 9/10 Extreme 7 d/yr ≥111°F today · 19 d/yr by 30 yrs out
- Wind 1/10 Low
- Air quality 2/10 Low 1 unhealthy d/yr today · 1 by 30 yrs out
Nearby sold comps map
Loading sold comps map…
Walkable amenities ~0.75 mi
Loading nearby amenities…
Taxation est. · year 1
- Rental income
- $36,200
- − Mortgage interest
- −$29,968
- − Property taxes
- −$2,181
- − Insurance
- −$2,675
- − Repairs & maintenance
- −$2,896
- − Management
- −$2,896
- − HOA
- −$1,404
- − Depreciation
- −$15,564
- Taxable loss
- −$21,384
- Est. tax savings @ 24.0%
- +$5,132
- After-tax cash flow
- $-6,197/yr
For passive investors: Depreciation is non-cash, so a rental often shows a tax loss while cash-flowing — sheltering income. Rental losses are passive: they offset passive income freely, and up to $25,000/yr can offset ordinary (W-2) income if you actively participate and your MAGI is under $100k (phasing out to $0 by $150k); unused losses carry forward. On sale, claimed depreciation is recaptured at up to 25%, and gains may owe capital-gains tax (a 1031 exchange can defer both). Figures are a year-1 estimate at your 24.0% rate — not tax advice; consult a CPA.
Schools (NCES district)
- District
- Higley Unified School District (4248)
- NCES district ID
- 0403780
- Math proficiency
- 56% ▼ -10.00%
- Reading proficiency
- 58% ▼ -8.00%
- Median HH income
- $82,526
- Composite
- 51.7/100
- National rank
- #1688
- State rank
- #21 of 249 in AZ
Livability — Gilbert
- Score
- 87/100
- State rank
- #1
- US rank
- #240
Category grades
Schools grade is shown separately in the Schools card above.
Census & demographics
- Census place
- Gilbert, AZ
- County
- Maricopa County · 4,537,380 people
- City population
- 281,769
- Metro
- Phoenix-Mesa-Chandler, AZ
- Population (ZIP)
- 44,114
- Household income
- $156,425
- Rent vs Own
- Severe rent burden
- 173.0
Population outlook (Maricopa County) Hauer SSP2
- Today (2025)
- 4,979,203 people
- By 2030
- 5,378,229 · +8.0%
- By 2040
- 6,156,598 · +23.6%
- By 2050
- 6,872,376 · +38.0%
- By 2075
- 8,401,270 · +68.7%
- By 2100
- 9,247,439 · +85.7%
Race, ethnicity, and origin ACS 2023
- Neighborhood character
- Predominantly White (72%)
- Race & ethnicity
- White 72% Hispanic / Latino 14% Two or more races 11% Asian 7% Black 2%
- Hispanic origin (detail)
- Mexican 10%
- Common ancestry
- Italian 4% Romanian 3% Lithuanian 3%
- Foreign-born
- 9% · Canada, China, Vietnam
- Languages at home
- 85% English-only · Spanish 7% Other Indo-European 2% Chinese 1%
Political lean MEDSL · Maricopa
- 2024 margin
- Toss-up / Even · D 47.7% · R 51.2% · Other 1.1%
- 2008→2024 swing
- +7.1pp toward D · 2008: -10.6pp · 2024: -3.5pp
- All cycles
- 2024: R+3.5 2020: D+2.2 2016: R+3.5 2012: R+12.0 2008: R+10.6
Not yet ingested
- Civics
- —
Market trends
- HPI YoY
- ▲ 8.36%
- Current HPI
- 343.6932
- Rent YoY
- ▲ 4.31%
- Metro
- Phoenix-Mesa-Chandler, AZ
- State GDP YoY
- ▲ 4.54%
- F500 in state
- 20
Industry mix (Fortune 500 HQ in AZ)
| Industry | F500 HQs | Revenue |
|---|---|---|
| Technology | 2 | $13B |
|
||
| Mining / Metals | 1 | $23B |
|
||
| Environmental Services | 1 | $16B |
|
||
| Metals / Steel | 1 | $14B |
|
||
| Technology Distribution | 1 | $9B |
|
||
| Homebuilding | 1 | $8B |
|
||
Price history
-9.8% since first listed10 events — show timeline
- 2026-05-29 Listed $540,000 ARMLS
- 2025-01-10 Relisted — ARMLS
- 2025-01-10 Listing Removed — ARMLS
- 2025-01-09 Listing Removed — ARMLS
- 2025-01-04 Price Changed $545,000 ARMLS
- 2024-12-07 Price Changed $550,000 ARMLS
- 2024-11-20 Price Changed $564,900 ARMLS
- 2024-10-26 Price Changed $575,000 ARMLS
- 2024-10-05 Price Changed $584,900 ARMLS
- 2024-08-22 Listed $599,000 ARMLS
Property tax history
+11.9%/yrLatest (2025): $2,181 · -4.8% YoY. Source: county tax records.
Cash-flow waterfall
monthlySold comps — $/sqft
last 12 mo · ≤1 miLoading sold comps…