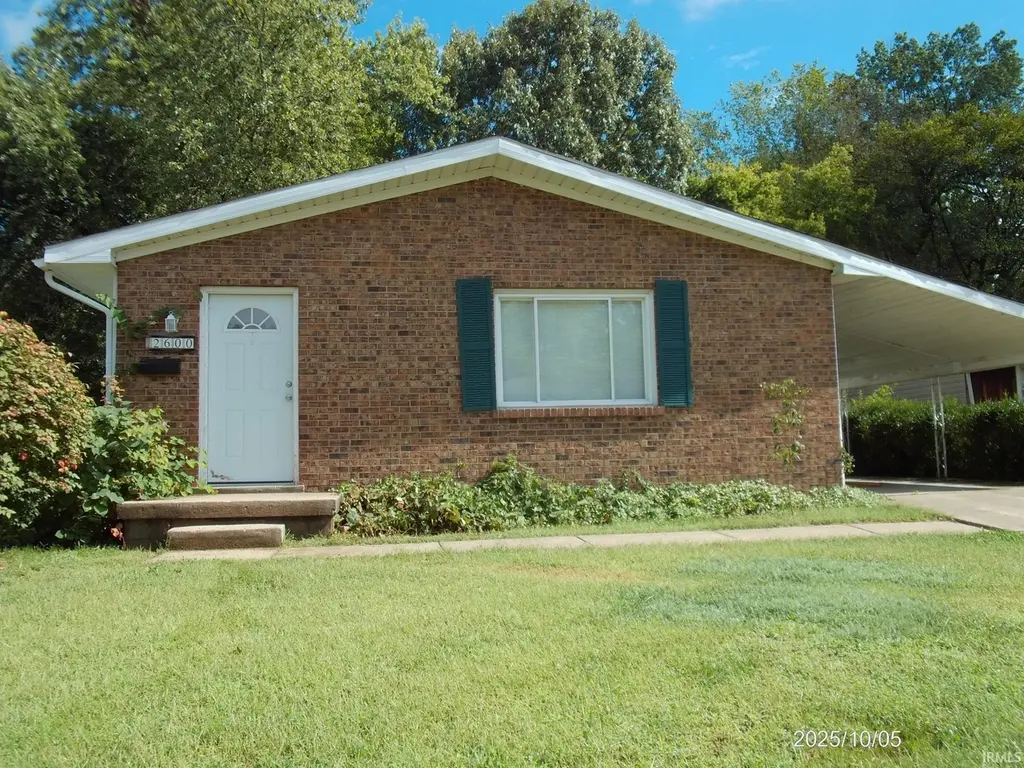
2600 Hawthorne Ave · Evansville, IN
Flood risk 4/10 · Minor
- FEMA flood zone
- X
- Chance of flooding over 30 yrs
- 0.22%
- Est. flood insurance / yr
- $507 – $1,088
Fire risk 3/10 · Minor
- Est. fire insurance / yr
- $717 – $1,331
Heat risk 5/10 · Moderate
- Hot days now (above 107°F)
- 7 days/yr
- Hot days in 30 yrs
- 19 days/yr
Wind risk 2/10 · Minimal
- Chance of severe wind over 30 yrs
- 3.0%
Air-quality risk 3/10 · Minor
- Unhealthy air days now
- 3 days/yr
- Unhealthy air days in 30 yrs
- 4 days/yr
Risk factors via First Street. Map © Google.
Why this score? — see what drove the D grade
The composite is a weighted blend of 9 inputs, each scored 0–100. Each bar is that input's sub-score; the figure is the points it added to the 100-point composite (weight × sub-score).
- Cash flow +13.2/30.0
- ARV discount +7.2/15.0
- Rent growth +4.5/5.0
- DSCR +4.0/10.0
- 1% rule +3.4/10.0
- Schools +3.3/10.0
- Livability +3.2/5.0
- Condition / age +2.5/5.0
- Appreciation +0.0/10.0
$145,000
🖨 Deal sheet (PDF) 📄 Offer letter ✓ Due diligence
Listing remarks
This single-family home located at 2600 Hawthorne Ave in Evansville, IN was built in 1979 and offers a cozy living space. With a total of 1 bathroom, and 1,014 square feet of finished area. Low traffic neighborhood, offering both privacy and convenience. Concrete drive, with car port adds to the home's convenience. Plenty of off-street parking add even more value and flexibility, full of potential and ready for your personal touches. Almost newish self cleaning electric stove, convection oven, air fryer combo and fridge are included in the sale. Electric furnace and air, electric hot water tank, nearly new. This fantastic 3 bedroom one bath home was reroofed in 2012. Home has been remodeled
Key facts
- Air fryer combo
- Car port
- Concrete drive
Tags
Property features AI
Exterior
- Utilities: Public water; Public sewer; Cable available
- Home design: Single-family residential, site-built home; One story
- Construction: Vinyl siding; Asphalt roof
- Exterior features: Level lot
Interior
- Kitchen: Refrigerator; Electric cooktop; Convection oven
- Bedrooms: Total rooms: 6
- Flooring: Hardwood; Carpet; Vinyl
- Bathrooms: 1 full bathroom (main level)
- Heating & cooling: Electric heating; Central air; Ceiling fans for cooling; Zoned cooling
- Interior features: Ceiling fans; Laminate countertops; Master suite on the main floor; Crawl space basement
Neighborhood map
What this means for you Summary
Snapshot
- This is a 3-bed/1.0-bath single-family listed at $145k.
Deal economics
- At list price, monthly cash flow is $-2 ($-20/yr) — negative.
- To cash-flow at today's rent, offer at most $145k (0.2% below list).
- To meet the 1% rule (rent ≥ 1% of price), the offer needs to be $122k (15.9% below list).
- Recommended offer: $122k (15.9% below list) — sets the bar for 1% rule.
- Cap rate 6.3% vs local median 4.6% in Evansville — top-decile yield for the area; either an underpriced asset or a hidden risk that comps aren't pricing in. Stress-test before assuming the spread holds.
Location & tenants
- Location reads 63/100 on livability (#416 in IN) — a middle-class / working-renter tenant base. Strengths: cost of living A+, housing A+, health & safety A+; Watch: crime F, commute F, employment D-.
- Evansville Vanderburgh School Corporation (urban): math 36% / reading 43% proficiency, ranked #153 of 301 in IN (top 51%) — families likely to look elsewhere, expect single-tenant / working-renter base with shorter leases.
- Zoned schools: Fairlawn Elementary School (math 22% / reading 22%, grade F, #790 of 994 statewide, top 81%, 422 students, 76% FRL); Mcgary Middle School (math 8% / reading 15%, grade F, #311 of 330 statewide, top 94%, 351 students, 81% FRL); William Henry Harrison High School (math 29% / reading 54%, grade F, #211 of 369 statewide, top 58%, 1,158 students, 61% FRL) — zoned schools average 72% FRL vs 50% district-wide (23 pts higher); higher-poverty schools than district average — tighter screening recommended.
- Zoned-school proficiency averages 25% at this address vs 40% district-wide (-14 pts) — the specific schools serving this property underperform the Evansville Vanderburgh School Corporation average; the district grade overstates school quality for this exact location.
- Market conditions: Rents rising fast (+7.9%/yr); 191 active listings in the ZIP; 19 comparable units currently listed for rent nearby; rentals at typical pace (median 23d on market — plan ~3-4 weeks tenant-placement turnaround); 508 units permitted in Vanderburgh County in 2024 (32 in 5+ unit buildings).
Forward outlook
- Local home prices are declining (-3.0%/yr); year-one equity from $1k of loan paydown is wiped out by about $4k of value loss. Plan a longer hold.
Negotiation context
- It's been on market 67 days — a 6% lower offer ($136k) is reasonable based on typical stale-listing flexibility.
Risks & watch-outs
- Climate carrying-cost: extreme-heat days projected 7→19/yr by 2055 (HVAC capex compounding) — expect insurance premiums to compound above CPI over the hold.
Questions for the listing agent
- What do current leases actually rent for vs. the listed asking? Can we see a recent rent roll and the last 12 months of T-12 income?
- It's been on market 67 days. Have you received any prior offers? Is the seller open to a 16% concession, seller financing, or rate buy-down credit?
- Built in 1979 — when were the roof, HVAC, electrical panel, plumbing, and water heater last replaced?
- Why hasn't it sold? Are there any deal-killer items the seller is aware of (foundation, flood, title, zoning, code violations)?
- Is there a deadline driving the sale (1031 exchange, divorce, estate, relocation)? That informs how much negotiation room exists.
- Schools are D-rated, which usually means shorter tenancies and higher turnover. Who's the typical renter profile here, and what's been the actual vacancy rate?
- Crime grade is F in this area — have there been break-ins, vandalism, or insurance claims at this property in the last 3 years? What carrier currently insures it and at what premium?
- The area grade is low — what's the realistic commute time and amenity access for the typical tenant pool here? Any planned neighborhood developments (good or bad) we should know about?
- What's the average days-on-market for RENTAL listings here right now (not sales)? A rising rental-DOM trend means longer vacancies and softer asking-rent achievability than the comps imply.
- What's the recent tenant-quality profile in this submarket — average credit score on applications, eviction rate, late-payment / NSF rate, and stable-employment percentage? A property-management company in the area should have these aggregated.
- How much new for-sale + rental construction is in the pipeline within 1–3 miles? Heavy new supply typically softens prices + rents 12–24 months out; constrained supply supports both.
Investment metrics
- 1% rule
- 0.84% ✗
- Cap rate
- 6.28%
- Cash-on-cash
- -0.05%
- DSCR
- 1.00
- GRM
- 9.9
CMA / ARV
- ARV (on-the-fly)
- $143,988
- Comps found
- 12
Show comp detail 12 sales within ~0.75 mi
| Address | Dist | Beds/Ba | Sqft | Sold | Price | $/sf | Match |
|---|---|---|---|---|---|---|---|
| 2607 Hawthorne Ave | 0.03mi | 3/1.0 | 1,014 (0%) | 2mo | $153,000 | $151 | 97 |
| 2625 Hawthorne Ave | 0.05mi | 3/1.0 | 988 (-3%) | 3mo | $140,000 | $142 | 91 |
| 2917 Culverson Ave | 0.10mi | 2/1.0 (-1) | 1,037 (+2%) | 2mo | $108,250 | $104 | 84 |
| 2714 Vann Ave | 0.22mi | 2/1.0 (-1) | 1,038 (+2%) | 0mo | $149,900 | $144 | 80 |
| 2511 S Ruston Ave | 0.15mi | 3/1.0 | 925 (-9%) | 2mo | $90,000 | $97 | 77 |
| 2524 E Riverside Dr | 0.19mi | 3/1.0 | 923 (-9%) | 2mo | $139,000 | $151 | 75 |
| 3407 Pollack Ave | 0.45mi | 3/1.0 | 970 (-4%) | 1mo | $130,000 | $134 | 71 |
| 2222 Frisse Ave | 0.53mi | 3/1.0 | 972 (-4%) | 2mo | $119,900 | $123 | 66 |
| 3412 Conlin Ave | 0.64mi | 3/1.0 | 988 (-3%) | 4mo | $155,000 | $157 | 62 |
| 2300 Margybeth Ave | 0.52mi | 3/2.0 | 1,104 (+9%) | 2mo | $103,000 | $93 | 56 |
| 2328 Frisse Ave | 0.40mi | 2/1.0 (-1) | 868 (-14%) | 4mo | $139,000 | $160 | 49 |
| 1809 Mcconnell Ave | 0.56mi | 2/1.0 (-1) | 1,164 (+15%) | 7mo | $70,000 | $60 | 39 |
Match score weights: distance 35% · size 25% · config 20% · recency 20%. Top-matched comps best support the ARV.
Projected returns pro-forma
-3.0% appreciation · 7.86% rent growth · sell at horizon
- IRR
- -11.3%
- Equity multiple
- 0.57×
- Total profit
- $-17,349
- Equity at exit
- $21,620
- IRR
- 3.7%
- Equity multiple
- 1.32×
- Total profit
- $13,141
- Equity at exit
- $12,537
Cash invested: $40,600 (down + closing). Projections, not guarantees.
Landlord ↔ Tenant lean methodology
- Overall (STATE)
- 90 Strongly Landlord-Friendly
- State Indiana
- 90 Strongly Landlord-Friendly · R+11
- County
- — inherits STATE
- City
- — inherits STATE
ZIP-level market 47714
- Rents YoY
- 7.9%
- Active inventory
- 191
- Price-to-rent
- 9.9×
Monthly cashflow live
- Estimated rent
- $1,220 high interval (Pro) →
- Mortgage (P&I)
- −$760
- Tax from tax record
- −$145 /mo · $1,737/yr
- Insurance
- −$60
- HOA
- −$0
- Vacancy / Maint / Mgmt
- −$256
- Net cashflow
- $-2
Break-even live
Sensitivity live
| Price | -10% $80 | -5% $39 | +0% $-2 | +5% $-43 | +10% $-84 |
|---|---|---|---|---|---|
| Rent | -10% $-98 | -5% $-50 | +0% $-2 | +5% $47 | +10% $95 |
| Rate | -1.0pp $71 | -0.5pp $35 | base $-2 | +0.5pp $-39 | +1.0pp $-77 |
UW: 25.0% down · 7.5% · 30yr · 1.5% tax · 5.0% vac · 8.0% maint · 8.0% mgmt
Financing live
Cash to close
- Down payment
- $36,250
- Closing costs
- $4,350
- Reserves months
- —
- Total cash needed
- —
Loan-product check · same deal, 3 products live
Conventional
25% down · 7.5% · 30yr
- Down + closing
- —
- Monthly P&I
- —
- Monthly cashflow
- —
- DSCR
- —
- Eligible?
- —
Personal DTI + credit; lowest rate.
DSCR
20% down · 8.5% · 30yr
- Down + closing
- —
- Monthly P&I
- —
- Monthly cashflow
- —
- DSCR
- —
- Eligible?
- —
No personal income docs; deal must DSCR.
Hard money
10% down · 12.0% · 12mo
- Down + closing
- —
- Monthly P&I
- —
- Monthly cashflow
- —
- DSCR
- —
- Eligible?
- —
Short-term bridge; refi at stabilization.
Rent comps 19 comps
| Address | Beds | Baths | Sqft | Rent | $/sqft | DOM | Units | Dist |
|---|---|---|---|---|---|---|---|---|
| 2818 S Villa Dr Evansville, IN | 3.0 | 1.0 | 1061 | $1,295 | $1.22 | 22d | 1 | 0.14mi |
| 2232 E Riverside Dr Evansville, IN | 2.0 | 1.0 | 810 | $1,200 | $1.48 | 15d | 1 | 0.48mi |
| 2001 S Taft Ave Evansville, IN | 3.0 | 2.0 | 1472 | $1,000 | $0.68 | 22d | 1 | 0.56mi |
| 1713 Hawthorne Ave Evansville, IN | 3.0 | 2.0 | 1204 | $1,395 | $1.16 | 22d | 1 | 0.68mi |
| 1762 Spring Ct Evansville, IN | 2.0 | 1.0 | 975 | $1,450 | $1.49 | 22d | 1 | 0.89mi |
| 2947 Ravenswood Dr Unit 2927 Evansville, IN | 2.0 | 1.0 | 1150 | $975 | $0.85 | 22d | 1 | 0.91mi |
| 1952 Colts Ln Evansville, IN | 1.0–3.0 | 1.0 | 1146 | $1,275 | $1.11 | 22d | 8 | 0.93mi |
| 1909 Plantation Ct Evansville, IN | 2.0 | 1.0 | 780 | $700 | $0.90 | 22d | 2 | 0.97mi |
| 3700 Justus Ct Evansville, IN | 1.0–2.0 | 1.0–2.0 | 790 | $975 | $1.23 | 22d | 1 | 1.08mi |
| 2340 Sunburst Blvd Unit 2200-202 Evansville, IN | 3.0 | 1.0 | 973 | $1,050 | $1.08 | 22d | 1 | 1.13mi |
| 2340 Sunburst Blvd Unit 2270-318 Evansville, IN | 2.0 | 1.0 | 815 | $900 | $1.10 | 22d | 1 | 1.13mi |
| 1604 Marbo Ave Evansville, IN | 2.0 | 1.0 | 900 | $1,095 | $1.22 | 22d | 1 | 1.14mi |
| 1320 Lee Ct Evansville, IN | 1.0–4.0 | 1.0–1.5 | 1007 | $1,266 | $1.26 | 15d | 36 | 1.15mi |
| 1411 Jeanette Ave Unit 1411 Evansville, IN | 3.0 | 1.5 | 1210 | $1,195 | $0.99 | 22d | 1 | 1.17mi |
| 1621 Burdette Ave Evansville, IN | 2.0 | 1.0 | 720 | $1,050 | $1.46 | 22d | 1 | 1.17mi |
| 1909 Taylor Ave Evansville, IN | 2.0 | 1.0 | 700 | $1,200 | $1.71 | 15d | 1 | 1.32mi |
| 4689 Covert Ave Unit 4629 Evansville, IN | 2.0 | 1.0 | 725 | $775 | $1.07 | 15d | 1 | 1.38mi |
| 900 S Saint James Blvd Evansville, IN | 3.0 | 2.0 | 1118 | $1,450 | $1.30 | 22d | 1 | 1.47mi |
| 1165 Shiloh Sq Evansville, IN | 1.0–2.0 | 1.0–2.0 | 907 | $1,145 | $1.26 | 15d | 15 | 1.48mi |
Listing history 16 events
-
2026-06-22days on market $145,000 Active 67 DOM
-
2026-06-18days on market $145,000 Active 64 DOM
-
2026-06-17days on market $145,000 Active 63 DOM
-
2026-06-16days on market $145,000 Active 62 DOM
-
2026-06-15days on market $145,000 Active 61 DOM
-
2026-06-14days on market $145,000 Active 59 DOM
-
2026-06-13days on market $145,000 Active 58 DOM
-
2026-06-10days on market $145,000 Active 56 DOM
-
2026-06-09days on market $145,000 Active 55 DOM
-
2026-06-08pricedays on market $145,000 Active 54 DOM
-
2026-06-07days on market $150,000 Active 53 DOM
-
2026-06-02days on market $150,000 Active 48 DOM
-
2026-06-01days on market $150,000 Active 47 DOM
-
2026-05-31days on market $150,000 Active 46 DOM
-
2026-05-30days on market $150,000 Active 45 DOM
-
2026-04-15$150,000 Active
ⓘ Source: listings_history table (triggers on properties + properties_extension) + one-shot
backfill from property_details.listing_events for pre-trigger history.
Tax reassessment forecast IN · Partial reset (capped growth)
- Current annual tax
- $1,737 · $145/mo
- Projected year-2 tax
- $1,737 · $145/mo
- Expected delta
- $0/yr ($0/mo · 0.0%)
ⓘ Screening estimate from a state-policy table — verify with the county assessor before closing.
Climate risk First Street
- Flood 4/10 Moderate FEMA zone X · 22% chance over 30 yrs
- Wildfire 3/10 Moderate
- Heat 5/10 Major 7 d/yr ≥107°F today · 19 d/yr by 30 yrs out
- Wind 2/10 Low 3% chance of damaging wind over 30 yrs
- Air quality 3/10 Moderate 3 unhealthy d/yr today · 4 by 30 yrs out
Nearby sold comps map
Loading sold comps map…
Walkable amenities ~0.75 mi
Loading nearby amenities…
Taxation est. · year 1
- Rental income
- $14,641
- − Mortgage interest
- −$8,122
- − Property taxes
- −$1,737
- − Insurance
- −$725
- − Repairs & maintenance
- −$1,171
- − Management
- −$1,171
- − Depreciation
- −$4,218
- Taxable loss
- −$2,504
- Est. tax savings @ 24.0%
- +$601
- After-tax cash flow
- $581/yr
For passive investors: Depreciation is non-cash, so a rental often shows a tax loss while cash-flowing — sheltering income. Rental losses are passive: they offset passive income freely, and up to $25,000/yr can offset ordinary (W-2) income if you actively participate and your MAGI is under $100k (phasing out to $0 by $150k); unused losses carry forward. On sale, claimed depreciation is recaptured at up to 25%, and gains may owe capital-gains tax (a 1031 exchange can defer both). Figures are a year-1 estimate at your 24.0% rate — not tax advice; consult a CPA.
Schools (NCES district)
- District
- Evansville Vanderburgh School Corporation
- NCES district ID
- 1803450
- Math proficiency
- 36% ▼ -7.00%
- Reading proficiency
- 43% ▼ -3.00%
- Median HH income
- $43,270
- Composite
- 33.41/100
- National rank
- #5471
- State rank
- #153 of 301 in IN
Livability — Evansville
- Score
- 63/100
- State rank
- #416
- US rank
- #15047
Category grades
Schools grade is shown separately in the Schools card above.
Census & demographics
- Census place
- Evansville, IN
- County
- Vanderburgh County · 146,793 people
- City population
- 146,793
- Metro
- Evansville, IN-KY
- Population (ZIP)
- 32,132
- Household income
- $55,910
- Rent vs Own
- Severe rent burden
- 1394.0
Population outlook (Vanderburgh County) Hauer SSP2
- Today (2025)
- 187,038 people
- By 2030
- 188,907 · +1.0%
- By 2040
- 190,272 · +1.7%
- By 2050
- 188,871 · +1.0%
- By 2075
- 180,751 · -3.4%
- By 2100
- 163,015 · -12.8%
Race, ethnicity, and origin ACS 2023
- Neighborhood character
- Predominantly White (71%)
- Race & ethnicity
- White 71% Black 17% Two or more races 6% Hispanic / Latino 6% Asian 1%
- Hispanic origin (detail)
- Mexican 3%
- Common ancestry
- Italian 3% Lithuanian 2% Slovak 1%
- Foreign-born
- 6% · Canada, China
- Languages at home
- 92% English-only · Spanish 4% Other Asian/Pacific 1% French/Haitian/Cajun 1%
Political lean MEDSL · Vanderburgh
- 2024 margin
- R (+12.7) · D 43.0% · R 55.6% · Other 1.4%
- 2008→2024 swing
- -15.1pp toward R · 2008: 2.5pp · 2024: -12.7pp
- All cycles
- 2024: R+12.7 2020: R+9.6 2016: R+16.9 2012: R+10.8 2008: D+2.5
Not yet ingested
- Civics
- —
Market trends
- HPI YoY
- ▼ -124.80%
- Current HPI
- 211.1755
- Rent YoY
- ▲ 7.86%
- Metro
- Evansville, IN-KY
- State GDP YoY
- ▲ 2.90%
- F500 in state
- 18
Industry mix (Fortune 500 HQ in IN)
| Industry | F500 HQs | Revenue |
|---|---|---|
| Industrial Machinery | 2 | $37B |
|
||
| Healthcare | 1 | $177B |
|
||
| Pharmaceuticals | 1 | $45B |
|
||
| Metals / Steel | 1 | $18B |
|
||
| Agriculture | 1 | $17B |
|
||
| Packaging | 1 | $12B |
|
||
Price history
1 event — show timeline
- 2026-04-15 Listed $150,000 IRMLS
Property tax history
-1.0%/yrLatest (2024): $1,737 · +14.8% YoY. Source: county tax records.
Cash-flow waterfall
monthlySold comps — $/sqft
last 12 mo · ≤1 miLoading sold comps…