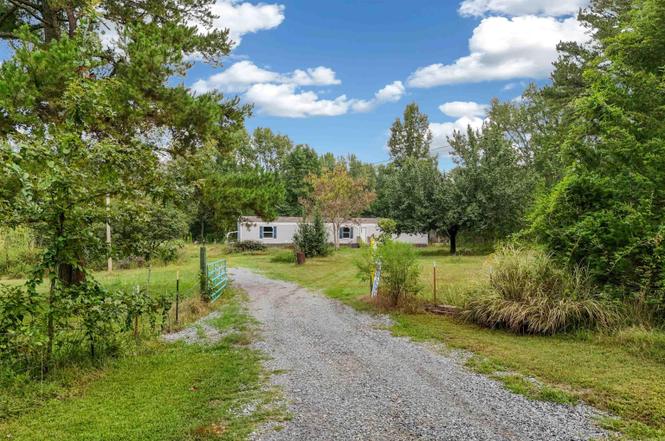
248 Rocky Point Rd · Vilonia, AR
Flood risk 1/10 · Minimal
- FEMA flood zone
- X (unshaded)
- Chance of flooding over 30 yrs
- 0.0%
- Est. flood insurance / yr
- $507 – $1,088
Fire risk 6/10 · Moderate
- Est. fire insurance / yr
- $1,499 – $2,785
Heat risk 6/10 · Moderate
- Hot days now (above 110°F)
- 7 days/yr
- Hot days in 30 yrs
- 19 days/yr
Wind risk 3/10 · Minor
- Chance of severe wind over 30 yrs
- 7.0%
Air-quality risk 2/10 · Minimal
- Unhealthy air days now
- 1 days/yr
- Unhealthy air days in 30 yrs
- 1 days/yr
Risk factors via First Street. Map © Google.
Why this score? — see what drove the D grade
The composite is a weighted blend of 9 inputs, each scored 0–100. Each bar is that input's sub-score; the figure is the points it added to the 100-point composite (weight × sub-score).
- Cash flow +11.1/30.0
- Appreciation +10.0/10.0
- ARV discount +6.2/15.0
- Schools +4.1/10.0
- Livability +3.4/5.0
- DSCR +3.2/10.0
- Rent growth +2.5/5.0
- Condition / age +2.5/5.0
- 1% rule +1.9/10.0
$185,000
🖨 Deal sheet (PDF) 📄 Offer letter ✓ Due diligence
Listing remarks
3-year-old immaculately maintained single wide mobile home on a level nearly 4-acre lot in the Vilonia countryside. Gated driveway and the home sits back off the road with plenty of room for a shop, pool, and large backyard gatherings.
Key facts
- Room for a shop
- Gated driveway
- 3.79 acre lot
Tags
Property features AI
Finance
- Other: Approximately 3.79 acres; Lot dimensions roughly 390 x 420; Approximate living area sourced from tax records
- Financial info: Financing options: VA, FHA, Conventional loans or Cash
Exterior
- Utilities: Public water; Septic system; Electric service (municipal/Entergy); Cable TV, Antenna TV, Satellite TV; Private telephone service; Insulated windows; Internet: cellular, fiber, satellite, wireless
- Home design: Single-wide mobile home; Metal/vinyl siding; Paved road access; Entry on main level
- Construction: Architectural shingle roof; Crawl space foundation
- Exterior features: Deck; Fully fenced yard; Level lot
Interior
- Kitchen: Built-in stove; Microwave
- Flooring: Luxury vinyl
- Bathrooms: 2 full bathrooms
- Heating & cooling: Central electric heat; Central electric cooling
- Interior features: Sheetrock walls and ceilings; Luxury vinyl flooring; Laundry room
- Laundry & utility: Laundry area (room)
Neighborhood map
What this means for you Summary
Snapshot
- This is a 3-bed/2.0-bath manufactured listed at $185k.
Deal economics
- At list price, monthly cash flow is $-74 ($-893/yr) — negative.
- To cash-flow at today's rent, offer at most $172k (7.1% below list).
- To meet the 1% rule (rent ≥ 1% of price), the offer needs to be $128k (31.1% below list).
- Recommended offer: $128k (31.1% below list) — sets the bar for 1% rule.
- Cap rate 5.8% vs local median 3.4% in Vilonia — top-decile yield for the area; either an underpriced asset or a hidden risk that comps aren't pricing in. Stress-test before assuming the spread holds.
Location & tenants
- Location reads 67/100 on livability (#108 in AR) — a middle-class / working-renter tenant base. Strengths: crime A+, employment A+, cost of living A+; Watch: amenities F, commute F, health & safety F.
- Vilonia School District (rural): math 46% / reading 47% proficiency, ranked #23 of 238 in AR (top 10%) — families likely to look elsewhere, expect single-tenant / working-renter base with shorter leases.
- Zoned schools: Vilonia Elementary School (math 57% / reading 42%, grade D, #93 of 454 statewide, top 23%, 571 students, 46% FRL); Frank Mitchell Intermediate School (math 46% / reading 49%, grade C-, #42 of 201 statewide, top 22%, 654 students, 45% FRL); Vilonia High School (math 32% / reading 49%, grade F, #45 of 292 statewide, top 15%, 859 students, 34% FRL).
- Market conditions: 105 active listings in the ZIP; 865 units permitted in Faulkner County in 2024 (451 in 5+ unit buildings).
Forward outlook
- In year one you build about $20k of equity ($1k loan paydown + $18k appreciation (10.0% local appreciation)).
- Faulkner County population projected at +32% by 2050 — long-run rental-demand tailwind backs the buy-and-hold thesis.
- At projected returns (10.0% appreciation + 3.0% rent growth), your $52k cash investment doubles in ~3 years — after that, you're playing with house money.
- By year 2, paydown + projected appreciation supports a ~$32k cash-out refi (75% LTV) — recoverable capital for the next deal without selling this one.
Negotiation context
- It's been on market 223 days — a 12% lower offer ($163k) is reasonable based on typical stale-listing flexibility.
- 3 sale attempts since 4y ago; this cycle's ask has dropped $10k (5%) from the opening price — seller is motivated, your offer sets the floor, not the list.
Risks & watch-outs
- Climate carrying-cost: major wildfire risk; extreme-heat days projected 7→19/yr by 2055 (HVAC capex compounding) — expect insurance premiums to compound above CPI over the hold.
Questions for the listing agent
- What do current leases actually rent for vs. the listed asking? Can we see a recent rent roll and the last 12 months of T-12 income?
- It's been on market 223 days. Have you received any prior offers? Is the seller open to a 31% concession, seller financing, or rate buy-down credit?
- Why hasn't it sold? Are there any deal-killer items the seller is aware of (foundation, flood, title, zoning, code violations)?
- Is there a deadline driving the sale (1031 exchange, divorce, estate, relocation)? That informs how much negotiation room exists.
- Schools are B-rated — typically a magnet for longer-tenancy family renters. What's the average tenant stay here, and is there a school-zone premium baked into asking?
- The area grade is low — what's the realistic commute time and amenity access for the typical tenant pool here? Any planned neighborhood developments (good or bad) we should know about?
- What's the average days-on-market for RENTAL listings here right now (not sales)? A rising rental-DOM trend means longer vacancies and softer asking-rent achievability than the comps imply.
- What's the recent tenant-quality profile in this submarket — average credit score on applications, eviction rate, late-payment / NSF rate, and stable-employment percentage? A property-management company in the area should have these aggregated.
- How much new for-sale + rental construction is in the pipeline within 1–3 miles? Heavy new supply typically softens prices + rents 12–24 months out; constrained supply supports both.
Investment metrics
- 1% rule
- 0.69% ✗
- Cap rate
- 5.81%
- Cash-on-cash
- -1.72%
- DSCR
- 0.92
- GRM
- 12.1
CMA / ARV
- ARV (on-the-fly)
- $179,712
- Comps found
- 1
Show comp detail 1 sale within ~0.75 mi
| Address | Dist | Beds/Ba | Sqft | Sold | Price | $/sf | Match |
|---|---|---|---|---|---|---|---|
| 248 Rocky Point Rd | 0.00mi | 3/2.0 | 1,152 (0%) | 1mo | $180,000 | $156 | 99 |
Match score weights: distance 35% · size 25% · config 20% · recency 20%. Top-matched comps best support the ARV.
Projected returns pro-forma
10.0% appreciation · 3.0% rent growth · sell at horizon
- IRR
- 23.0%
- Equity multiple
- 2.85×
- Total profit
- $95,913
- Equity at exit
- $166,663
- IRR
- 20.5%
- Equity multiple
- 6.52×
- Total profit
- $285,975
- Equity at exit
- $359,414
Cash invested: $51,800 (down + closing). Projections, not guarantees.
Landlord ↔ Tenant lean methodology
- Overall (STATE)
- 92 Strongly Landlord-Friendly
- State Arkansas
- 92 Strongly Landlord-Friendly · R+14
- County
- — inherits STATE
- City
- — inherits STATE
ZIP-level market 72173
- Home prices YoY
- 8.0%
- Active inventory
- 105
- Price-to-rent
- 12.1×
Monthly cashflow live
- Estimated rent
- $1,275 medium interval (Pro) →
- Mortgage (P&I)
- −$970
- Tax from tax record
- −$35 /mo · $416/yr
- Insurance
- −$77
- HOA
- −$0
- Lot rent leased land?
- −$0
- Vacancy / Maint / Mgmt
- −$268
- Net cashflow
- $-74
Break-even live
Sensitivity live
| Price | -10% $30 | -5% $-22 | +0% $-74 | +5% $-127 | +10% $-179 |
|---|---|---|---|---|---|
| Rent | -10% $-175 | -5% $-125 | +0% $-74 | +5% $-24 | +10% $26 |
| Rate | -1.0pp $19 | -0.5pp $-27 | base $-74 | +0.5pp $-122 | +1.0pp $-171 |
UW: 25.0% down · 7.5% · 30yr · 1.5% tax · 5.0% vac · 8.0% maint · 8.0% mgmt
Financing live
Cash to close
- Down payment
- $46,250
- Closing costs
- $5,550
- Reserves months
- —
- Total cash needed
- —
Loan-product check · same deal, 3 products live
Conventional
25% down · 7.5% · 30yr
- Down + closing
- —
- Monthly P&I
- —
- Monthly cashflow
- —
- DSCR
- —
- Eligible?
- —
Personal DTI + credit; lowest rate.
DSCR
20% down · 8.5% · 30yr
- Down + closing
- —
- Monthly P&I
- —
- Monthly cashflow
- —
- DSCR
- —
- Eligible?
- —
No personal income docs; deal must DSCR.
Hard money
10% down · 12.0% · 12mo
- Down + closing
- —
- Monthly P&I
- —
- Monthly cashflow
- —
- DSCR
- —
- Eligible?
- —
Short-term bridge; refi at stabilization.
Listing history 10 events
-
2026-04-23status Under Contract
-
2026-03-01price $185,000
-
2026-02-23status Price Change
-
2026-02-20historical Take Backups
-
2025-12-02price $190,000
-
2025-09-13$195,000 New Listing
-
2022-03-09historical
-
2022-03-01price $89,900
-
2022-02-09price $99,900
-
2022-01-27$125,900 New Listing
ⓘ Source: listings_history table (triggers on properties + properties_extension) + one-shot
backfill from property_details.listing_events for pre-trigger history.
Tax reassessment forecast AR · Resets to sale price
- Current annual tax
- $416 · $35/mo
- Projected year-2 tax
- $1,184 · $99/mo
- Expected delta
- +$768/yr (+$64/mo · 184.5%)
ⓘ Screening estimate from a state-policy table — verify with the county assessor before closing.
Climate risk First Street
- Flood 1/10 Low FEMA zone X (unshaded) · 0% chance over 30 yrs
- Wildfire 6/10 Major
- Heat 6/10 Major 7 d/yr ≥110°F today · 19 d/yr by 30 yrs out
- Wind 3/10 Moderate 7% chance of damaging wind over 30 yrs
- Air quality 2/10 Low 1 unhealthy d/yr today · 1 by 30 yrs out
Nearby sold comps map
Loading sold comps map…
Walkable amenities ~0.75 mi
Loading nearby amenities…
Taxation est. · year 1
- Rental income
- $15,304
- − Mortgage interest
- −$10,363
- − Property taxes
- −$416
- − Insurance
- −$925
- − Repairs & maintenance
- −$1,224
- − Management
- −$1,224
- − Depreciation
- −$5,382
- Taxable loss
- −$4,231
- Est. tax savings @ 24.0%
- +$1,015
- After-tax cash flow
- $122/yr
For passive investors: Depreciation is non-cash, so a rental often shows a tax loss while cash-flowing — sheltering income. Rental losses are passive: they offset passive income freely, and up to $25,000/yr can offset ordinary (W-2) income if you actively participate and your MAGI is under $100k (phasing out to $0 by $150k); unused losses carry forward. On sale, claimed depreciation is recaptured at up to 25%, and gains may owe capital-gains tax (a 1031 exchange can defer both). Figures are a year-1 estimate at your 24.0% rate — not tax advice; consult a CPA.
Schools (NCES district)
- District
- Vilonia School District
- NCES district ID
- 0513530
- Math proficiency
- 46% ▼ -11.00%
- Reading proficiency
- 47% ▼ -4.00%
- Median HH income
- $57,913
- Composite
- 40.64/100
- National rank
- #3681
- State rank
- #23 of 238 in AR
Livability — Vilonia
- Score
- 67/100
- State rank
- #108
- US rank
- #10836
Category grades
Schools grade is shown separately in the Schools card above.
Census & demographics
- Population (ZIP)
- 10,122
Population outlook (Faulkner County) Hauer SSP2
- Today (2025)
- 138,985 people
- By 2030
- 148,264 · +6.7%
- By 2040
- 166,010 · +19.4%
- By 2050
- 183,362 · +31.9%
- By 2075
- 224,593 · +61.6%
- By 2100
- 250,603 · +80.3%
Race, ethnicity, and origin ACS 2023
- Neighborhood character
- Predominantly White (92%)
- Race & ethnicity
- White 92% Hispanic / Latino 4% Two or more races 3%
- Common ancestry
- Slovak 2% Scotch-Irish 2% Italian 1%
- Foreign-born
- 1% · Canada
- Languages at home
- 96% English-only · Spanish 3%
Political lean MEDSL · Faulkner
- 2024 margin
- Solid R (+32.3) · D 32.6% · R 64.9% · Other 2.5%
- 2008→2024 swing
- -7.1pp toward R · 2008: -25.3pp · 2024: -32.3pp
- All cycles
- 2024: R+32.3 2020: R+29.5 2016: R+31.6 2012: R+31.7 2008: R+25.3
Not yet ingested
- Civics
- —
Market trends
- HPI YoY
- ▲ 22.08%
- Current HPI
- 298.3398
- Rent YoY
- —
- Metro
- —
- State GDP YoY
- ▲ 3.80%
- F500 in state
- 10
Industry mix (Fortune 500 HQ in AR)
| Industry | F500 HQs | Revenue |
|---|---|---|
| Retail | 1 | $681B |
|
||
| Food / Agriculture | 1 | $53B |
|
||
| Retail / Energy | 1 | $22B |
|
||
| Transportation / Logistics | 1 | $12B |
|
||
| Energy | 1 | $4B |
|
||
Price history
+46.9% since first listed10 events — show timeline
- 2026-04-23 Pending — CARMLS
- 2026-03-01 Price Changed $185,000 CARMLS
- 2026-02-23 Relisted — CARMLS
- 2026-02-20 Contingent — CARMLS
- 2025-12-02 Price Changed $190,000 CARMLS
- 2025-09-13 Listed $195,000 CARMLS
- 2022-03-09 Listing Removed — CARMLS
- 2022-03-01 Price Changed $89,900 CARMLS
- 2022-02-09 Price Changed $99,900 CARMLS
- 2022-01-27 Listed $125,900 CARMLS
Property tax history
+8.1%/yrLatest (2025): $416 · +8.0% YoY. Source: county tax records.
Cash-flow waterfall
monthlySold comps — $/sqft
last 12 mo · ≤1 miLoading sold comps…