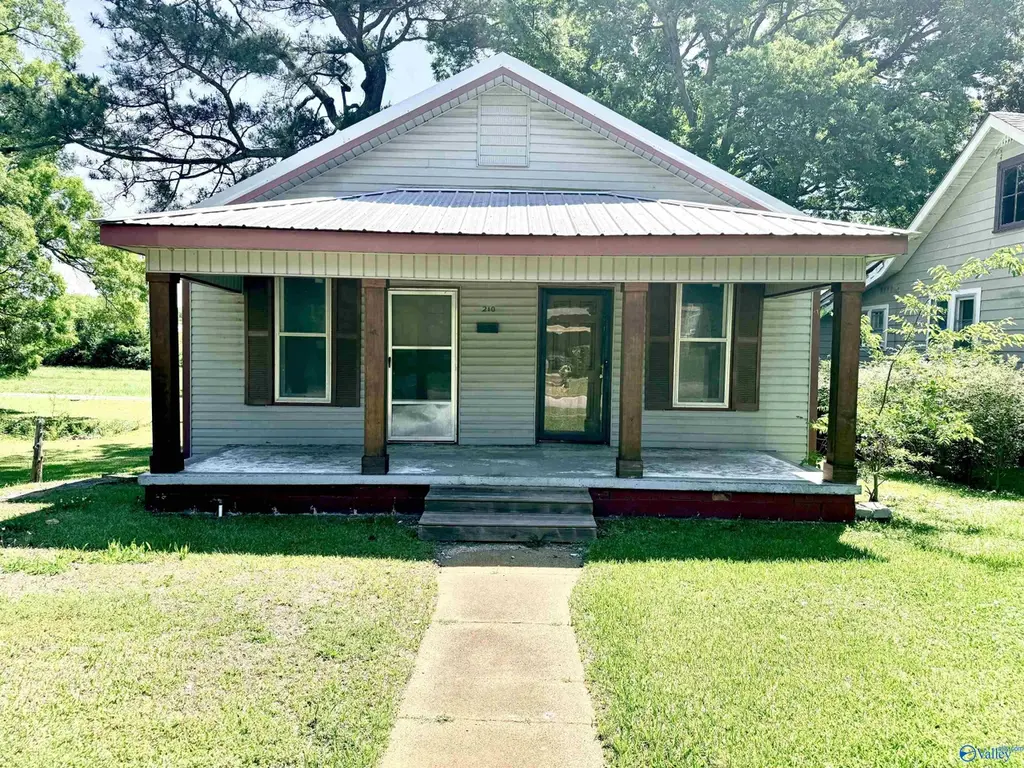
210 4th Ave NW · Decatur, AL
Flood risk 9/10 · Severe
- FEMA flood zone
- X (unshaded)
- Chance of flooding over 30 yrs
- 0.99%
- Est. flood insurance / yr
- $507 – $1,088
Fire risk 1/10 · Minimal
- Est. fire insurance / yr
- $916 – $1,700
Heat risk 6/10 · Moderate
- Hot days now (above 106°F)
- 7 days/yr
- Hot days in 30 yrs
- 19 days/yr
Wind risk 4/10 · Minor
- Chance of severe wind over 30 yrs
- 19.0%
Air-quality risk 2/10 · Minimal
- Unhealthy air days now
- 1 days/yr
- Unhealthy air days in 30 yrs
- 1 days/yr
Risk factors via First Street. Map © Google.
Why this score? — see what drove the C grade
The composite is a weighted blend of 9 inputs, each scored 0–100. Each bar is that input's sub-score; the figure is the points it added to the 100-point composite (weight × sub-score).
- Cash flow +21.8/30.0
- ARV discount +11.1/15.0
- DSCR +7.0/10.0
- 1% rule +4.5/10.0
- Rent growth +3.7/5.0
- Livability +3.6/5.0
- Schools +2.6/10.0
- Condition / age +2.5/5.0
- Appreciation +0.0/10.0
$130,000
🖨 Deal sheet (PDF) 📄 Offer letter ✓ Due diligence
Listing remarks
CHARMING AND THOUGHTFULLY UPDATED 2BDR/1BA HOME BLENDING CHARACTER WITH MAJOR MODERN UPGRADES! RECENT IMPROVEMENTS INCLUDE FOUNDATION LEVELING, NEW PLUMBING, UPDATED ELECTRICAL PANEL, NEW WINDOWS THROUGHOUT, HIGH EFFICIENCY CENTRAL HVAC, MOLD REMEDIATION, AND ROOF REPLACED IN 2021. 2 BONUS ROOMS ON OPPOSITE SIDES. RENOVATED KITCHEN, FRESH PAINT, UPDATED FLOORING, RENOVATED FRONT PORCH AND NEW BACK PORCH WITH STEPS. MOVE IN READY INCLUDES A LIVING RM DINING RM BONUS RM PERFECT FOR OFFICE OR PLAYROOM. 2 SIDED BASEMENT AND 2 ENCLOSED FIREPLACES THAT CAN POTENTIALLY BE RE-OPENED. REAR ALLEY ACCESS AND PARKING. MINUTES FROM DOWNTOWN DECATUR
Key facts
- Foundation leveling
- New plumbing
- Mold remediation
Tags
Property features AI
Finance
- HOA & community: No HOA
Exterior
- Parking: Alley access; Dirt driveway
- Utilities: Public water; Public sewer; Electric service for heating and cooling
- Home design: Single-family residence; Residential property; Living area approximately 1,296; Not new construction; Subdivision: Jarvis
- Construction: Has a basement; Two fireplaces
- Exterior features: Public water; Public sewer; Lot on approximately 0.16 acres
Interior
- Bedrooms: 6 total rooms (includes bedrooms and living spaces)
- Bathrooms: 1 full bathroom
- Heating & cooling: Central electric heating; Central electric cooling
- Interior features: Basement; Two fireplaces
Neighborhood map
What this means for you Summary
Snapshot
- This is a 2-bed/1.0-bath single-family listed at $130k.
Deal economics
- At list price, monthly cash flow is $136 ($2k/yr) — positive.
- The deal already cash-flows at list — no discount required.
- To meet the 1% rule (rent ≥ 1% of price), the offer needs to be $123k (5.1% below list).
- Recommended offer: $123k (5.1% below list) — sets the bar for 1% rule.
- Cap rate 8.2% vs local median 4.0% in Decatur — top-decile yield for the area; either an underpriced asset or a hidden risk that comps aren't pricing in. Stress-test before assuming the spread holds.
Location & tenants
- Location reads 72/100 on livability (#28 in AL) — a middle-class / working-renter tenant base. Strengths: cost of living A+, housing A+, health & safety A+; Watch: employment D+, crime F, amenities F.
- Decatur City (urban): math 22% / reading 40% proficiency, ranked #66 of 129 in AL (top 51%) — families likely to look elsewhere, expect single-tenant / working-renter base with shorter leases.
- Zoned schools: Bankscaddell Elementary School (math 16% / reading 30%, grade F, #431 of 627 statewide, top 69%, 453 students, 88% FRL); Decatur Middle School (math 17% / reading 36%, grade F, #150 of 257 statewide, top 60%, 815 students, 77% FRL); Decatur High School (math 27% / reading 27%, grade F, #90 of 305 statewide, top 35%, 1,040 students, 67% FRL) — zoned schools average 77% FRL vs 57% district-wide (21 pts higher); higher-poverty schools than district average — tighter screening recommended.
- Market conditions: Rents rising fast (+4.7%/yr); 225 active listings in the ZIP; 15 comparable units currently listed for rent nearby; rentals lingering (median 46d on market — plan ~5-8 weeks vacancy on turnover, expect pricing pressure); 60% of comp listings sitting > 30 days — soft ceiling on asking rent; 231 units permitted in Morgan County in 2024 (0 in 5+ unit buildings).
Forward outlook
- Local home prices are declining (-3.0%/yr); year-one equity from $899 of loan paydown is wiped out by about $4k of value loss. Plan a longer hold.
- Morgan County population projected at -11% by 2050 — secular population decline; favor cash flow + early exit over multi-decade hold.
Negotiation context
- It's been on market 42 days — a 3% lower offer ($126k) is reasonable based on typical stale-listing flexibility.
- 2 sale attempts; this cycle's ask has dropped $10k (7%) from the opening price — seller is motivated, your offer sets the floor, not the list.
Risks & watch-outs
- Watch-outs: flood insurance adds $66/mo; built in 1944 — expect roof / HVAC / electrical / plumbing capex.
- Climate carrying-cost: severe flood risk; extreme-heat days projected 7→19/yr by 2055 (HVAC capex compounding) — expect insurance premiums to compound above CPI over the hold.
Questions for the listing agent
- It's been on market 42 days. Have you received any prior offers? Is the seller open to a 5% concession, seller financing, or rate buy-down credit?
- Built in 1944 — when were the roof, HVAC, electrical panel, plumbing, and water heater last replaced?
- What's the actual annual flood-insurance premium (NFIP or private), and is the property in a SFHA with mandatory coverage?
- Is there a deadline driving the sale (1031 exchange, divorce, estate, relocation)? That informs how much negotiation room exists.
- Crime grade is F in this area — have there been break-ins, vandalism, or insurance claims at this property in the last 3 years? What carrier currently insures it and at what premium?
- What's the average days-on-market for RENTAL listings here right now (not sales)? A rising rental-DOM trend means longer vacancies and softer asking-rent achievability than the comps imply.
- What's the recent tenant-quality profile in this submarket — average credit score on applications, eviction rate, late-payment / NSF rate, and stable-employment percentage? A property-management company in the area should have these aggregated.
- How much new for-sale + rental construction is in the pipeline within 1–3 miles? Heavy new supply typically softens prices + rents 12–24 months out; constrained supply supports both.
Investment metrics
- 1% rule
- 0.95% ✗
- Cap rate
- 8.16%
- Cash-on-cash
- 6.67%
- DSCR
- 1.30
- GRM
- 8.8
CMA / ARV
- ARV (median comp)
- $141,142
- List price
- $130,000
- Delta
- -7.89%
- Verdict
- FAIR
- Comps
- 20 within 1.0 mi
Show comp detail 12 sales within ~0.75 mi
| Address | Dist | Beds/Ba | Sqft | Sold | Price | $/sf | Match |
|---|---|---|---|---|---|---|---|
| 310 6th Ave NW | 0.19mi | 3/1.5 (+1) | 1,377 (+6%) | 7mo | $164,000 | $119 | 68 |
| 207 Cain St NE | 0.43mi | 2/2.0 | 1,234 (-5%) | 1mo | $80,000 | $65 | 67 |
| 107 8th Ave NW | 0.34mi | 3/2.0 (+1) | 1,344 (+4%) | 8mo | $215,000 | $160 | 62 |
| 207 7th Ave SW | 0.32mi | 3/1.0 (+1) | 1,404 (+8%) | 8mo | $120,200 | $86 | 59 |
| 609 7th Ave SW | 0.52mi | 3/1.5 (+1) | 1,250 (-4%) | 5mo | $98,000 | $78 | 58 |
| 201 10th Ave NW | 0.47mi | 3/1.5 (+1) | 1,320 (+2%) | 12mo | $90,000 | $68 | 58 |
| 211 Prospect Dr SE | 0.73mi | 2/1.5 | 1,330 (+3%) | 3mo | $160,000 | $120 | 57 |
| 611 SW 3rd Ave | 0.47mi | 3/1.0 (+1) | 1,238 (-4%) | 12mo | $65,000 | $53 | 56 |
| 508 Cherry St NW | 0.64mi | 3/2.0 (+1) | 1,396 (+8%) | 2mo | $219,000 | $157 | 46 |
| 423 7th Ave NW | 0.40mi | 2/1.5 | 1,122 (-13%) | 14mo | $167,900 | $150 | 45 |
| 216 Cain St | 0.46mi | 3/2.0 (+1) | 1,450 (+12%) | 8mo | $239,000 | $165 | 43 |
| 615 Oak St NE | 0.57mi | 2/2.0 | 1,421 (+10%) | 13mo | $242,912 | $171 | 42 |
Match score weights: distance 35% · size 25% · config 20% · recency 20%. Top-matched comps best support the ARV.
Projected returns pro-forma
-3.0% appreciation · 4.67% rent growth · sell at horizon
- IRR
- -7.6%
- Equity multiple
- 0.72×
- Total profit
- $-10,324
- Equity at exit
- $19,383
- IRR
- 3.9%
- Equity multiple
- 1.30×
- Total profit
- $11,025
- Equity at exit
- $11,240
Cash invested: $36,400 (down + closing). Projections, not guarantees.
Landlord ↔ Tenant lean methodology
- Overall (STATE)
- 90 Strongly Landlord-Friendly
- State Alabama
- 90 Strongly Landlord-Friendly · R+15
- County
- — inherits STATE
- City
- — inherits STATE
ZIP-level market 35601
- Home prices YoY
- -26.5%
- Rents YoY
- 4.7%
- Active inventory
- 225
- Price-to-rent
- 8.8×
Monthly cashflow live
- Estimated rent
- $1,233 high interval (Pro) →
- Mortgage (P&I)
- −$682
- Tax from tax record
- −$36 /mo · $435/yr
- Insurance
- −$54
- Flood insurance flood zone
- −$66 /mo · $798/yr
- HOA
- −$0
- Vacancy / Maint / Mgmt
- −$259
- Net cashflow
- $136
Break-even live
Sensitivity live
| Price | -10% $209 | -5% $173 | +0% $136 | +5% $99 | +10% $62 |
|---|---|---|---|---|---|
| Rent | -10% $38 | -5% $87 | +0% $136 | +5% $185 | +10% $233 |
| Rate | -1.0pp $201 | -0.5pp $169 | base $136 | +0.5pp $102 | +1.0pp $68 |
UW: 25.0% down · 7.5% · 30yr · 1.5% tax · 5.0% vac · 8.0% maint · 8.0% mgmt
Financing live
Cash to close
- Down payment
- $32,500
- Closing costs
- $3,900
- Reserves months
- —
- Total cash needed
- —
Loan-product check · same deal, 3 products live
Conventional
25% down · 7.5% · 30yr
- Down + closing
- —
- Monthly P&I
- —
- Monthly cashflow
- —
- DSCR
- —
- Eligible?
- —
Personal DTI + credit; lowest rate.
DSCR
20% down · 8.5% · 30yr
- Down + closing
- —
- Monthly P&I
- —
- Monthly cashflow
- —
- DSCR
- —
- Eligible?
- —
No personal income docs; deal must DSCR.
Hard money
10% down · 12.0% · 12mo
- Down + closing
- —
- Monthly P&I
- —
- Monthly cashflow
- —
- DSCR
- —
- Eligible?
- —
Short-term bridge; refi at stabilization.
Rent comps 15 comps
| Address | Beds | Baths | Sqft | Rent | $/sqft | DOM | Units | Dist |
|---|---|---|---|---|---|---|---|---|
| 225 5th Ave NW Decatur, AL | 3.0 | 2.0 | 1496 | $1,300 | $0.87 | 46d | 1 | 0.15mi |
| 220 8th Ave NW Decatur, AL | 3.0 | 1.0 | 973 | $1,125 | $1.16 | 46d | 1 | 0.31mi |
| 14 Walnut St NE Decatur, AL | 3.0 | 2.5 | 1430 | $1,700 | $1.19 | 46d | 1 | 0.54mi |
| 516 Ferry St NE Decatur, AL | 2.0 | 1.0 | 900 | $1,150 | $1.28 | 25d | 1 | 0.58mi |
| 213 Wilson St NE Unit 2 Decatur, AL | 2.0 | 1.0 | 975 | $875 | $0.90 | 25d | 1 | 0.76mi |
| 213 Wilson St NE Unit 4 Decatur, AL | 2.0 | 1.0 | 975 | $700 | $0.72 | 25d | 1 | 0.76mi |
| 1050 Harborview Dr NE Decatur, AL | 1.0–2.0 | 1.0–2.0 | 790 | $1,305 | $1.65 | 16d | 7 | 0.81mi |
| 604 Alma St NW Decatur, AL | 3.0 | 2.0 | 1350 | $1,325 | $0.98 | 23d | 1 | 0.82mi |
| 603 Prospect Dr SE Decatur, AL | 3.0 | 1.0 | 1362 | $1,795 | $1.32 | 46d | 1 | 0.90mi |
| 818 Grant St SE Decatur, AL | 2.0 | 1.0 | 910 | $1,300 | $1.43 | 46d | 1 | 0.91mi |
| 1018 Grant St SE Unit 1018-4 Decatur, AL | 2.0 | 1.0 | 890 | $775 | $0.87 | 46d | 1 | 1.05mi |
| 1018 Grant St SE Unit 1026-4 Decatur, AL | 2.0 | 1.0 | 890 | $800 | $0.90 | 46d | 1 | 1.06mi |
| 315 Hillside Rd SW Decatur, AL | 3.0 | 1.5 | 1344 | $1,400 | $1.04 | 46d | 1 | 1.06mi |
| 102 Elm Ct NE Decatur, AL | 3.0 | 1.0 | 1216 | $1,450 | $1.19 | 25d | 1 | 1.24mi |
| 1504 Faye St SW Decatur, AL | 3.0 | 2.0 | 1200 | $1,450 | $1.21 | 46d | 1 | 1.29mi |
Listing history 22 events
-
2026-06-22days on market $130,000 Active 42 DOM
-
2026-06-21days on market $130,000 Active 41 DOM
-
2026-06-19days on market $130,000 Active 39 DOM
-
2026-06-18days on market $130,000 Active 38 DOM
-
2026-06-17days on market $130,000 Active 37 DOM
-
2026-06-16days on market $130,000 Active 36 DOM
-
2026-06-15days on market $130,000 Active 35 DOM
-
2026-06-14days on market $130,000 Active 33 DOM
-
2026-06-13days on market $130,000 Active 32 DOM
-
2026-06-10days on market $130,000 Active 30 DOM
-
2026-06-09days on market $130,000 Active 29 DOM
-
2026-06-08days on market $130,000 Active 28 DOM
-
2026-06-07days on market $130,000 Active 27 DOM
-
2026-06-05days on market $130,000 Active 24 DOM
-
2026-06-03days on market $130,000 Active 23 DOM
-
2026-06-02days on market $130,000 Active 22 DOM
-
2026-06-01days on market $130,000 Active 21 DOM
-
2026-05-31days on market $130,000 Active 20 DOM
-
2026-05-30days on market $130,000 Active 19 DOM
-
2026-05-11$140,000 Active 643-char remark
-
2026-03-17price $130,000
-
2025-12-19$135,000 Active
ⓘ Source: listings_history table (triggers on properties + properties_extension) + one-shot
backfill from property_details.listing_events for pre-trigger history.
Tax reassessment forecast AL · Resets to sale price
- Current annual tax
- $435 · $36/mo
- Projected year-2 tax
- $533 · $44/mo
- Expected delta
- +$98/yr (+$8/mo · 22.6%)
ⓘ Screening estimate from a state-policy table — verify with the county assessor before closing.
Climate risk First Street
- Flood 9/10 Extreme FEMA zone X (unshaded) · 99% chance over 30 yrs
- Wildfire 1/10 Low
- Heat 6/10 Major 7 d/yr ≥106°F today · 19 d/yr by 30 yrs out
- Wind 4/10 Moderate 19% chance of damaging wind over 30 yrs
- Air quality 2/10 Low 1 unhealthy d/yr today · 1 by 30 yrs out
Nearby sold comps map
Loading sold comps map…
Walkable amenities ~0.75 mi
Loading nearby amenities…
Taxation est. · year 1
- Rental income
- $14,802
- − Mortgage interest
- −$7,282
- − Property taxes
- −$435
- − Insurance
- −$1,448
- − Repairs & maintenance
- −$1,184
- − Management
- −$1,184
- − Depreciation
- −$3,782
- Taxable loss
- −$513
- Est. tax savings @ 24.0%
- +$123
- After-tax cash flow
- $1,753/yr
For passive investors: Depreciation is non-cash, so a rental often shows a tax loss while cash-flowing — sheltering income. Rental losses are passive: they offset passive income freely, and up to $25,000/yr can offset ordinary (W-2) income if you actively participate and your MAGI is under $100k (phasing out to $0 by $150k); unused losses carry forward. On sale, claimed depreciation is recaptured at up to 25%, and gains may owe capital-gains tax (a 1031 exchange can defer both). Figures are a year-1 estimate at your 24.0% rate — not tax advice; consult a CPA.
Schools (NCES district)
- District
- Decatur City
- NCES district ID
- 0101170
- Math proficiency
- 22% ▼ -27.00%
- Reading proficiency
- 40% ▼ -1.00%
- Median HH income
- $42,170
- Composite
- 26.21/100
- National rank
- #7261
- State rank
- #66 of 129 in AL
Livability — Decatur
- Score
- 72/100
- State rank
- #28
- US rank
- #5989
Category grades
Schools grade is shown separately in the Schools card above.
Census & demographics
- Census place
- Decatur, AL
- County
- Morgan County · 67,628 people
- City population
- 67,628
- Metro
- Decatur, AL
- Population (ZIP)
- 35,449
- Household income
- $51,429
- Rent vs Own
- Severe rent burden
- 1386.0
Population outlook (Morgan County) Hauer SSP2
- Today (2025)
- 118,775 people
- By 2030
- 116,979 · -1.5%
- By 2040
- 111,800 · -5.9%
- By 2050
- 105,181 · -11.4%
- By 2075
- 87,736 · -26.1%
- By 2100
- 67,624 · -43.1%
Race, ethnicity, and origin ACS 2023
- Neighborhood character
- Diverse neighborhood (Simpson 0.66)
- Race & ethnicity
- White 47% Hispanic / Latino 24% Black 24% Two or more races 10% Native American 2%
- Hispanic origin (detail)
- Mexican 15% Puerto Rican 2%
- Common ancestry
- Slovak 1% Italian 1% Lithuanian 1%
- Foreign-born
- 10% · Canada
- Languages at home
- 81% English-only · Spanish 18%
Political lean MEDSL · Morgan
- 2024 margin
- Solid R (+52.6) · D 23.2% · R 75.8%
- 2008→2024 swing
- -8.8pp toward R · 2008: -43.8pp · 2024: -52.6pp
- All cycles
- 2024: R+52.6 2020: R+49.2 2016: R+52.4 2012: R+44.5 2008: R+43.8
Not yet ingested
- Civics
- —
Market trends
- HPI YoY
- ▼ -89.26%
- Current HPI
- 247.8437
- Rent YoY
- ▲ 4.67%
- Metro
- Decatur, AL
- State GDP YoY
- ▲ 2.94%
- F500 in state
- 4
Industry mix (Fortune 500 HQ in AL)
| Industry | F500 HQs | Revenue |
|---|---|---|
| Financial Services | 1 | $8B |
|
||
| Healthcare | 1 | $5B |
|
||
Price history
-3.7% since first listed4 events — show timeline
- 2026-05-27 Price Changed $130,000 VMLS
- 2026-05-11 Listed $140,000 VMLS
- 2026-03-17 Price Changed $130,000 VMLS
- 2025-12-19 Listed $135,000 VMLS
Cash-flow waterfall
monthlySold comps — $/sqft
last 12 mo · ≤1 miLoading sold comps…