101 Hilltop Rd · Vine Grove, KY
Flood risk No data
- FEMA flood zone
- —
- Chance of flooding over 30 yrs
- —
- Est. flood insurance / yr
- —
Fire risk No data
- Est. fire insurance / yr
- —
Heat risk No data
- Hot days now (above threshold)
- —
- Hot days in 30 yrs
- —
Wind risk No data
- Chance of severe wind over 30 yrs
- —
Air-quality risk No data
- Unhealthy air days now
- —
- Unhealthy air days in 30 yrs
- —
Risk factors via First Street. Map © Google.
Why this score? — see what drove the D grade
The composite is a weighted blend of 9 inputs, each scored 0–100. Each bar is that input's sub-score; the figure is the points it added to the 100-point composite (weight × sub-score).
- Cash flow +14.8/30.0
- ARV discount +7.5/15.0
- DSCR +4.5/10.0
- Schools +3.8/10.0
- Livability +3.6/5.0
- 1% rule +3.1/10.0
- Rent growth +2.5/5.0
- Condition / age +2.5/5.0
- Appreciation +0.0/10.0
$225,000
🖨 Deal sheet (PDF) 📄 Offer letter ✓ Due diligence
Listing remarks MLS
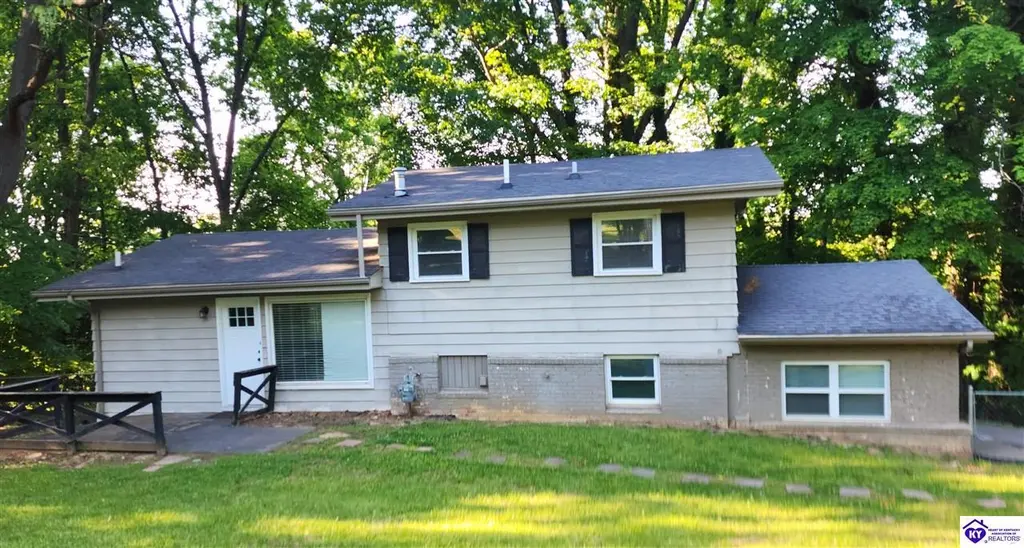
Enjoy scenic park like views from your spacious home, that is beautifully nestled on a private lot! This remodeled home features granite countertops in the kitchen, new carpet & fresh paint! The main level has an oversized master suite with a 1/2 bathroom, 2 additional bedrooms, a full bathroom, living room, dining room and an enclosed heated sun porch! The partially finished walkout basement has a large family room and a flex space that would be great for a possible 4th bedroom, office, toy room or a workout room! Relax on the over-sized covered deck that overlooks the mature trees and take in the best that nature has to offer! Schedule your viewing today!
Key facts
- Remodeled bathroom
- Covered patio
- Spacious lot
Tags
Property features AI
Exterior
- Parking: Attached garage with space for 3 cars
- Security: Smoke detector(s)
- Utilities: Public water; Public sewer
- Home design: Residential farm property
- Construction: Frame and Masonite construction; Shingle roof
- Exterior features: Covered patio; Chain link fencing; Workshop (outbuilding); Corner lot; Wooded lot
Interior
- Kitchen: Dishwasher; Microwave; Range; Oven; Refrigerator
- Flooring: Carpet; Laminate
- Bathrooms: Two full bathrooms; One bathroom on the main level
- Heating & cooling: Central heating (natural gas); Central air conditioning; Ceiling fans
- Interior features: Finished full walk-out basement with exterior entry; Smoke detectors installed
- Laundry & utility: Gas water heater
Neighborhood map
What this means for you Summary
Snapshot
- This is a 3-bed/2.0-bath other listed at $225k.
Deal economics
- At list price, monthly cash flow is $62 ($747/yr) — positive.
- The deal already cash-flows at list — no discount required.
- To meet the 1% rule (rent ≥ 1% of price), the offer needs to be $182k (19.1% below list).
- Recommended offer: $182k (19.1% below list) — sets the bar for 1% rule.
- Cap rate 6.6% vs local median 4.0% in Vine Grove — top-decile yield for the area; either an underpriced asset or a hidden risk that comps aren't pricing in. Stress-test before assuming the spread holds.
Location & tenants
- Location reads 72/100 on livability (#124 in KY) — a middle-class / working-renter tenant base. Strengths: crime A+, cost of living A+, housing A+; Watch: amenities F, commute F, health & safety F.
- Meade County (rural): math 41% / reading 48% proficiency, ranked #21 of 165 in KY (top 13%) — families likely to look elsewhere, expect single-tenant / working-renter base with shorter leases.
- Market conditions: 163 active listings in the ZIP; 124 units permitted in Meade County in 2024 (0 in 5+ unit buildings).
Forward outlook
- Local home prices are declining (-3.0%/yr); year-one equity from $2k of loan paydown is wiped out by about $7k of value loss. Plan a longer hold.
- Meade County population projected at -20% by 2050 — secular population decline; favor cash flow + early exit over multi-decade hold.
Negotiation context
- Only 14 days on market — expect competitive offers; lowballing is unlikely to land.
- 4 sale attempts since 10y ago with the ask held roughly flat each time — persistent listings suggest the price (not the market) is what's stuck; bring a comps-based counter.
Questions for the listing agent
- Built in 1966 — when were the roof, HVAC, electrical panel, plumbing, and water heater last replaced?
- Is there a deadline driving the sale (1031 exchange, divorce, estate, relocation)? That informs how much negotiation room exists.
- The area grade is low — what's the realistic commute time and amenity access for the typical tenant pool here? Any planned neighborhood developments (good or bad) we should know about?
- What's the average days-on-market for RENTAL listings here right now (not sales)? A rising rental-DOM trend means longer vacancies and softer asking-rent achievability than the comps imply.
- What's the recent tenant-quality profile in this submarket — average credit score on applications, eviction rate, late-payment / NSF rate, and stable-employment percentage? A property-management company in the area should have these aggregated.
- How much new for-sale + rental construction is in the pipeline within 1–3 miles? Heavy new supply typically softens prices + rents 12–24 months out; constrained supply supports both.
Investment metrics
- 1% rule
- 0.81% ✗
- Cap rate
- 6.62%
- Cash-on-cash
- 1.19%
- DSCR
- 1.05
- GRM
- 10.3
CMA / ARV
No comps found within radius.
Projected returns pro-forma
-3.0% appreciation · 3.0% rent growth · sell at horizon
- IRR
- -14.5%
- Equity multiple
- 0.48×
- Total profit
- $-32,578
- Equity at exit
- $33,548
- IRR
- -5.8%
- Equity multiple
- 0.63×
- Total profit
- $-23,598
- Equity at exit
- $19,454
Cash invested: $63,000 (down + closing). Projections, not guarantees.
Landlord ↔ Tenant lean methodology
- Overall (STATE)
- 83 Strongly Landlord-Friendly
- State Kentucky
- 83 Strongly Landlord-Friendly · R+16
- County
- — inherits STATE
- City
- — inherits STATE
ZIP-level market 40175
- Home prices YoY
- -6.3%
- Active inventory
- 163
- Price-to-rent
- 10.3×
Monthly cashflow live
- Estimated rent
- $1,821 medium interval (Pro) →
- Mortgage (P&I)
- −$1,180
- Tax from tax record
- −$103 /mo · $1,232/yr
- Insurance
- −$94
- HOA
- −$0
- Vacancy / Maint / Mgmt
- −$382
- Net cashflow
- $62
Break-even live
Sensitivity live
| Price | -10% $190 | -5% $126 | +0% $62 | +5% $-1 | +10% $-65 |
|---|---|---|---|---|---|
| Rent | -10% $-82 | -5% $-10 | +0% $62 | +5% $134 | +10% $206 |
| Rate | -1.0pp $176 | -0.5pp $119 | base $62 | +0.5pp $4 | +1.0pp $-55 |
UW: 25.0% down · 7.5% · 30yr · 1.5% tax · 5.0% vac · 8.0% maint · 8.0% mgmt
Financing live
Cash to close
- Down payment
- $56,250
- Closing costs
- $6,750
- Reserves months
- —
- Total cash needed
- —
Loan-product check · same deal, 3 products live
Conventional
25% down · 7.5% · 30yr
- Down + closing
- —
- Monthly P&I
- —
- Monthly cashflow
- —
- DSCR
- —
- Eligible?
- —
Personal DTI + credit; lowest rate.
DSCR
20% down · 8.5% · 30yr
- Down + closing
- —
- Monthly P&I
- —
- Monthly cashflow
- —
- DSCR
- —
- Eligible?
- —
No personal income docs; deal must DSCR.
Hard money
10% down · 12.0% · 12mo
- Down + closing
- —
- Monthly P&I
- —
- Monthly cashflow
- —
- DSCR
- —
- Eligible?
- —
Short-term bridge; refi at stabilization.
Listing history 1 events
-
2026-05-09$225,000 Active 850-char remark
ⓘ Source: listings_history table (triggers on properties + properties_extension) + one-shot
backfill from property_details.listing_events for pre-trigger history.
Tax reassessment forecast KY · Resets to sale price
- Current annual tax
- $1,232 · $103/mo
- Projected year-2 tax
- $1,935 · $161/mo
- Expected delta
- +$703/yr (+$59/mo · 57.1%)
ⓘ Screening estimate from a state-policy table — verify with the county assessor before closing.
Nearby sold comps map
Loading sold comps map…
Walkable amenities ~0.75 mi
Loading nearby amenities…
Taxation est. · year 1
- Rental income
- $21,852
- − Mortgage interest
- −$12,603
- − Property taxes
- −$1,232
- − Insurance
- −$1,125
- − Repairs & maintenance
- −$1,748
- − Management
- −$1,748
- − Depreciation
- −$6,545
- Taxable loss
- −$3,150
- Est. tax savings @ 24.0%
- +$756
- After-tax cash flow
- $1,503/yr
For passive investors: Depreciation is non-cash, so a rental often shows a tax loss while cash-flowing — sheltering income. Rental losses are passive: they offset passive income freely, and up to $25,000/yr can offset ordinary (W-2) income if you actively participate and your MAGI is under $100k (phasing out to $0 by $150k); unused losses carry forward. On sale, claimed depreciation is recaptured at up to 25%, and gains may owe capital-gains tax (a 1031 exchange can defer both). Figures are a year-1 estimate at your 24.0% rate — not tax advice; consult a CPA.
Schools (NCES district)
- District
- Meade County
- NCES district ID
- 2104050
- Math proficiency
- 41% ▼ -15.00%
- Reading proficiency
- 48% ▼ -12.00%
- Median HH income
- $49,628
- Composite
- 38.17/100
- National rank
- #4265
- State rank
- #21 of 165 in KY
Livability — Vine Grove
- Score
- 72/100
- State rank
- #124
- US rank
- #5837
Category grades
Schools grade is shown separately in the Schools card above.
Census & demographics
- Population (ZIP)
- 16,283
Population outlook (Meade County) Hauer SSP2
- Today (2025)
- 26,977 people
- By 2030
- 26,162 · -3.0%
- By 2040
- 24,029 · -10.9%
- By 2050
- 21,658 · -19.7%
- By 2075
- 16,994 · -37.0%
- By 2100
- 15,586 · -42.2%
Race, ethnicity, and origin ACS 2023
- Neighborhood character
- Predominantly White (81%)
- Race & ethnicity
- White 81% Black 9% Two or more races 7% Hispanic / Latino 2% Asian 2%
- Common ancestry
- Italian 2% Slovak 2% Serbian 1%
- Foreign-born
- 3% · South Korea, Canada
- Languages at home
- 95% English-only · Spanish 2% Tagalog/Filipino 1% German/W. Germanic 1%
Political lean MEDSL · Meade
- 2024 margin
- Solid R (+52.1) · D 23.2% · R 75.3% · Other 1.5%
- 2008→2024 swing
- -31.1pp toward R · 2008: -20.9pp · 2024: -52.1pp
- All cycles
- 2024: R+52.1 2020: R+46.4 2016: R+46.1 2012: R+22.8 2008: R+20.9
Not yet ingested
- Civics
- —
Market trends
- HPI YoY
- ▼ -16.55%
- Current HPI
- 246.3715
- Rent YoY
- —
- Metro
- —
- State GDP YoY
- ▲ 1.81%
- F500 in state
- 4
Industry mix (Fortune 500 HQ in KY)
| Industry | F500 HQs | Revenue |
|---|---|---|
| Healthcare | 1 | $118B |
|
||
| Food / Beverage | 1 | $7B |
|
||
Price history
+75.9% since first listed8 events — show timeline
- 2026-05-26 Pending — HKARMLS
- 2026-05-09 Listed $225,000 HKARMLS
- 2022-08-30 Sold (MLS) $289,000 HKARMLS
- 2022-07-27 Listed $289,000 HKARMLS
- 2021-01-27 Sold (MLS) $139,000 HKARMLS
- 2020-12-01 Listed $139,000 HKARMLS
- 2016-08-12 Sold (MLS) $126,500 HKARMLS
- 2016-06-21 Listed $127,900 HKARMLS
Property tax history
-0.5%/yrLatest (2025): $1,232 · -4.3% YoY. Source: county tax records.
Cash-flow waterfall
monthlySold comps — $/sqft
last 12 mo · ≤1 miLoading sold comps…