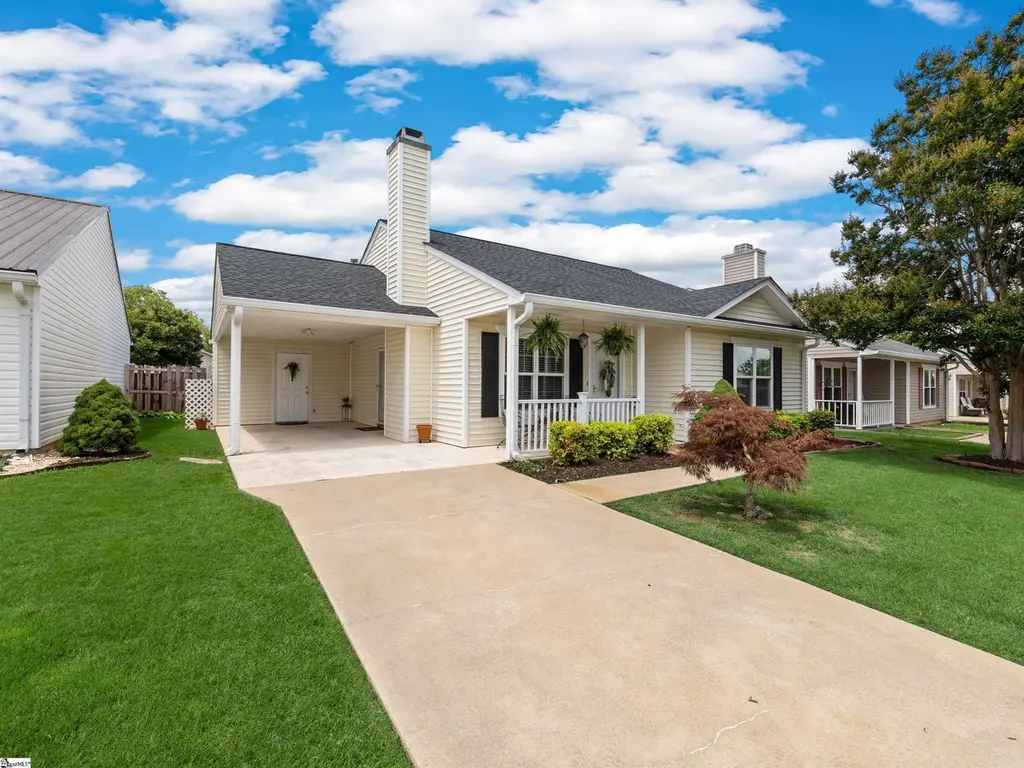
306 Pecos Ridge Rd · Spartanburg, SC
Flood risk 1/10 · Minimal
- FEMA flood zone
- X (unshaded)
- Chance of flooding over 30 yrs
- 0.0%
- Est. flood insurance / yr
- $507 – $1,088
Fire risk 4/10 · Minor
- Est. fire insurance / yr
- $783 – $1,453
Heat risk 6/10 · Moderate
- Hot days now (above 105°F)
- 7 days/yr
- Hot days in 30 yrs
- 16 days/yr
Wind risk 2/10 · Minimal
- Chance of severe wind over 30 yrs
- 2.0%
Air-quality risk 4/10 · Minor
- Unhealthy air days now
- 4 days/yr
- Unhealthy air days in 30 yrs
- 5 days/yr
Risk factors via First Street. Map © Google.
Why this score? — see what drove the D grade
The composite is a weighted blend of 9 inputs, each scored 0–100. Each bar is that input's sub-score; the figure is the points it added to the 100-point composite (weight × sub-score).
- Cash flow +14.7/30.0
- ARV discount +9.5/15.0
- DSCR +4.5/10.0
- Livability +3.8/5.0
- Schools +3.2/10.0
- 1% rule +2.9/10.0
- Rent growth +2.9/5.0
- Condition / age +2.5/5.0
- Appreciation +0.0/10.0
$214,900
🖨 Deal sheet (PDF) 📄 Offer letter ✓ Due diligence
Listing remarks MLS
Don't miss out on this well maintained patio home located perfectly on Spartanburg's westside close to shopping, schools and food. Feel the warmth as you walk up on the cozy front porch and enter into the inviting living space with a gas log fireplace for those chilly nights. This space connects you to the carport, dining area and hallway leading to the hall bath and two large comfortable bedrooms with walkin closets. Beyond the dining area is the kitchen with lots of cabinet space, pantry and laundry area. Enjoy your evenings out back on the covered patio right off the kitchen in your fenced in yard. Set up a viewing today.
Key facts
- Covered patio
- Gas log fireplace
- Cozy front porch
Tags
Property features AI
Finance
- Other: Lot on a cul-de-sac with fenced, level yard and underground utilities; Approximate lot dimensions: 50 x 95 x 50 x 95; Lot size: 1/2 acre or less; Approx. finished living area: 1,196
- HOA & community: Located in an HOA; HOA provides street lights; Community lighting
Exterior
- Parking: Attached carport (1-car) with paved concrete driveway; Driveway parking
- Security: Owned security system; Smoke detectors
- Utilities: Public water; Public sewer; Gas water heater; Private garbage pickup
- Home design: Single-story residence; Built in 1997; Slab foundation; Residential property (discovery required)
- Construction: Architectural roof; Vinyl siding exterior
- Exterior features: Front porch; Covered back porch; Patio; Some storm doors; Tilt-out windows; Thermal windows; Vinyl/aluminum trim; Vinyl siding
Interior
- Kitchen: Dishwasher; Disposal; Refrigerator; Electric freestanding range; Built-in microwave; Solid surface and laminate countertops
- Bedrooms: 2 bedrooms on the main level; Primary bedroom on main level with full bath, tub/shower and walk-in closet; Primary bedroom approx. 15 x 12; Second bedroom approx. 15 x 12
- Flooring: Carpet; Ceramic tile; Laminate flooring; Vinyl
- Bathrooms: 2 full bathrooms (both on the main level)
- Heating & cooling: Forced air heating (natural gas); Central electric cooling
- Interior features: Attic with disappearing stairs; Ceiling fans; Blown and smooth ceilings; Cable available; Owned security system; Smoke detectors; Walk-in closet; Pantry closet; Window treatments remain; Gas log fireplace
- Laundry & utility: Laundry on first floor in closet-style space; Washer connection; Electric dryer hookup; Garage storage
Neighborhood map
What this means for you Summary
Snapshot
- This is a 2-bed/2.0-bath single-family listed at $215k.
Deal economics
- At list price, monthly cash flow is $55 ($659/yr) — positive.
- The deal already cash-flows at list — no discount required.
- To meet the 1% rule (rent ≥ 1% of price), the offer needs to be $169k (21.3% below list).
- Recommended offer: $169k (21.3% below list) — sets the bar for 1% rule.
- Cap rate 6.6% vs local median 3.9% in Spartanburg — top-decile yield for the area; either an underpriced asset or a hidden risk that comps aren't pricing in. Stress-test before assuming the spread holds.
Location & tenants
- Location reads 76/100 on livability (#24 in SC, #3,679 nationally) — a middle-class / working-renter tenant base. Strengths: amenities A+, commute A+, cost of living A+; Watch: crime F, employment F.
- Spartanburg 06 (suburban): math 33% / reading 42% proficiency, ranked #35 of 80 in SC (top 44%) — families likely to look elsewhere, expect single-tenant / working-renter base with shorter leases.
- Zoned schools: Roebuck Elementary (math 40% / reading 37%, grade F, #306 of 597 statewide, top 51%, 800 students, 84% FRL); Dorman High (math 46% / reading 78%, grade B-, #99 of 196 statewide, top 53%, 3,808 students, 75% FRL) — zoned schools average 80% FRL vs 48% district-wide (31 pts higher); higher-poverty schools than district average — tighter screening recommended.
- Zoned-school proficiency averages 50% at this address vs 38% district-wide (+13 pts) — the actual schools serving this property are materially stronger than the Spartanburg 06 average implies; a family-tenant draw the district grade alone would hide.
- Market conditions: Rents rising (+1.8%/yr); 357 active listings in the ZIP; 4 comparable units currently listed for rent nearby; rentals at typical pace (median 16d on market — plan ~3-4 weeks tenant-placement turnaround); solid renter incomes; 3,129 units permitted in Spartanburg County in 2024 (40 in 5+ unit buildings).
Forward outlook
- Local home prices are declining (-3.0%/yr); year-one equity from $1k of loan paydown is wiped out by about $6k of value loss. Plan a longer hold.
- Spartanburg County population projected at +18% by 2050 — long-run rental-demand tailwind backs the buy-and-hold thesis.
Negotiation context
- Only 9 days on market — expect competitive offers; lowballing is unlikely to land.
- 4 sale attempts since 19y ago with the ask held roughly flat each time — persistent listings suggest the price (not the market) is what's stuck; bring a comps-based counter.
- Current owner paid $106k; list at $215k implies a 103% gain — meaningful room to come down on a strong offer.
Risks & watch-outs
- Climate carrying-cost: extreme-heat days projected 7→16/yr by 2055 (HVAC capex compounding) — expect insurance premiums to compound above CPI over the hold.
Questions for the listing agent
- What does the HOA fee cover, when was the last increase, and are there any pending special assessments or reserve-fund shortfalls?
- Is there a deadline driving the sale (1031 exchange, divorce, estate, relocation)? That informs how much negotiation room exists.
- Schools are D-rated, which usually means shorter tenancies and higher turnover. Who's the typical renter profile here, and what's been the actual vacancy rate?
- Crime grade is F in this area — have there been break-ins, vandalism, or insurance claims at this property in the last 3 years? What carrier currently insures it and at what premium?
- The area grade is low — what's the realistic commute time and amenity access for the typical tenant pool here? Any planned neighborhood developments (good or bad) we should know about?
- What's the average days-on-market for RENTAL listings here right now (not sales)? A rising rental-DOM trend means longer vacancies and softer asking-rent achievability than the comps imply.
- What's the recent tenant-quality profile in this submarket — average credit score on applications, eviction rate, late-payment / NSF rate, and stable-employment percentage? A property-management company in the area should have these aggregated.
- How much new for-sale + rental construction is in the pipeline within 1–3 miles? Heavy new supply typically softens prices + rents 12–24 months out; constrained supply supports both.
Investment metrics
- 1% rule
- 0.79% ✗
- Cap rate
- 6.60%
- Cash-on-cash
- 1.10%
- DSCR
- 1.05
- GRM
- 10.6
CMA / ARV
- ARV (on-the-fly)
- $224,848
- Comps found
- 12
Show comp detail 12 sales within ~0.75 mi
| Address | Dist | Beds/Ba | Sqft | Sold | Price | $/sf | Match |
|---|---|---|---|---|---|---|---|
| 105 Peccole Pass Ln | 0.02mi | 2/2.0 | 1,229 (+3%) | 5mo | $215,000 | $175 | 90 |
| 2285 Davenport Ct | 0.29mi | 3/2.0 (+1) | 1,224 (+2%) | 1mo | $250,000 | $204 | 77 |
| 2141 Pomerol Dr | 0.27mi | 3/2.0 (+1) | 1,268 (+6%) | 1mo | $238,000 | $188 | 72 |
| 708 Larado Ct | 0.09mi | 2/2.0 | 1,369 (+14%) | 3mo | $215,000 | $157 | 69 |
| 2240 Davenport Court Ct | 0.37mi | 3/2.0 (+1) | 1,247 (+4%) | 2mo | $244,575 | $196 | 69 |
| 2224 Davenport Court Ct | 0.39mi | 3/2.0 (+1) | 1,247 (+4%) | 7mo | $247,075 | $198 | 64 |
| 728 Cerons St | 0.21mi | 3/2.0 (+1) | 1,345 (+12%) | 1mo | $268,000 | $199 | 64 |
| 58 Arbours West Ln | 0.35mi | 2/2.0 | 1,300 (+9%) | 7mo | $228,000 | $175 | 63 |
| 111 Linville Dr | 0.72mi | 3/1.5 (+1) | 1,196 (0%) | 7mo | $190,000 | $159 | 54 |
| 214 Ashton Dr | 0.48mi | 3/2.0 (+1) | 1,346 (+12%) | 1mo | $229,000 | $170 | 51 |
| 2209 Davenport Court Ct | 0.40mi | 3/2.0 (+1) | 1,368 (+14%) | 2mo | $260,065 | $190 | 51 |
| 2208 Davenport Court Ct | 0.38mi | 3/2.0 (+1) | 1,368 (+14%) | 6mo | $254,900 | $186 | 48 |
Match score weights: distance 35% · size 25% · config 20% · recency 20%. Top-matched comps best support the ARV.
Projected returns pro-forma
-3.0% appreciation · 1.75% rent growth · sell at horizon
- IRR
- -15.8%
- Equity multiple
- 0.44×
- Total profit
- $-33,525
- Equity at exit
- $32,042
- IRR
- -9.5%
- Equity multiple
- 0.44×
- Total profit
- $-33,501
- Equity at exit
- $18,581
Cash invested: $60,172 (down + closing). Projections, not guarantees.
Landlord ↔ Tenant lean methodology
- Overall (STATE)
- 90 Strongly Landlord-Friendly
- State South Carolina
- 90 Strongly Landlord-Friendly · R+6
- County
- — inherits STATE
- City
- — inherits STATE
ZIP-level market 29369
- Home prices YoY
- -27.4%
- Rents YoY
- 1.8%
- Active inventory
- 357
- Price-to-rent
- 10.6×
Monthly cashflow live
- Estimated rent
- $1,691 medium interval (Pro) →
- Mortgage (P&I)
- −$1,127
- Tax from tax record
- −$51 /mo · $617/yr
- Insurance
- −$90
- HOA
- −$13
- Vacancy / Maint / Mgmt
- −$355
- Net cashflow
- $55
Break-even live
Sensitivity live
| Price | -10% $177 | -5% $116 | +0% $55 | +5% $-6 | +10% $-67 |
|---|---|---|---|---|---|
| Rent | -10% $-79 | -5% $-12 | +0% $55 | +5% $122 | +10% $189 |
| Rate | -1.0pp $163 | -0.5pp $110 | base $55 | +0.5pp $-1 | +1.0pp $-57 |
UW: 25.0% down · 7.5% · 30yr · 1.5% tax · 5.0% vac · 8.0% maint · 8.0% mgmt
Financing live
Cash to close
- Down payment
- $53,725
- Closing costs
- $6,447
- Reserves months
- —
- Total cash needed
- —
Loan-product check · same deal, 3 products live
Conventional
25% down · 7.5% · 30yr
- Down + closing
- —
- Monthly P&I
- —
- Monthly cashflow
- —
- DSCR
- —
- Eligible?
- —
Personal DTI + credit; lowest rate.
DSCR
20% down · 8.5% · 30yr
- Down + closing
- —
- Monthly P&I
- —
- Monthly cashflow
- —
- DSCR
- —
- Eligible?
- —
No personal income docs; deal must DSCR.
Hard money
10% down · 12.0% · 12mo
- Down + closing
- —
- Monthly P&I
- —
- Monthly cashflow
- —
- DSCR
- —
- Eligible?
- —
Short-term bridge; refi at stabilization.
Rent comps 4 comps
| Address | Beds | Baths | Sqft | Rent | $/sqft | DOM | Units | Dist |
|---|---|---|---|---|---|---|---|---|
| 2180 Davenport Ct Moore, SC | 3.0 | 2.0 | 1456 | $2,000 | $1.37 | 15d | 1 | 0.35mi |
| 202 Tower Dr Moore, SC | 3.0 | 2.0 | 1008 | $1,700 | $1.69 | 23d | 1 | 0.85mi |
| 460 E Blackstock Rd Spartanburg, SC | 3.0 | 1.5 | 1020 | $1,275 | $1.25 | 5d | 1 | 1.11mi |
| 430 E Blackstock Rd Spartanburg, SC | 1.0–2.0 | 1.0 | 721 | $915 | $1.27 | 13d | 1 | 1.27mi |
HOA detail
- Monthly dues
- $13 · $156/yr
- Likely covers
- gas
Listing history 7 events
-
2026-06-22days on market $214,900 Active 9 DOM
-
2026-06-18days on market $214,900 Active 6 DOM
-
2026-06-17days on market $214,900 Active 5 DOM
-
2026-06-16days on market $214,900 Active 4 DOM
-
2026-06-15days on market $214,900 Active 3 DOM
-
2026-06-13remarks 632-char remark
-
2026-06-13$214,900 Active 1 DOM
ⓘ Source: listings_history table (triggers on properties + properties_extension) + one-shot
backfill from property_details.listing_events for pre-trigger history.
Tax reassessment forecast SC · Resets to sale price
- Current annual tax
- $617 · $51/mo
- Projected year-2 tax
- $1,225 · $102/mo
- Expected delta
- +$608/yr (+$51/mo · 98.6%)
ⓘ Screening estimate from a state-policy table — verify with the county assessor before closing.
Climate risk First Street
- Flood 1/10 Low FEMA zone X (unshaded) · 0% chance over 30 yrs
- Wildfire 4/10 Moderate
- Heat 6/10 Major 7 d/yr ≥105°F today · 16 d/yr by 30 yrs out
- Wind 2/10 Low 2% chance of damaging wind over 30 yrs
- Air quality 4/10 Moderate 4 unhealthy d/yr today · 5 by 30 yrs out
Nearby sold comps map
Loading sold comps map…
Walkable amenities ~0.75 mi
Loading nearby amenities…
Taxation est. · year 1
- Rental income
- $20,291
- − Mortgage interest
- −$12,038
- − Property taxes
- −$617
- − Insurance
- −$1,074
- − Repairs & maintenance
- −$1,623
- − Management
- −$1,623
- − HOA
- −$156
- − Depreciation
- −$6,252
- Taxable loss
- −$3,092
- Est. tax savings @ 24.0%
- +$742
- After-tax cash flow
- $1,401/yr
For passive investors: Depreciation is non-cash, so a rental often shows a tax loss while cash-flowing — sheltering income. Rental losses are passive: they offset passive income freely, and up to $25,000/yr can offset ordinary (W-2) income if you actively participate and your MAGI is under $100k (phasing out to $0 by $150k); unused losses carry forward. On sale, claimed depreciation is recaptured at up to 25%, and gains may owe capital-gains tax (a 1031 exchange can defer both). Figures are a year-1 estimate at your 24.0% rate — not tax advice; consult a CPA.
Schools (NCES district)
- District
- Spartanburg 06
- NCES district ID
- 4503630
- Math proficiency
- 33% ▼ -8.00%
- Reading proficiency
- 42% ▼ -2.00%
- Median HH income
- $46,110
- Composite
- 32.02/100
- National rank
- #5827
- State rank
- #35 of 80 in SC
Livability — Spartanburg
- Score
- 76/100
- State rank
- #24
- US rank
- #3679
Category grades
Schools grade is shown separately in the Schools card above.
Census & demographics
- County
- Spartanburg County · 258,607 people
- City population
- 120,406
- Metro
- Spartanburg, SC
- Population (ZIP)
- 16,503
- Household income
- $82,924
- Rent vs Own
- Severe rent burden
- 199.0
Population outlook (Spartanburg County) Hauer SSP2
- Today (2025)
- 325,495 people
- By 2030
- 338,800 · +4.1%
- By 2040
- 363,471 · +11.7%
- By 2050
- 384,156 · +18.0%
- By 2075
- 430,137 · +32.1%
- By 2100
- 442,733 · +36.0%
Race, ethnicity, and origin ACS 2023
- Neighborhood character
- Predominantly White (65%)
- Race & ethnicity
- White 65% Black 20% Hispanic / Latino 11% Two or more races 9% Asian 2%
- Hispanic origin (detail)
- Mexican 4% Cuban 3%
- Common ancestry
- Italian 2% Lithuanian 2% Slovak 1%
- Foreign-born
- 8% · Canada, Jamaica, Dominican Republic
- Languages at home
- 87% English-only · Spanish 10% Other Indo-European 1% Russian/Polish/Slavic 1%
Political lean MEDSL · Spartanburg
- 2024 margin
- Solid R (+33.6) · D 32.6% · R 66.2% · Other 1.2%
- 2008→2024 swing
- -12.0pp toward R · 2008: -21.6pp · 2024: -33.6pp
- All cycles
- 2024: R+33.6 2020: R+27.3 2016: R+30.0 2012: R+23.1 2008: R+21.6
Not yet ingested
- Civics
- —
Market trends
- HPI YoY
- ▼ -80.31%
- Current HPI
- 212.4242
- Rent YoY
- ▲ 1.75%
- Metro
- Spartanburg, SC
- State GDP YoY
- ▲ 4.51%
- F500 in state
- 2
Industry mix (Fortune 500 HQ in SC)
| Industry | F500 HQs | Revenue |
|---|---|---|
| Packaging | 1 | $7B |
|
||
Price history
+1295.5% since first listed9 events — show timeline
- 2026-06-12 Listed $214,900 Greater Greenville MLS
- 2026-06-12 Listed $214,900 SPMLS
- 2008-08-29 Sold (Public Records) $106,000 Public Records
- 2008-08-26 Sold (MLS) $106,000 SPMLS
- 2008-07-01 Listed $106,000 SPMLS
- 2007-05-21 Sold (Public Records) $101,250 Public Records
- 2007-05-17 Sold (MLS) $101,250 SPMLS
- 2007-01-04 Listed $99,500 SPMLS
- 2001-01-01 Sold (Public Records) $15,400 Public Records
Property tax history
+5.4%/yrLatest (2025): $617 · +1.8% YoY. Source: county tax records.
Cash-flow waterfall
monthlySold comps — $/sqft
last 12 mo · ≤1 miLoading sold comps…