 Triplex
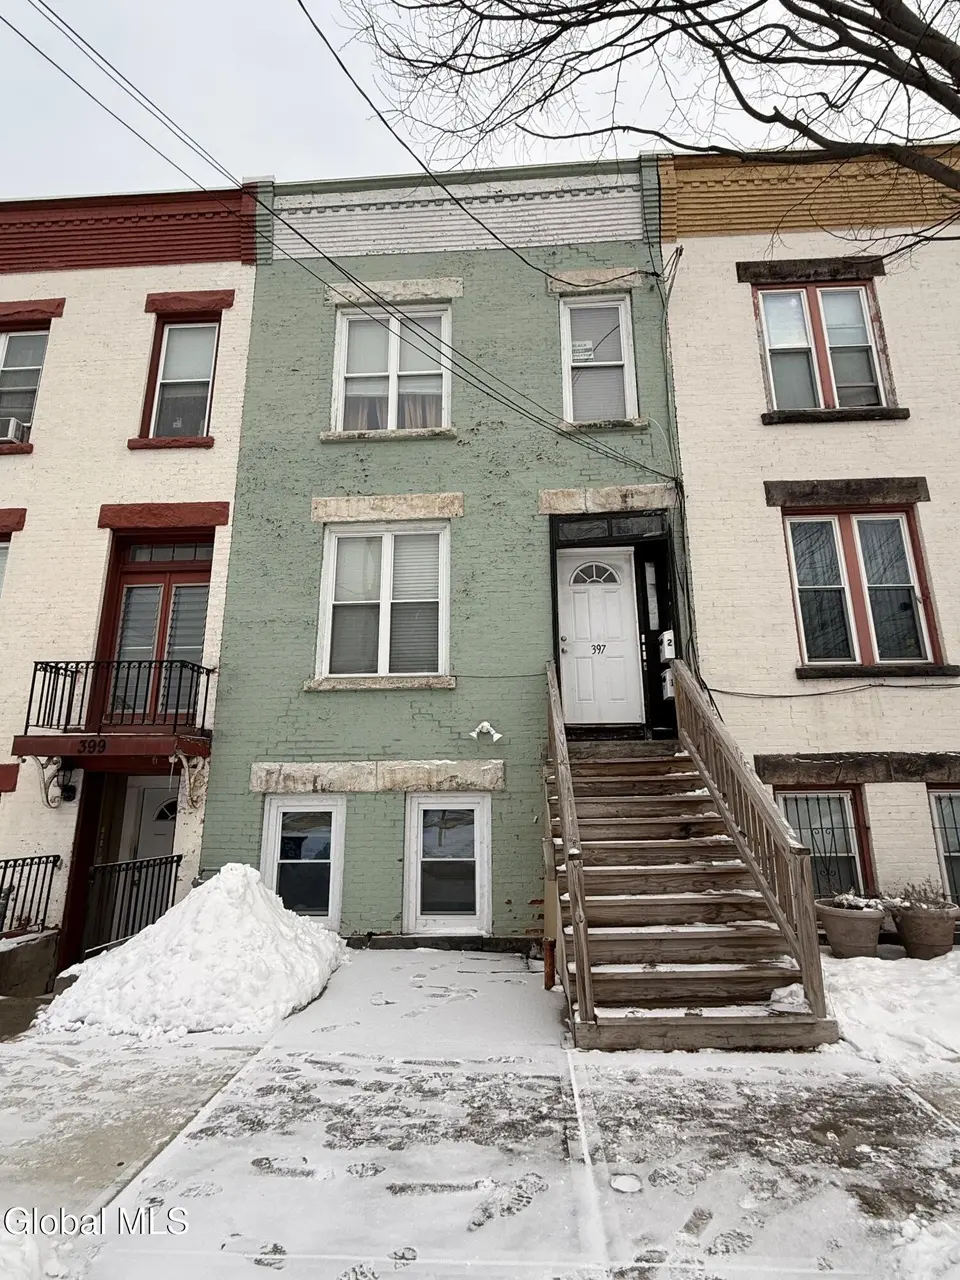
397 Washington Ave · Albany, NY
Flood risk 1/10 · Minimal
- FEMA flood zone
- X (unshaded)
- Chance of flooding over 30 yrs
- 0.0%
- Est. flood insurance / yr
- $473 – $860
Fire risk 1/10 · Minimal
- Est. fire insurance / yr
- $691 – $1,283
Heat risk 4/10 · Minor
- Hot days now (above 97°F)
- 7 days/yr
- Hot days in 30 yrs
- 17 days/yr
Wind risk 3/10 · Minor
- Chance of severe wind over 30 yrs
- 6.0%
Air-quality risk 1/10 · Minimal
- Unhealthy air days now
- 0 days/yr
- Unhealthy air days in 30 yrs
- 0 days/yr
Risk factors via First Street. Map © Google.
Why this score? — see what drove the B- grade
The composite is a weighted blend of 9 inputs, each scored 0–100. Each bar is that input's sub-score; the figure is the points it added to the 100-point composite (weight × sub-score).
- Cash flow +30.0/30.0
- 1% rule +10.0/10.0
- DSCR +10.0/10.0
- ARV discount +4.2/15.0
- Livability +4.0/5.0
- Rent growth +3.8/5.0
- Schools +3.2/10.0
- Condition / age +2.5/5.0
- Appreciation +0.0/10.0
$289,000
🖨 Deal sheet 📄 Offer letter ✓ Due diligence
Multi-family units
County records classify this as Multi-Family (2-4 Unit). Listing-text estimate: 3 units. confirmed
Listing remarks MLS
Maintained triplex conveniently located from state & legislative gov't institutes, Albany Medical Center & St. Peter's hospitals, Washington Park, SUNY campus, popular eateries, galleries, coffee shops, nightlife & many more favored city attractions. Original details still adorned throughout such as high ceilings, oversized windows, decorative wood moldings, exposed brick, etc. Spacious units. Outdoor space perfect for entertaining during the warmer season.
Key facts
- Exposed brick
- Outdoor space
- High ceilings
Tags
Neighborhood map
What this means for you Summary
Snapshot
- This is a 3 × 2-bed/3.0-bath units multifamily listed at $289k.
Deal economics
- At list price, monthly cash flow is $1k ($17k/yr) — positive. Per door: $462/mo.
- The deal already cash-flows at list — no discount required.
- Meets the 1% rule at list price ($5k rent vs $289k).
- Recommended offer: $263k (9.0% below list) — sets the bar for market timing.
- Cap rate 12.1% vs local median 5.7% in Albany — top-decile yield for the area; either an underpriced asset or a hidden risk that comps aren't pricing in. Stress-test before assuming the spread holds.
Location & tenants
- Location reads 79/100 on livability (#129 in NY, #2,083 nationally) — a middle-class / working-renter tenant base. Strengths: amenities A+, commute A+, housing A+; Watch: employment C-, crime F.
- Albany City School District (urban): math 37% / reading 40% proficiency, ranked #543 of 590 in NY (top 92%) — families likely to look elsewhere, expect single-tenant / working-renter base with shorter leases; 66% free/reduced lunch — lower-income household profile, screen leases tightly.
- Market conditions: Rents rising fast (+5.4%/yr); 89 active listings in the ZIP; 29 comparable units currently listed for rent nearby; rentals at typical pace (median 24d on market — plan ~3-4 weeks tenant-placement turnaround); 48% of comp listings sitting > 30 days — soft ceiling on asking rent; lower-income renter base — watch delinquency; 675 units permitted in Albany County in 2024 (451 in 5+ unit buildings).
- At $4,501/mo this rent would consume 130% of the median local household income ($42k/yr) (locally 2035% of renters already pay >50% of income on rent) — very limited rent-growth headroom before tenants either downsize or default.
Forward outlook
- Local home prices are declining (-3.0%/yr); year-one equity from $2k of loan paydown is wiped out by about $9k of value loss. Plan a longer hold.
- Albany County population projected at +9% by 2050 — modest demand growth; plan on rents tracking national, not racing it.
- At projected returns (-3.0% appreciation + 5.4% rent growth), your $81k cash investment doubles in ~6 years — after that, you're playing with house money.
Negotiation context
- It's been on market 107 days — a 9% lower offer ($263k) is reasonable based on typical stale-listing flexibility.
- 5 sale attempts since 9y ago; this cycle's ask has dropped $20k (6%) from the opening price — seller is motivated, your offer sets the floor, not the list.
Risks & watch-outs
- Watch-outs: built in 1820 — expect roof / HVAC / electrical / plumbing capex.
Questions for the listing agent
- It's been on market 107 days. Have you received any prior offers? Is the seller open to a 9% concession, seller financing, or rate buy-down credit?
- Can we see the unit-by-unit rent roll, current vacancy, and any below-market leases? What's the average tenancy length?
- What capital expenditures (roof, boiler, parking lot, exteriors) have been made in the last 5 years, and what's planned in the next 2?
- Built in 1820 — when were the roof, HVAC, electrical panel, plumbing, and water heater last replaced?
- Why hasn't it sold? Are there any deal-killer items the seller is aware of (foundation, flood, title, zoning, code violations)?
- Is there a deadline driving the sale (1031 exchange, divorce, estate, relocation)? That informs how much negotiation room exists.
- Crime grade is F in this area — have there been break-ins, vandalism, or insurance claims at this property in the last 3 years? What carrier currently insures it and at what premium?
- What's the average days-on-market for RENTAL listings here right now (not sales)? A rising rental-DOM trend means longer vacancies and softer asking-rent achievability than the comps imply.
- What's the recent tenant-quality profile in this submarket — average credit score on applications, eviction rate, late-payment / NSF rate, and stable-employment percentage? A property-management company in the area should have these aggregated.
- How much new apartment / multifamily construction is in the pipeline within 1–3 miles? Heavy new supply (>2% of stock underway) typically softens rents 12–24 months out; light construction supports rent growth.
Investment metrics
- 1% rule
- 1.56% ✓
- Cap rate
- 12.05%
- Cash-on-cash
- 20.56%
- DSCR
- 1.91
- GRM
- 5.4
CMA / ARV
- ARV (median comp)
- $269,121
- List price
- $289,000
- Delta
- 7.39%
- Verdict
- FAIR
- Comps
- 20 within 1.0 mi
Show comp detail 12 sales within ~0.75 mi
| Address | Dist | Beds/Ba | Sqft | Sold | Price | $/sf | Match |
|---|---|---|---|---|---|---|---|
| 60 Bradford St | 0.03mi | 3/2.0 | 1,600 (-13%) | 4mo | $170,000 | $106 | 70 |
| 97 West St | 0.28mi | 4/2.0 (+1) | 1,760 (-4%) | 6mo | $187,000 | $106 | 66 |
| 156 Quail St | 0.30mi | 4/2.0 (+1) | 1,876 (+2%) | 13mo | $165,000 | $88 | 63 |
| 246 1st St | 0.46mi | 4/2.0 (+1) | 1,860 (+1%) | 9mo | $185,000 | $99 | 60 |
| 478 3rd St | 0.56mi | 4/2.0 (+1) | 1,852 (+1%) | 8mo | $119,000 | $64 | 57 |
| 376 1st St | 0.31mi | 4/2.0 (+1) | 1,680 (-8%) | 10mo | $100,000 | $60 | 54 |
| 202 Jefferson St | 0.69mi | 3/2.0 | 1,776 (-3%) | 6mo | $325,000 | $183 | 53 |
| 179 Lancaster St | 0.59mi | 3/3.0 | 2,016 (+10%) | 5mo | $200,000 | $99 | 52 |
| 378 Hamilton St | 0.64mi | 4/3.0 (+1) | 1,700 (-7%) | 6mo | $285,000 | $168 | 48 |
| 685 Clinton Ave | 0.50mi | 4/2.0 (+1) | 2,032 (+11%) | 6mo | $190,000 | $94 | 45 |
| 596 Livingston Ave | 0.70mi | 4/2.0 (+1) | 1,584 (-14%) | 3mo | $148,000 | $93 | 33 |
| 523 Central Ave | 0.75mi | 4/4.0 (+1) | 2,016 (+10%) | 11mo | $289,000 | $143 | 31 |
Match score weights: distance 35% · size 25% · config 20% · recency 20%. Top-matched comps best support the ARV.
Projected returns pro-forma
-3.0% appreciation · 5.37% rent growth · sell at horizon
- IRR
- 15.7%
- Equity multiple
- 1.65×
- Total profit
- $52,648
- Equity at exit
- $43,091
- IRR
- 26.1%
- Equity multiple
- 3.57×
- Total profit
- $207,602
- Equity at exit
- $24,987
Cash invested: $80,920 (down + closing). Projections, not guarantees.
Landlord ↔ Tenant lean methodology
- Overall (STATE)
- 15 Strongly Tenant-Friendly
- State New York
- 15 Strongly Tenant-Friendly · D+10
- County
- — inherits STATE
- City
- — inherits STATE
ZIP-level market 12206
- Home prices YoY
- -9.9%
- Rents YoY
- 5.4%
- Active inventory
- 89
- Price-to-rent
- 16.1×
Monthly cashflow live
- Estimated rent
- $4,501 high interval (Pro) →
- Mortgage (P&I)
- −$1,516
- Tax from tax record
- −$533 /mo · $6,398/yr
- Insurance
- −$120
- HOA
- −$0
- Vacancy / Maint / Mgmt
- −$945
- Net cashflow
- $1,387
Break-even live
3-unit breakdown (identical units grouped — click to expand)
| Units | Beds | Baths | Est. rent |
|---|---|---|---|
| 3× units | 2 | 3 | $4,500 |
| #1 | 2 | 3 | $1,500 |
| #2 | 2 | 3 | $1,500 |
| #3 | 2 | 3 | $1,500 |
| Total (3 units) | $4,501 | ||
UW: 25.0% down · 7.5% · 30yr · 1.5% tax · 5.0% vac · 8.0% maint · 8.0% mgmt
Financing live
Cash to close
- Down payment
- $72,250
- Closing costs
- $8,670
- Reserves months
- —
- Total cash needed
- —
Loan-product check · same deal, 3 products live
Conventional
25% down · 7.5% · 30yr
- Down + closing
- —
- Monthly P&I
- —
- Monthly cashflow
- —
- DSCR
- —
- Eligible?
- —
Personal DTI + credit; lowest rate.
DSCR
20% down · 8.5% · 30yr
- Down + closing
- —
- Monthly P&I
- —
- Monthly cashflow
- —
- DSCR
- —
- Eligible?
- —
No personal income docs; deal must DSCR.
Hard money
10% down · 12.0% · 12mo
- Down + closing
- —
- Monthly P&I
- —
- Monthly cashflow
- —
- DSCR
- —
- Eligible?
- —
Short-term bridge; refi at stabilization.
Rent comps 29 comps
| Address | Beds | Baths | Sqft | Rent | $/sqft | DOM | Units | Dist |
|---|---|---|---|---|---|---|---|---|
| 147 Western Ave Albany, NY | 3.0 | 1.0 | 1428 | $1,800 | $1.26 | 14d | 1 | 0.22mi |
| 178 Western Ave Unit 3 Albany, NY | 3.0 | 1.0 | 1500 | $1,725 | $1.15 | 14d | 1 | 0.30mi |
| 240 Washington Ave Albany, NY | 2.0 | 2.0 | 1560 | $2,450 | $1.57 | 43d | 1 | 0.36mi |
| 58 Elberon Pl Apt 2 Albany, NY | 4.0 | 1.0 | 1250 | $2,200 | $1.76 | 43d | 1 | 0.39mi |
| 154 Spring St Albany, NY | 3.0 | 1.0 | 2500 | $1,695 | $0.68 | 43d | 1 | 0.39mi |
| 257 Quail St Albany, NY | 4.0 | 2.5 | 2208 | $2,800 | $1.27 | 43d | 1 | 0.49mi |
| 227 Jay St Albany, NY | 2.0 | 2.0 | 1710 | $2,150 | $1.26 | 43d | 1 | 0.52mi |
| 569 Washington Ave Unit 1st Floor Albany, NY | 4.0 | 1.0 | 1275 | $2,000 | $1.57 | 43d | 1 | 0.52mi |
| 88 Willett St Albany, NY | 3.0 | 1.0 | 825 | $2,080 | $2.52 | 14d | 10 | 0.52mi |
| 41 Dove St Albany, NY | 2.0 | 2.5 | 2400 | $2,350 | $0.98 | 14d | 1 | 0.60mi |
| 282 Livingston Ave Albany, NY | 3.0 | 1.5 | 1464 | $2,400 | $1.64 | 23d | 1 | 0.61mi |
| 154 Lancaster St Unit 1 Albany, NY | 2.0 | 1.5 | 1500 | $2,200 | $1.47 | 23d | 1 | 0.64mi |
| 546 Mercer St Unit 1 Albany, NY | 3.0 | 1.0 | 1400 | $1,800 | $1.29 | 23d | 1 | 0.77mi |
| 346 Madison Ave Albany, NY | 3.0 | 2.0 | 1500 | $2,495 | $1.66 | 23d | 1 | 0.78mi |
| 363 Ontario St Albany, NY | 1.0–2.0 | 1.0–2.5 | 1610 | $3,485 | $2.16 | 14d | 1 | 0.83mi |
| 21 Woodlawn Ave Unit 3rd floor Albany, NY | 3.0 | 1.0 | 1300 | $1,500 | $1.15 | 23d | 1 | 0.88mi |
| 21 Woodlawn Ave Unit 3RDFL Albany, NY | 3.0 | 1.0 | 1300 | $1,500 | $1.15 | 43d | 1 | 0.88mi |
| 201 Park Ave Unit 10 Albany, NY | 3.0 | 2.0 | 1600 | $2,100 | $1.31 | 43d | 1 | 0.90mi |
| 602 Morris St Albany, NY | 3.0 | 1.0 | 1270 | $1,850 | $1.46 | 14d | 1 | 0.92mi |
| 32 1st St Albany, NY | 4.0 | 1.5 | 1773 | $1,850 | $1.04 | 43d | 1 | 0.94mi |
| 15 Ten Broeck St Albany, NY | 2.0 | 1.5 | 1900 | $1,750 | $0.92 | 21d | 1 | 1.04mi |
| 32 Peyster St Unit 2nd Albany, NY | 3.0 | 2.0 | 1500 | $2,300 | $1.53 | 43d | 1 | 1.09mi |
| 48 N Pearl St Albany, NY | 2.0 | 1.0–2.5 | 1251 | $3,500 | $2.80 | 14d | 17 | 1.12mi |
| 104 S Main Ave Unit 1 Albany, NY | 3.0 | 1.0 | 1300 | $2,600 | $2.00 | 43d | 1 | 1.18mi |
| 38 W Erie St Albany, NY | 4.0 | 2.0 | 1440 | $2,800 | $1.94 | 23d | 1 | 1.22mi |
| 119 Grand St Albany, NY | 3.0 | 1.0 | 1600 | $1,300 | $0.81 | 43d | 1 | 1.29mi |
| 78 S Pine Ave Unit 2 Albany, NY | 3.0 | 1.5 | 1541 | $2,350 | $1.52 | 14d | 1 | 1.36mi |
| 135 Winthrop Ave Albany, NY | 3.0 | 2.0 | 1788 | $3,500 | $1.96 | 43d | 1 | 1.41mi |
| 30 Cardinal Ave Albany, NY | 4.0 | 1.0 | 1529 | $2,800 | $1.83 | 44d | 1 | 1.48mi |
Listing history 31 events
-
2026-06-18price $289,000 Active 107 DOM
-
2026-06-18days on market $299,000 Active 107 DOM
-
2026-06-17days on market $299,000 Active 106 DOM
-
2026-06-16days on market $299,000 Active 105 DOM
-
2026-06-15days on market $299,000 Active 104 DOM
-
2026-06-14days on market $299,000 Active 102 DOM
-
2026-06-10days on market $299,000 Active 99 DOM
-
2026-06-08days on market $299,000 Active 97 DOM
-
2026-06-07days on market $299,000 Active 96 DOM
-
2026-06-03days on market $299,000 Active 92 DOM
-
2026-06-02days on market $299,000 Active 91 DOM
-
2026-06-01days on market $299,000 Active 90 DOM
-
2026-05-31days on market $299,000 Active 89 DOM
-
2026-05-31days on market $299,000 Active 88 DOM
-
2026-03-17price $299,000 473-char remark
Show marketing remark (473 chars)
Maintained triplex conveniently located from state & legislative gov't institutes, Albany Medical Center & St. Peter's hospitals, Washington Park, SUNY campus, popular eateries, galleries, coffee shops, nightlife & many more favored city attractions. Original details still adorned throughout such as high ceilings, oversized windows, decorative wood moldings, exposed brick, etc. Spacious units. Outdoor space perfect for entertaining during the warmer season.
-
2026-03-03$309,000 Active 473-char remark
Show marketing remark (473 chars)
Maintained triplex conveniently located from state & legislative gov't institutes, Albany Medical Center & St. Peter's hospitals, Washington Park, SUNY campus, popular eateries, galleries, coffee shops, nightlife & many more favored city attractions. Original details still adorned throughout such as high ceilings, oversized windows, decorative wood moldings, exposed brick, etc. Spacious units. Outdoor space perfect for entertaining during the warmer season.
-
2023-03-31soldstatus $279,000
-
2023-01-28status Pending 643-char remark
Show marketing remark (643 chars)
Brick Triplex in a great location! Across the street from SUNY downtown campus, on bus line, walk to Washington Park. Some exposed brick walls! New Roof, new front porch, basement unit had new flooring installed prior to current tenant. Fully occupied, however the tenant in the middle unit will be vacating in February. That tenant has been there for years, and can certainly get higher rent on the turnover. All excellent tenants!! Basement unit is a studio apartment, but very spacious and plenty of room for a sleeping and living area. Units 2 & 3 are both 1 bedroom. 24 Hour Notice for showings, and there is limited availability.
-
2023-01-13$259,000 Active 643-char remark
Show marketing remark (643 chars)
Brick Triplex in a great location! Across the street from SUNY downtown campus, on bus line, walk to Washington Park. Some exposed brick walls! New Roof, new front porch, basement unit had new flooring installed prior to current tenant. Fully occupied, however the tenant in the middle unit will be vacating in February. That tenant has been there for years, and can certainly get higher rent on the turnover. All excellent tenants!! Basement unit is a studio apartment, but very spacious and plenty of room for a sleeping and living area. Units 2 & 3 are both 1 bedroom. 24 Hour Notice for showings, and there is limited availability.
-
2020-11-10soldstatus $203,500
-
2020-10-27soldstatus $203,500 Closed (Final Sale)
-
2020-09-01status Pend (Under Cntr)
-
2020-08-19$199,900 New
-
2017-12-12soldstatus $137,500
-
2017-10-04soldstatus $137,500 Closed (Final Sale)
-
2017-09-06status Pend (Under Cntr)
-
2017-08-18$145,000 New
-
2017-08-14historical
-
2017-07-29price $150,000
-
2017-06-19$154,900 New
-
2017-01-09soldstatus $57,500
ⓘ Source: listings_history table (triggers on properties + properties_extension) + one-shot
backfill from property_details.listing_events for pre-trigger history.
Tax reassessment forecast NY · Partial reset (capped growth)
- Current annual tax
- $6,398 · $533/mo
- Projected year-2 tax
- $6,398 · $533/mo
- Expected delta
- $0/yr ($0/mo · 0.0%)
ⓘ Screening estimate from a state-policy table — verify with the county assessor before closing.
Climate risk First Street
- Flood 1/10 Low FEMA zone X (unshaded) · 0% chance over 30 yrs
- Wildfire 1/10 Low
- Heat 4/10 Moderate 7 d/yr ≥97°F today · 17 d/yr by 30 yrs out
- Wind 3/10 Moderate 6% chance of damaging wind over 30 yrs
- Air quality 1/10 Low 0 unhealthy d/yr today · 0 by 30 yrs out
Nearby sold comps map
Loading sold comps map…
Walkable amenities ~0.75 mi
Loading nearby amenities…
Taxation est. · year 1
- Rental income
- $54,012
- − Mortgage interest
- −$16,188
- − Property taxes
- −$6,398
- − Insurance
- −$1,445
- − Repairs & maintenance
- −$4,321
- − Management
- −$4,321
- − Depreciation
- −$8,407
- Taxable income
- $12,932
- Est. tax owed @ 24.0%
- −$3,104
- After-tax cash flow
- $13,537/yr
For passive investors: Depreciation is non-cash, so a rental often shows a tax loss while cash-flowing — sheltering income. Rental losses are passive: they offset passive income freely, and up to $25,000/yr can offset ordinary (W-2) income if you actively participate and your MAGI is under $100k (phasing out to $0 by $150k); unused losses carry forward. On sale, claimed depreciation is recaptured at up to 25%, and gains may owe capital-gains tax (a 1031 exchange can defer both). Figures are a year-1 estimate at your 24.0% rate — not tax advice; consult a CPA.
Schools (NCES district)
- District
- Albany City School District
- NCES district ID
- 3602460
- Math proficiency
- 37% ▲ 6.00%
- Reading proficiency
- 40% ▲ 7.00%
- Median HH income
- $40,568
- Composite
- 32.34/100
- National rank
- #5744
- State rank
- #543 of 590 in NY
Livability — Albany
- Score
- 79/100
- State rank
- #129
- US rank
- #2083
Category grades
Schools grade is shown separately in the Schools card above.
Census & demographics
- Census place
- Albany, NY
- County
- Albany County · 196,626 people
- City population
- 116,921
- Metro
- Albany-Schenectady-Troy, NY
- Population (ZIP)
- 14,572
- Household income
- $41,548
- Rent vs Own
- Severe rent burden
- 2035.0
Population outlook (Albany County) Hauer SSP2
- Today (2025)
- 320,794 people
- By 2030
- 327,401 · +2.1%
- By 2040
- 338,218 · +5.4%
- By 2050
- 348,467 · +8.6%
- By 2075
- 381,693 · +19.0%
- By 2100
- 393,809 · +22.8%
Race, ethnicity, and origin ACS 2023
- Neighborhood character
- Highly diverse neighborhood (Simpson 0.75)
- Race & ethnicity
- Black 38% White 27% Hispanic / Latino 15% Two or more races 12% Asian 10%
- Hispanic origin (detail)
- Puerto Rican 10% Dominican 1%
- Common ancestry
- Italian 2% Lithuanian 2% Romanian 1%
- Foreign-born
- 22% · Canada, China
- Languages at home
- 75% English-only · Spanish 10% Other Indo-European 5% Chinese 3%
Political lean MEDSL · Albany
- 2024 margin
- Strong D (+25.8) · D 62.9% · R 37.1%
- 2008→2024 swing
- -3.6pp toward R · 2008: 29.4pp · 2024: 25.8pp
- All cycles
- 2024: D+25.8 2020: D+31.4 2016: D+24.3 2012: D+31.0 2008: D+29.4
Not yet ingested
- Civics
- —
Market trends
- HPI YoY
- ▼ -30.24%
- Current HPI
- 275.8109
- Rent YoY
- ▲ 5.37%
- Metro
- Albany-Schenectady-Troy, NY
- State GDP YoY
- ▲ 2.60%
- F500 in state
- 92
Industry mix (Fortune 500 HQ in NY)
| Industry | F500 HQs | Revenue |
|---|---|---|
| Financial Services | 10 | $950B |
|
||
| Consumer Goods | 9 | $162B |
|
||
| Insurance | 4 | $225B |
|
||
| Telecommunications | 2 | $144B |
|
||
| Pharmaceuticals | 2 | $112B |
|
||
| Media / Entertainment | 2 | $69B |
|
||
Price history
+420.0% since first listed17 events — show timeline
- 2026-03-17 Price Changed $299,000 Global MLS
- 2026-03-03 Listed $309,000 Global MLS
- 2023-03-31 Sold (Public Records) $279,000 Public Records
- 2023-01-28 Pending — Global MLS
- 2023-01-13 Listed $259,000 Global MLS
- 2020-11-10 Sold (Public Records) $203,500 Public Records
- 2020-10-27 Sold (MLS) $203,500 Global MLS
- 2020-09-01 Pending — Global MLS
- 2020-08-19 Listed $199,900 Global MLS
- 2017-12-12 Sold (Public Records) $137,500 Public Records
- 2017-10-04 Sold (MLS) $137,500 Global MLS
- 2017-09-06 Pending — Global MLS
- 2017-08-18 Listed $145,000 Global MLS
- 2017-08-14 Listing Removed — Global MLS
- 2017-07-29 Price Changed $150,000 Global MLS
- 2017-06-19 Listed $154,900 Global MLS
- 2017-01-09 Sold (Public Records) $57,500 Public Records
Property tax history
+6.3%/yrLatest (2025): $6,398 · -0.7% YoY. Source: county tax records.
Cash-flow waterfall
monthlySold comps — $/sqft
last 12 mo · ≤1 miLoading sold comps…