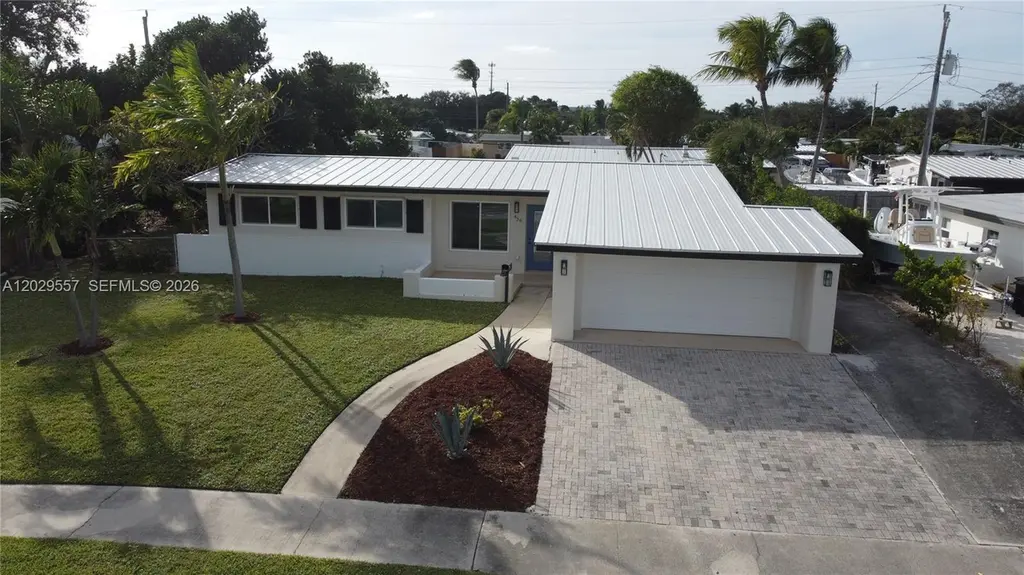
436 Gull Ct · North Palm Beach, FL
Flood risk 1/10 · Minimal
- FEMA flood zone
- X (unshaded)
- Chance of flooding over 30 yrs
- 0.0%
- Est. flood insurance / yr
- $507 – $1,088
Fire risk 1/10 · Minimal
- Est. fire insurance / yr
- $947 – $1,759
Heat risk 10/10 · Severe
- Hot days now (above 106°F)
- 7 days/yr
- Hot days in 30 yrs
- 25 days/yr
Wind risk 10/10 · Severe
- Chance of severe wind over 30 yrs
- 99.0%
Air-quality risk 2/10 · Minimal
- Unhealthy air days now
- 0 days/yr
- Unhealthy air days in 30 yrs
- 1 days/yr
Risk factors via First Street. Map © Google.
Why this score? — see what drove the D grade
The composite is a weighted blend of 9 inputs, each scored 0–100. Each bar is that input's sub-score; the figure is the points it added to the 100-point composite (weight × sub-score).
- Cash flow +12.5/30.0
- ARV discount +7.5/15.0
- Schools +4.3/10.0
- Livability +3.9/5.0
- 1% rule +3.8/10.0
- DSCR +3.7/10.0
- Rent growth +2.6/5.0
- Condition / age +2.5/5.0
- Appreciation +0.0/10.0
$580,000
🖨 Deal sheet 📄 Offer letter ✓ Due diligence
Listing remarks
Investor Special. Tenants in place. Seller Ready to Sell. 2023 Beautifully renovated 4 bedroom 2 bath with a 2 car garage. This lovely home features new tile floors throughout, paint inside and out. The kitchen has white wood cabinets, quartz counters, Stainless Steel appliances. Paver driveway. New impact windows and doors(2023). New metal roof (2023). Exterior paint (2025). Both bathrooms are updated. Master has a walk in closet. Master bath has double sinks and frame-less glass shower. sprinklers to keep yard nice and green. Close to the beach and the newly renovated North Palm Beach Country Club. Tenant Occupied. Rented for $3500 a month. Lease ends December 2026
Key facts
- New tile floors
- White wood cabinets
- Quartz counters
Tags
Property features AI
Exterior
- Parking: Detached 2-car garage; Driveway
- Security: Smoke detector(s)
- Utilities: Public water; Public sewer
- Home design: Single-story home; Faces east
- Construction: Block construction; Metal roof; Resale property
- Exterior features: Fenced yard; Patio
Interior
- Kitchen: Dishwasher; Electric range; Disposal; Microwave; Refrigerator
- Bedrooms: Bedroom located on the main level
- Flooring: Tile
- Bathrooms: 2 full bathrooms
- Heating & cooling: Central heating; Central air conditioning; Ceiling fan(s)
- Interior features: Impact-resistant windows; First-floor entry; Bedroom on main level; Smoke detector(s)
- Laundry & utility: Laundry room; Utility room
Neighborhood map
What this means for you Summary
Snapshot
- This is a 4-bed/2.0-bath single-family listed at $580k.
Deal economics
- At list price, monthly cash flow is $-84 ($-1k/yr) — negative.
- To cash-flow at today's rent, offer at most $565k (2.6% below list).
- To meet the 1% rule (rent ≥ 1% of price), the offer needs to be $509k (12.3% below list).
- Recommended offer: $509k (12.3% below list) — sets the bar for 1% rule.
Location & tenants
- Location reads 77/100 on livability (#184 in FL, #2,894 nationally) — a middle-class / working-renter tenant base. Strengths: crime A+, employment A+, housing A+; Watch: amenities F, commute F, cost of living D-.
- Palm Beach (suburban): math 46% / reading 53% proficiency, ranked #34 of 73 in FL (top 47%) — families likely to look elsewhere, expect single-tenant / working-renter base with shorter leases.
- Market conditions: Rents flat; 400 active listings in the ZIP; 32 comparable units currently listed for rent nearby; rentals at typical pace (median 24d on market — plan ~3-4 weeks tenant-placement turnaround); solid renter incomes; 3,974 units permitted in Palm Beach County in 2024 (1,012 in 5+ unit buildings).
- At $5,087/mo this rent would consume 66% of the median local household income ($92k/yr) (locally 835% of renters already pay >50% of income on rent) — very limited rent-growth headroom before tenants either downsize or default.
Forward outlook
- Local home prices are declining (-3.0%/yr); year-one equity from $4k of loan paydown is wiped out by about $17k of value loss. Plan a longer hold.
- Palm Beach County population projected at +30% by 2050 — long-run rental-demand tailwind backs the buy-and-hold thesis.
Negotiation context
- It's been on market 16 days — a 2% lower offer ($571k) is reasonable based on typical stale-listing flexibility.
- 11 sale attempts since 11y ago with the ask held roughly flat each time — persistent listings suggest the price (not the market) is what's stuck; bring a comps-based counter.
- Current owner paid $285k; list at $580k implies a 104% gain — meaningful room to come down on a strong offer.
Risks & watch-outs
- Watch-outs: built in 1959 — expect roof / HVAC / electrical / plumbing capex.
- Climate carrying-cost: severe wind risk, 99% chance of damaging wind over 30y; extreme-heat days projected 7→25/yr by 2055 (HVAC capex compounding) — expect insurance premiums to compound above CPI over the hold.
Questions for the listing agent
- What do current leases actually rent for vs. the listed asking? Can we see a recent rent roll and the last 12 months of T-12 income?
- Built in 1959 — when were the roof, HVAC, electrical panel, plumbing, and water heater last replaced?
- Is there a deadline driving the sale (1031 exchange, divorce, estate, relocation)? That informs how much negotiation room exists.
- Schools are A-rated — typically a magnet for longer-tenancy family renters. What's the average tenant stay here, and is there a school-zone premium baked into asking?
- The area grade is low — what's the realistic commute time and amenity access for the typical tenant pool here? Any planned neighborhood developments (good or bad) we should know about?
- What's the average days-on-market for RENTAL listings here right now (not sales)? A rising rental-DOM trend means longer vacancies and softer asking-rent achievability than the comps imply.
- What's the recent tenant-quality profile in this submarket — average credit score on applications, eviction rate, late-payment / NSF rate, and stable-employment percentage? A property-management company in the area should have these aggregated.
- How much new for-sale + rental construction is in the pipeline within 1–3 miles? Heavy new supply typically softens prices + rents 12–24 months out; constrained supply supports both.
Investment metrics
- 1% rule
- 0.88% ✗
- Cap rate
- 6.12%
- Cash-on-cash
- -0.62%
- DSCR
- 0.97
- GRM
- 9.5
CMA / ARV
No comps found within radius.
Projected returns pro-forma
-3.0% appreciation · 0.27% rent growth · sell at horizon
- IRR
- -20.5%
- Equity multiple
- 0.31×
- Total profit
- $-112,823
- Equity at exit
- $86,480
- IRR
- -21.5%
- Equity multiple
- 0.03×
- Total profit
- $-157,460
- Equity at exit
- $50,148
Cash invested: $162,400 (down + closing). Projections, not guarantees.
Landlord ↔ Tenant lean methodology
- Overall (STATE)
- 87 Strongly Landlord-Friendly
- State Florida
- 87 Strongly Landlord-Friendly · R+3
- County
- — inherits STATE
- City
- — inherits STATE
ZIP-level market 33408
- Rents YoY
- 0.3%
- Active inventory
- 400
- Price-to-rent
- 9.5×
Monthly cashflow live
- Estimated rent
- $5,087 high interval (Pro) →
- Mortgage (P&I)
- −$3,042
- Tax from tax record
- −$820 /mo · $9,839/yr
- Insurance
- −$242
- HOA
- −$0
- Vacancy / Maint / Mgmt
- −$1,068
- Net cashflow
- $-84
Break-even live
UW: 25.0% down · 7.5% · 30yr · 1.5% tax · 5.0% vac · 8.0% maint · 8.0% mgmt
Financing live
Cash to close
- Down payment
- $145,000
- Closing costs
- $17,400
- Reserves months
- —
- Total cash needed
- —
Loan-product check · same deal, 3 products live
Conventional
25% down · 7.5% · 30yr
- Down + closing
- —
- Monthly P&I
- —
- Monthly cashflow
- —
- DSCR
- —
- Eligible?
- —
Personal DTI + credit; lowest rate.
DSCR
20% down · 8.5% · 30yr
- Down + closing
- —
- Monthly P&I
- —
- Monthly cashflow
- —
- DSCR
- —
- Eligible?
- —
No personal income docs; deal must DSCR.
Hard money
10% down · 12.0% · 12mo
- Down + closing
- —
- Monthly P&I
- —
- Monthly cashflow
- —
- DSCR
- —
- Eligible?
- —
Short-term bridge; refi at stabilization.
Rent comps 32 comps
| Address | Beds | Baths | Sqft | Rent | $/sqft | DOM | Units | Dist |
|---|---|---|---|---|---|---|---|---|
| 2545 Conroy Dr West Palm Beach, FL | 3.0 | 2.0 | 1066 | $3,295 | $3.09 | 24d | 1 | 0.15mi |
| 2573 Conroy Dr West Palm Beach, FL | 5.0 | 3.0 | 2153 | $5,950 | $2.76 | 24d | 1 | 0.18mi |
| 624 Southwind Cir Unit 3 North Palm Beach, FL | 3.0 | 3.0 | 1316 | $5,500 | $4.18 | 24d | 1 | 0.32mi |
| 624 Southwind Cir Apt 4 North Palm Beach, FL | 3.0 | 2.0 | 1134 | $4,750 | $4.19 | 24d | 1 | 0.32mi |
| 620 Southwind Cir Unit A North Palm Beach, FL | 3.0 | 2.0 | 1697 | $4,200 | $2.47 | 24d | 1 | 0.34mi |
| 708 Westwind Dr North Palm Beach, FL | 3.0 | 2.0 | 1761 | $4,000 | $2.27 | 24d | 1 | 0.44mi |
| 913 Lighthouse Dr North Palm Beach, FL | 3.0 | 2.5 | 1092 | $5,900 | $5.40 | 24d | 1 | 0.48mi |
| 908 Lighthouse Dr North Palm Beach, FL | 3.0 | 2.0 | 1478 | $4,250 | $2.88 | 24d | 1 | 0.51mi |
| 712 Tradewind Dr North Palm Beach, FL | 4.0 | 3.0 | 1616 | $6,500 | $4.02 | 24d | 1 | 0.51mi |
| 736 Prosperity Farms Rd North Palm Beach, FL | 4.0 | 2.0 | 1556 | $6,950 | $4.47 | 24d | 1 | 0.54mi |
| 735 Tradewind Dr North Palm Beach, FL | 4.0 | 2.0 | 1901 | $6,700 | $3.52 | 24d | 1 | 0.55mi |
| 517 Gulf Rd North Palm Beach, FL | 3.0 | 2.0 | 1657 | $5,500 | $3.32 | 24d | 1 | 0.56mi |
| 547 Marlin Rd North Palm Beach, FL | 3.0 | 2.0 | 1880 | $9,900 | $5.27 | 24d | 1 | 0.64mi |
| 549 Fairwind Dr North Palm Beach, FL | 3.0 | 2.0 | 1498 | $5,000 | $3.34 | 24d | 1 | 0.64mi |
| 429 Inlet Rd North Palm Beach, FL | 3.0 | 2.5 | 1452 | $6,500 | $4.48 | 24d | 1 | 0.71mi |
| 756 Cinnamon Rd North Palm Beach, FL | 4.0 | 2.0 | 1324 | $6,600 | $4.98 | 24d | 1 | 0.72mi |
| 2539 Wabash Dr West Palm Beach, FL | 3.0 | 2.5 | 1468 | $5,500 | $3.75 | 24d | 1 | 0.83mi |
| 732 Pelican Way North Palm Beach, FL | 3.0 | 2.0 | 1728 | $4,950 | $2.86 | 24d | 1 | 0.88mi |
| 379 Garden Blvd Palm Beach Gardens, FL | 4.0 | 2.0 | 1642 | $4,500 | $2.74 | 24d | 1 | 1.01mi |
| 2745 Omega Pl North Palm Beach, FL | 4.0 | 2.0 | 2190 | $5,500 | $2.51 | 24d | 1 | 1.02mi |
| 855 Date Palm Dr West Palm Beach, FL | 3.0 | 3.0 | 1216 | $3,150 | $2.59 | 24d | 1 | 1.08mi |
| 10174 Plum St Palm Beach Gardens, FL | 3.0 | 2.0 | 1546 | $3,800 | $2.46 | 24d | 1 | 1.10mi |
| 343 Balsam St Palm Beach Gardens, FL | 4.0 | 2.0 | 1414 | $4,000 | $2.83 | 24d | 1 | 1.11mi |
| 337 Balsam St Palm Beach Gardens, FL | 4.0 | 2.0 | 1426 | $5,500 | $3.86 | 18d | 1 | 1.12mi |
| 10152 Aspen Way Palm Beach Gardens, FL | 3.0 | 2.5 | 2180 | $3,850 | $1.77 | 24d | 1 | 1.15mi |
| 301 Hawthorne Dr West Palm Beach, FL | 3.0 | 2.0 | 1402 | $3,200 | $2.28 | 24d | 1 | 1.15mi |
| 815 Silver Beach Rd Lake Park, FL | 4.0 | 3.0 | 1480 | $3,000 | $2.03 | 24d | 1 | 1.30mi |
| 1128 Rainwood Cir W Palm Beach Gardens, FL | 3.0 | 2.0 | 1650 | $4,200 | $2.55 | 22d | 1 | 1.32mi |
| 250 Foresteria Dr West Palm Beach, FL | 4.0 | 3.0 | 2080 | $11,500 | $5.53 | 20d | 1 | 1.36mi |
| 8617 Pluto Ter West Palm Beach, FL | 3.0 | 2.0 | 1560 | $3,999 | $2.56 | 24d | 1 | 1.46mi |
| 3836 Dove Landing Rd West Palm Beach, FL | 4.0 | 2.0 | 1790 | $3,400 | $1.90 | 7d | 1 | 1.47mi |
| 3836 Dove Landing Rd West Palm Beach, FL | 4.0 | 2.0 | 1790 | $3,400 | $1.90 | 24d | 1 | 1.47mi |
Listing history 12 events
-
2026-06-18days on market $580,000 Active 16 DOM
-
2026-06-17days on market $580,000 Active 15 DOM
-
2026-06-16days on market $580,000 Active 14 DOM
-
2026-06-15days on market $580,000 Active 13 DOM
-
2026-06-13days on market $580,000 Active 11 DOM
-
2026-06-09days on market $580,000 Active 7 DOM
-
2026-06-08days on market $580,000 Active 6 DOM
-
2026-06-07days on market $580,000 Active 5 DOM
-
2026-06-04remarks 675-char remark
-
2026-06-04days on market $580,000 Active 2 DOM
-
2026-06-02remarks 650-char remark
-
2026-06-02$580,000 Active 1 DOM
ⓘ Source: listings_history table (triggers on properties + properties_extension) + one-shot
backfill from property_details.listing_events for pre-trigger history.
Tax reassessment forecast FL · Resets to sale price
- Current annual tax
- $9,839 · $820/mo
- Projected year-2 tax
- $9,839 · $820/mo
- Expected delta
- $0/yr ($0/mo · 0.0%)
ⓘ Screening estimate from a state-policy table — verify with the county assessor before closing.
Climate risk First Street
- Flood 1/10 Low FEMA zone X (unshaded) · 0% chance over 30 yrs
- Wildfire 1/10 Low
- Heat 10/10 Extreme 7 d/yr ≥106°F today · 25 d/yr by 30 yrs out
- Wind 10/10 Extreme 99% chance of damaging wind over 30 yrs
- Air quality 2/10 Low 0 unhealthy d/yr today · 1 by 30 yrs out
Nearby sold comps map
Loading sold comps map…
Walkable amenities ~0.75 mi
Loading nearby amenities…
Taxation est. · year 1
- Rental income
- $61,046
- − Mortgage interest
- −$32,489
- − Property taxes
- −$9,839
- − Insurance
- −$2,900
- − Repairs & maintenance
- −$4,884
- − Management
- −$4,884
- − Depreciation
- −$16,873
- Taxable loss
- −$10,822
- Est. tax savings @ 24.0%
- +$2,597
- After-tax cash flow
- $1,586/yr
For passive investors: Depreciation is non-cash, so a rental often shows a tax loss while cash-flowing — sheltering income. Rental losses are passive: they offset passive income freely, and up to $25,000/yr can offset ordinary (W-2) income if you actively participate and your MAGI is under $100k (phasing out to $0 by $150k); unused losses carry forward. On sale, claimed depreciation is recaptured at up to 25%, and gains may owe capital-gains tax (a 1031 exchange can defer both). Figures are a year-1 estimate at your 24.0% rate — not tax advice; consult a CPA.
Schools (NCES district)
- District
- Palm Beach
- NCES district ID
- 1201500
- Math proficiency
- 46% ▼ -16.00%
- Reading proficiency
- 53% ▼ -4.00%
- Median HH income
- $53,943
- Composite
- 42.72/100
- National rank
- #3160
- State rank
- #34 of 73 in FL
Livability — North Palm Beach
- Score
- 77/100
- State rank
- #184
- US rank
- #2894
Category grades
Schools grade is shown separately in the Schools card above.
Census & demographics
- Census place
- North Palm Beach, FL
- County
- Palm Beach County · 1,438,312 people
- City population
- 18,817
- Metro
- Miami-Fort Lauderdale-Pompano Beach, FL
- Population (ZIP)
- 18,817
- Household income
- $92,216
- Rent vs Own
- Severe rent burden
- 835.0
Population outlook (Palm Beach County) Hauer SSP2
- Today (2025)
- 1,637,487 people
- By 2030
- 1,743,255 · +6.5%
- By 2040
- 1,948,712 · +19.0%
- By 2050
- 2,132,979 · +30.3%
- By 2075
- 2,530,027 · +54.5%
- By 2100
- 2,706,979 · +65.3%
Race, ethnicity, and origin ACS 2023
- Neighborhood character
- Predominantly White (86%)
- Race & ethnicity
- White 86% Hispanic / Latino 9% Two or more races 7% Black 1% Asian 1%
- Hispanic origin (detail)
- Puerto Rican 2% Cuban 2%
- Common ancestry
- Lithuanian 4% Slovak 3% Romanian 3%
- Foreign-born
- 11% · Canada, Jamaica, Guatemala
- Languages at home
- 89% English-only · Spanish 7% Other Indo-European 1% French/Haitian/Cajun 1%
Political lean MEDSL · Palm Beach
- 2024 margin
- Toss-up / Even · D 50.0% · R 49.2%
- 2008→2024 swing
- -22.1pp toward R · 2008: 22.9pp · 2024: 0.8pp
- All cycles
- 2024: D+0.8 2020: D+12.8 2016: D+15.3 2012: D+17.0 2008: D+22.9
Not yet ingested
- Civics
- —
Market trends
- HPI YoY
- ▼ -223.14%
- Current HPI
- 365.2913
- Rent YoY
- ▲ 0.27%
- Metro
- Miami-Fort Lauderdale-Pompano Beach, FL
- State GDP YoY
- ▲ 3.28%
- F500 in state
- 36
Industry mix (Fortune 500 HQ in FL)
| Industry | F500 HQs | Revenue |
|---|---|---|
| Industrial Technology | 2 | $29B |
|
||
| Insurance | 2 | $17B |
|
||
| Retail | 1 | $60B |
|
||
| Technology Distribution | 1 | $58B |
|
||
| Homebuilding | 1 | $35B |
|
||
| Technology Manufacturing | 1 | $35B |
|
||
Price history
+205.3% since first listed51 events — show timeline
- 2026-06-02 Listed $580,000 MARMLS
- 2025-12-09 Listing Removed — MARMLS
- 2025-11-22 Rental Removed $3,500 MARMLS
- 2025-11-17 Price Changed $580,000 MARMLS
- 2025-11-17 Listed for Rent $3,500 MARMLS
- 2025-11-03 Listed $595,000 MARMLS
- 2025-10-28 Rental Removed $3,650 MARMLS
- 2025-10-17 Listing Removed — MARMLS
- 2025-10-08 Price Changed $3,650 MARMLS
- 2025-09-29 Price Changed $599,000 MARMLS
- 2025-09-10 Price Changed $628,800 MARMLS
- 2025-09-04 Price Changed $3,700 MARMLS
- 2025-08-25 Price Changed $638,000 MARMLS
- 2025-08-23 Listed for Rent $3,950 MARMLS
- 2025-07-27 Price Changed $645,000 MARMLS
- 2025-05-29 Price Changed $649,888 MARMLS
- 2025-04-29 Price Changed $655,500 MARMLS
- 2025-03-31 Price Changed $658,800 MARMLS
- 2025-03-25 Price Changed $667,000 MARMLS
- 2025-01-29 Price Changed $668,000 MARMLS
- 2025-01-01 Listed $675,000 MARMLS
- 2024-01-26 Rental Removed $3,600 MARMLS
- 2024-01-25 Listing Removed — MARMLS
- 2024-01-02 Price Changed $680,000 MARMLS
- 2023-12-19 Price Changed $690,000 MARMLS
- 2023-11-22 Price Changed $694,888 MARMLS
- 2023-11-09 Listed for Rent $3,600 MARMLS
- 2023-10-09 Price Changed $698,888 MARMLS
- 2023-09-07 Price Changed $702,800 MARMLS
- 2023-09-01 Price Changed $712,800 MARMLS
- 2023-08-21 Price Changed $714,800 MARMLS
- 2023-08-07 Price Changed $719,900 MARMLS
- 2023-07-25 Price Changed $725,000 MARMLS
- 2023-07-07 Price Changed $735,800 MARMLS
- 2023-06-15 Listed $742,800 MARMLS
- 2023-05-09 Listing Removed — MARMLS
- 2023-05-01 Price Changed $656,800 MARMLS
- 2023-03-04 Listed $658,888 MARMLS
- 2021-06-30 Sold (Public Records) $285,000 Public Records
- 2019-06-14 Listing Removed — Beaches MLS
- 2019-06-14 Contingent — Beaches MLS
- 2019-06-11 Price Changed $299,000 Beaches MLS
- 2019-05-28 Listed $319,000 Beaches MLS
- 2016-01-04 Sold (Public Records) $280,000 Public Records
- 2015-12-31 Sold (MLS) $280,000 Beaches MLS
- 2015-12-17 Pending — Beaches MLS
- 2015-11-24 Contingent — Beaches MLS
- 2015-11-21 Relisted — Beaches MLS
- 2015-10-08 Contingent — Beaches MLS
- 2015-09-20 Listed $289,900 Beaches MLS
- 2015-07-06 Sold (Public Records) $190,000 Public Records
Property tax history
+12.7%/yrLatest (2025): $9,839 · +1.6% YoY. Source: county tax records.
Cash-flow waterfall
monthlySold comps — $/sqft
last 12 mo · ≤1 miLoading sold comps…