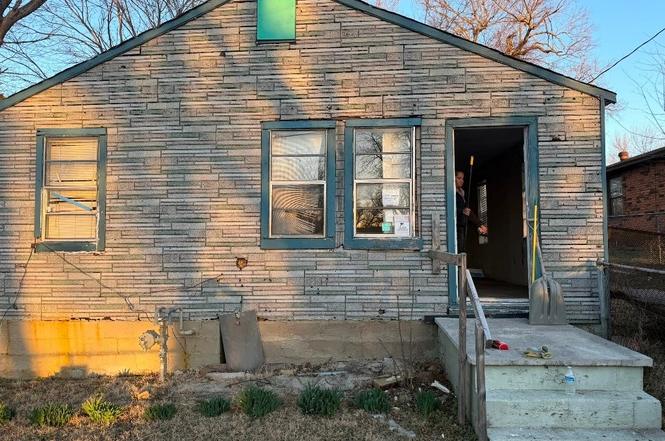
4527 S Waco Ave · Tulsa, OK
Flood risk 1/10 · Minimal
- FEMA flood zone
- X (unshaded)
- Chance of flooding over 30 yrs
- 0.0%
- Est. flood insurance / yr
- $507 – $1,088
Fire risk 5/10 · Moderate
- Est. fire insurance / yr
- $2,463 – $4,575
Heat risk 6/10 · Moderate
- Hot days now (above 111°F)
- 7 days/yr
- Hot days in 30 yrs
- 18 days/yr
Wind risk 3/10 · Minor
- Chance of severe wind over 30 yrs
- 4.0%
Air-quality risk 3/10 · Minor
- Unhealthy air days now
- 2 days/yr
- Unhealthy air days in 30 yrs
- 3 days/yr
Risk factors via First Street. Map © Google.
Why this score? — see what drove the B- grade
The composite is a weighted blend of 9 inputs, each scored 0–100. Each bar is that input's sub-score; the figure is the points it added to the 100-point composite (weight × sub-score).
- Cash flow +30.0/30.0
- 1% rule +10.0/10.0
- DSCR +10.0/10.0
- ARV discount +7.5/15.0
- Livability +3.8/5.0
- Rent growth +2.7/5.0
- Condition / age +2.5/5.0
- Schools +0.8/10.0
- Appreciation +0.0/10.0
$44,500
🖨 Deal sheet 📄 Offer letter ✓ Due diligence
Listing remarks MLS
HAS FENCED YARD THIRD BEDROOM BEING USED AS UTILITY ROOM UTILITY HOOK-UP ALSO IN KITCHEN. ROOF NEW IN 97 WINDOW AIR, FLOOR FURNACE, STORAGE BUILDING
Key facts
- Solid bones
- Functional layout
- 7,200 sq ft lot
Tags
Property features AI
Exterior
- Security: No safety shelter
- Utilities: Public water; Public sewer
- Home design: Single-story home; Faces west; Crawlspace foundation
- Construction: Wood frame construction; Asphalt/fiberglass roof
- Exterior features: Chain link fencing; No other exterior features listed
Interior
- Kitchen: Eat-in kitchen; Gas range connection
- Bedrooms: Master bedroom (first level); Two additional bedrooms (first level)
- Flooring: Carpet; Hardwood
- Bathrooms: 1 full bathroom
- Interior features: Aluminum window frames; Gas range connection; No additional built-in interior features listed
- Laundry & utility: Utility room (first level); Electric dryer hookup
Neighborhood map
What this means for you Summary
Snapshot
- This is a 3-bed/1.0-bath single-family listed at $44k.
Deal economics
- At list price, monthly cash flow is $661 ($8k/yr) — positive.
- The deal already cash-flows at list — no discount required.
- Meets the 1% rule at list price ($1k rent vs $44k).
- Recommended offer: $40k (9.0% below list) — sets the bar for market timing.
- Cap rate 24.1% vs local median 3.9% in Tulsa — top-decile yield for the area; either an underpriced asset or a hidden risk that comps aren't pricing in. Stress-test before assuming the spread holds.
Location & tenants
- Location reads 75/100 on livability (#13 in OK, #4,058 nationally) — a middle-class / working-renter tenant base. Strengths: amenities A+, commute A+, cost of living A+; Watch: schools F, crime F, employment D-.
- Tulsa (urban): math 7% / reading 12% proficiency, ranked #250 of 270 in OK (top 93%) — low school quality limits family demand, transient renter base, plan for 1-2y turnover; 76% free/reduced lunch — lower-income household profile, screen leases tightly.
- Market conditions: Rents flat; 99 active listings in the ZIP; 8 comparable units currently listed for rent nearby; rentals at typical pace (median 15d on market — plan ~3-4 weeks tenant-placement turnaround); 2,818 units permitted in Tulsa County in 2024 (518 in 5+ unit buildings).
Forward outlook
- Local home prices are declining (-3.0%/yr); year-one equity from $308 of loan paydown is wiped out by about $1k of value loss. Plan a longer hold.
- Tulsa County population projected at +30% by 2050 — long-run rental-demand tailwind backs the buy-and-hold thesis.
- At projected returns (-3.0% appreciation + 0.8% rent growth), your $12k cash investment doubles in ~2 years — after that, you're playing with house money.
Negotiation context
- It's been on market 115 days — a 9% lower offer ($40k) is reasonable based on typical stale-listing flexibility.
- 4 sale attempts since 32y ago; this cycle's ask has dropped $5k (11%) from the opening price — seller is motivated, your offer sets the floor, not the list.
- Current owner paid $34k; 29% above their basis — modest negotiation headroom, anchor on the comps not their cost.
Risks & watch-outs
- Watch-outs: built in 1954 — expect roof / HVAC / electrical / plumbing capex.
- Climate carrying-cost: moderate wildfire risk; extreme-heat days projected 7→18/yr by 2055 (HVAC capex compounding) — expect insurance premiums to compound above CPI over the hold.
Questions for the listing agent
- It's been on market 115 days. Have you received any prior offers? Is the seller open to a 9% concession, seller financing, or rate buy-down credit?
- Built in 1954 — when were the roof, HVAC, electrical panel, plumbing, and water heater last replaced?
- Why hasn't it sold? Are there any deal-killer items the seller is aware of (foundation, flood, title, zoning, code violations)?
- Is there a deadline driving the sale (1031 exchange, divorce, estate, relocation)? That informs how much negotiation room exists.
- Schools are F-rated, which usually means shorter tenancies and higher turnover. Who's the typical renter profile here, and what's been the actual vacancy rate?
- Crime grade is F in this area — have there been break-ins, vandalism, or insurance claims at this property in the last 3 years? What carrier currently insures it and at what premium?
- What's the average days-on-market for RENTAL listings here right now (not sales)? A rising rental-DOM trend means longer vacancies and softer asking-rent achievability than the comps imply.
- What's the recent tenant-quality profile in this submarket — average credit score on applications, eviction rate, late-payment / NSF rate, and stable-employment percentage? A property-management company in the area should have these aggregated.
- How much new for-sale + rental construction is in the pipeline within 1–3 miles? Heavy new supply typically softens prices + rents 12–24 months out; constrained supply supports both.
Investment metrics
- 1% rule
- 2.76% ✓
- Cap rate
- 24.11%
- Cash-on-cash
- 63.62%
- DSCR
- 3.83
- GRM
- 3.0
CMA / ARV
- ARV (on-the-fly)
- $148,296
- Comps found
- 12
Show comp detail 12 sales within ~0.75 mi
| Address | Dist | Beds/Ba | Sqft | Sold | Price | $/sf | Match |
|---|---|---|---|---|---|---|---|
| 1934 W 46th Pl | 0.13mi | 3/1.0 | 912 (+3%) | 2mo | $143,000 | $157 | 88 |
| 1908 W 47th Pl | 0.21mi | 3/1.0 | 888 (0%) | 5mo | $132,000 | $149 | 86 |
| 4532 S Xenophon Ave | 0.09mi | 2/1.0 (-1) | 900 (+1%) | 6mo | $150,000 | $167 | 84 |
| 2114 W 45th Pl | 0.17mi | 3/1.0 | 912 (+3%) | 6mo | $80,000 | $88 | 82 |
| 4634 S Vancouver Ave | 0.12mi | 2/1.0 (-1) | 880 (-1%) | 7mo | $150,000 | $170 | 82 |
| 4928 S 24th WestPlace | 0.57mi | 3/1.0 | 936 (+5%) | 1mo | $135,000 | $144 | 64 |
| 2312 W 47th Pl | 0.36mi | 2/1.0 (-1) | 842 (-5%) | 6mo | $149,000 | $177 | 64 |
| 4016 S 23rd West Ave | 0.58mi | 2/1.0 (-1) | 820 (-8%) | 0mo | $150,000 | $183 | 55 |
| 4602 S 29th WestAvenue | 0.65mi | 2/1.0 (-1) | 955 (+8%) | 2mo | $138,000 | $145 | 50 |
| 4220 S Zenith Ave | 0.36mi | 2/1.0 (-1) | 1,000 (+13%) | 11mo | $200,000 | $200 | 48 |
| 2908 W 48th St | 0.71mi | 2/1.0 (-1) | 924 (+4%) | 12mo | $140,000 | $152 | 45 |
| 4813 S Maybelle Ave | 0.70mi | 3/1.0 | 1,003 (+13%) | 12mo | $168,000 | $167 | 36 |
Match score weights: distance 35% · size 25% · config 20% · recency 20%. Top-matched comps best support the ARV.
Projected returns pro-forma
-3.0% appreciation · 0.78% rent growth · sell at horizon
- IRR
- 60.1%
- Equity multiple
- 3.58×
- Total profit
- $32,196
- Equity at exit
- $6,635
- IRR
- 64.0%
- Equity multiple
- 6.76×
- Total profit
- $71,747
- Equity at exit
- $3,848
Cash invested: $12,460 (down + closing). Projections, not guarantees.
Landlord ↔ Tenant lean methodology
- Overall (STATE)
- 83 Strongly Landlord-Friendly
- State Oklahoma
- 83 Strongly Landlord-Friendly · R+20
- County
- — inherits STATE
- City
- — inherits STATE
ZIP-level market 74107
- Home prices YoY
- -15.3%
- Rents YoY
- 0.8%
- Active inventory
- 99
- Price-to-rent
- 3.0×
Monthly cashflow live
- Estimated rent
- $1,230 high interval (Pro) →
- Mortgage (P&I)
- −$233
- Tax from tax record
- −$59 /mo · $713/yr
- Insurance
- −$19
- HOA
- −$0
- Vacancy / Maint / Mgmt
- −$258
- Net cashflow
- $661
Break-even live
UW: 25.0% down · 7.5% · 30yr · 1.5% tax · 5.0% vac · 8.0% maint · 8.0% mgmt
Financing live
Cash to close
- Down payment
- $11,125
- Closing costs
- $1,335
- Reserves months
- —
- Total cash needed
- —
Loan-product check · same deal, 3 products live
Conventional
25% down · 7.5% · 30yr
- Down + closing
- —
- Monthly P&I
- —
- Monthly cashflow
- —
- DSCR
- —
- Eligible?
- —
Personal DTI + credit; lowest rate.
DSCR
20% down · 8.5% · 30yr
- Down + closing
- —
- Monthly P&I
- —
- Monthly cashflow
- —
- DSCR
- —
- Eligible?
- —
No personal income docs; deal must DSCR.
Hard money
10% down · 12.0% · 12mo
- Down + closing
- —
- Monthly P&I
- —
- Monthly cashflow
- —
- DSCR
- —
- Eligible?
- —
Short-term bridge; refi at stabilization.
Rent comps 8 comps
| Address | Beds | Baths | Sqft | Rent | $/sqft | DOM | Units | Dist |
|---|---|---|---|---|---|---|---|---|
| 1913 W 50th St Tulsa, OK | 3.0 | 2.0 | 1082 | $1,195 | $1.10 | 23d | 1 | 0.43mi |
| 4831 S 30th West Ave Tulsa, OK | 2.0 | 1.0 | 748 | $1,250 | $1.67 | 3d | 1 | 0.74mi |
| 4956 S Maybelle Ave Tulsa, OK | 3.0 | 1.0 | 933 | $1,395 | $1.50 | 14d | 1 | 0.80mi |
| 5031 S 30th West Ave Tulsa, OK | 2.0 | 1.0 | 987 | $1,095 | $1.11 | 21d | 1 | 0.80mi |
| 4847 S 32nd West Ave Tulsa, OK | 3.0 | 1.0 | 876 | $1,200 | $1.37 | 16d | 1 | 0.87mi |
| 4128 S 32nd West Ave Tulsa, OK | 3.0 | 1.0 | 957 | $1,175 | $1.23 | 1d | 1 | 0.93mi |
| 3722 W 44th St Tulsa, OK | 3.0 | 1.0 | 1043 | $1,150 | $1.10 | 1d | 1 | 1.19mi |
| 3743 W 42nd Pl Tulsa, OK | 2.0 | 1.0 | 856 | $1,000 | $1.17 | 1d | 1 | 1.26mi |
Listing history 23 events
-
2026-06-18days on market $44,500 Active 115 DOM
-
2026-06-17days on market $44,500 Active 114 DOM
-
2026-06-16days on market $44,500 Active 113 DOM
-
2026-06-15days on market $44,500 Active 112 DOM
-
2026-06-13pricedays on market $44,500 Active 110 DOM
-
2026-06-10days on market $49,900 Active 107 DOM
-
2026-06-09days on market $49,900 Active 106 DOM
-
2026-06-08days on market $49,900 Active 105 DOM
-
2026-06-07days on market $49,900 Active 104 DOM
-
2026-06-05days on market $49,900 Active 101 DOM
-
2026-06-03days on market $49,900 Active 100 DOM
-
2026-06-02days on market $49,900 Active 99 DOM
-
2026-06-01days on market $49,900 Active 98 DOM
-
2026-05-31days on market $49,900 Active 97 DOM
-
2026-02-23$49,900 Active
-
1998-07-16soldstatus $34,500
-
1998-07-01soldstatus $33,900 148-char remark
Show marketing remark (148 chars)
HAS FENCED YARD THIRD BEDROOM BEING USED AS UTILITY ROOM UTILITY HOOK-UP ALSO IN KITCHEN. ROOF NEW IN 97 WINDOW AIR, FLOOR FURNACE, STORAGE BUILDING
-
1998-05-20historical 148-char remark
Show marketing remark (148 chars)
HAS FENCED YARD THIRD BEDROOM BEING USED AS UTILITY ROOM UTILITY HOOK-UP ALSO IN KITCHEN. ROOF NEW IN 97 WINDOW AIR, FLOOR FURNACE, STORAGE BUILDING
-
1998-03-28$33,500 148-char remark
Show marketing remark (148 chars)
HAS FENCED YARD THIRD BEDROOM BEING USED AS UTILITY ROOM UTILITY HOOK-UP ALSO IN KITCHEN. ROOF NEW IN 97 WINDOW AIR, FLOOR FURNACE, STORAGE BUILDING
-
1998-03-09historical
-
1997-09-09$35,000
-
1995-05-29historical
-
1994-11-29$31,000
ⓘ Source: listings_history table (triggers on properties + properties_extension) + one-shot
backfill from property_details.listing_events for pre-trigger history.
Tax reassessment forecast OK · Resets to sale price
- Current annual tax
- $713 · $59/mo
- Projected year-2 tax
- $713 · $59/mo
- Expected delta
- $0/yr ($0/mo · 0.0%)
ⓘ Screening estimate from a state-policy table — verify with the county assessor before closing.
Climate risk First Street
- Flood 1/10 Low FEMA zone X (unshaded) · 0% chance over 30 yrs
- Wildfire 5/10 Major
- Heat 6/10 Major 7 d/yr ≥111°F today · 18 d/yr by 30 yrs out
- Wind 3/10 Moderate 4% chance of damaging wind over 30 yrs
- Air quality 3/10 Moderate 2 unhealthy d/yr today · 3 by 30 yrs out
Nearby sold comps map
Loading sold comps map…
Walkable amenities ~0.75 mi
Loading nearby amenities…
Taxation est. · year 1
- Rental income
- $14,764
- − Mortgage interest
- −$2,493
- − Property taxes
- −$713
- − Insurance
- −$222
- − Repairs & maintenance
- −$1,181
- − Management
- −$1,181
- − Depreciation
- −$1,295
- Taxable income
- $7,679
- Est. tax owed @ 24.0%
- −$1,843
- After-tax cash flow
- $6,085/yr
For passive investors: Depreciation is non-cash, so a rental often shows a tax loss while cash-flowing — sheltering income. Rental losses are passive: they offset passive income freely, and up to $25,000/yr can offset ordinary (W-2) income if you actively participate and your MAGI is under $100k (phasing out to $0 by $150k); unused losses carry forward. On sale, claimed depreciation is recaptured at up to 25%, and gains may owe capital-gains tax (a 1031 exchange can defer both). Figures are a year-1 estimate at your 24.0% rate — not tax advice; consult a CPA.
Schools (NCES district)
- District
- Tulsa
- NCES district ID
- 4030240
- Math proficiency
- 7% ▼ -9.00%
- Reading proficiency
- 12% ▼ -7.00%
- Median HH income
- $37,895
- Composite
- 8.04/100
- National rank
- #9919
- State rank
- #250 of 270 in OK
Livability — Tulsa
- Score
- 75/100
- State rank
- #13
- US rank
- #4058
Category grades
Schools grade is shown separately in the Schools card above.
Census & demographics
- Census place
- Tulsa, OK
- County
- Tulsa County · 640,811 people
- City population
- 389,418
- Metro
- Tulsa, OK
- Population (ZIP)
- 19,013
- Household income
- $53,505
- Rent vs Own
- Severe rent burden
- 667.0
Population outlook (Tulsa County) Hauer SSP2
- Today (2025)
- 723,846 people
- By 2030
- 766,033 · +5.8%
- By 2040
- 851,386 · +17.6%
- By 2050
- 938,389 · +29.6%
- By 2075
- 1,166,011 · +61.1%
- By 2100
- 1,350,277 · +86.5%
Race, ethnicity, and origin ACS 2023
- Neighborhood character
- Diverse neighborhood (Simpson 0.63)
- Race & ethnicity
- White 59% Two or more races 18% Hispanic / Latino 11% Black 8% Native American 6% Pacific Islander 2% Asian 1%
- Hispanic origin (detail)
- Mexican 8% Puerto Rican 1%
- Common ancestry
- Lithuanian 2% Slovak 2% Italian 1%
- Foreign-born
- 4% · Canada
- Languages at home
- 90% English-only · Spanish 7% Other Asian/Pacific 2%
Political lean MEDSL · Tulsa
- 2024 margin
- R (+15.2) · D 41.3% · R 56.5% · Other 2.2%
- 2008→2024 swing
- +9.2pp toward D · 2008: -24.5pp · 2024: -15.2pp
- All cycles
- 2024: R+15.2 2020: R+15.6 2016: R+22.9 2012: R+27.4 2008: R+24.5
Not yet ingested
- Civics
- —
Market trends
- HPI YoY
- ▼ -42.46%
- Current HPI
- 235.2296
- Rent YoY
- ▲ 0.78%
- Metro
- Tulsa, OK
- State GDP YoY
- ▲ 1.55%
- F500 in state
- 6
Industry mix (Fortune 500 HQ in OK)
| Industry | F500 HQs | Revenue |
|---|---|---|
| Energy | 3 | $48B |
|
||
Price history
+61.0% since first listed9 events — show timeline
- 2026-02-23 Listed $49,900 MLS Technology, Inc.
- 1998-07-16 Sold (Public Records) $34,500 Public Records
- 1998-07-01 Sold (MLS) $33,900 MLS Technology, Inc.
- 1998-05-20 Listing Removed — MLS Technology, Inc.
- 1998-03-28 Listed $33,500 MLS Technology, Inc.
- 1998-03-09 Listing Removed — MLS Technology, Inc.
- 1997-09-09 Listed $35,000 MLS Technology, Inc.
- 1995-05-29 Listing Removed — MLS Technology, Inc.
- 1994-11-29 Listed $31,000 MLS Technology, Inc.
Property tax history
+7.6%/yrLatest (2025): $713 · +8.7% YoY. Source: county tax records.
Cash-flow waterfall
monthlySold comps — $/sqft
last 12 mo · ≤1 miLoading sold comps…