10501 Johnson Hollow Rd · Pea Ridge, AR
Flood risk 8/10 · Major
- FEMA flood zone
- X (unshaded)
- Chance of flooding over 30 yrs
- 0.99%
- Est. flood insurance / yr
- $507 – $1,088
Fire risk 4/10 · Minor
- Est. fire insurance / yr
- $1,499 – $2,785
Heat risk 4/10 · Minor
- Hot days now (above 104°F)
- 7 days/yr
- Hot days in 30 yrs
- 21 days/yr
Wind risk 2/10 · Minimal
- Chance of severe wind over 30 yrs
- 2.0%
Air-quality risk 2/10 · Minimal
- Unhealthy air days now
- 1 days/yr
- Unhealthy air days in 30 yrs
- 1 days/yr
Risk factors via First Street. Map © Google.
Why this score? — see what drove the C- grade
The composite is a weighted blend of 9 inputs, each scored 0–100. Each bar is that input's sub-score; the figure is the points it added to the 100-point composite (weight × sub-score).
- Cash flow +13.8/30.0
- ARV discount +9.4/15.0
- Appreciation +8.7/10.0
- DSCR +4.2/10.0
- 1% rule +3.9/10.0
- Schools +3.7/10.0
- Livability +3.4/5.0
- Rent growth +2.5/5.0
- Condition / age +2.5/5.0
$225,000
🖨 Deal sheet 📄 Offer letter ✓ Due diligence
Listing remarks MLS
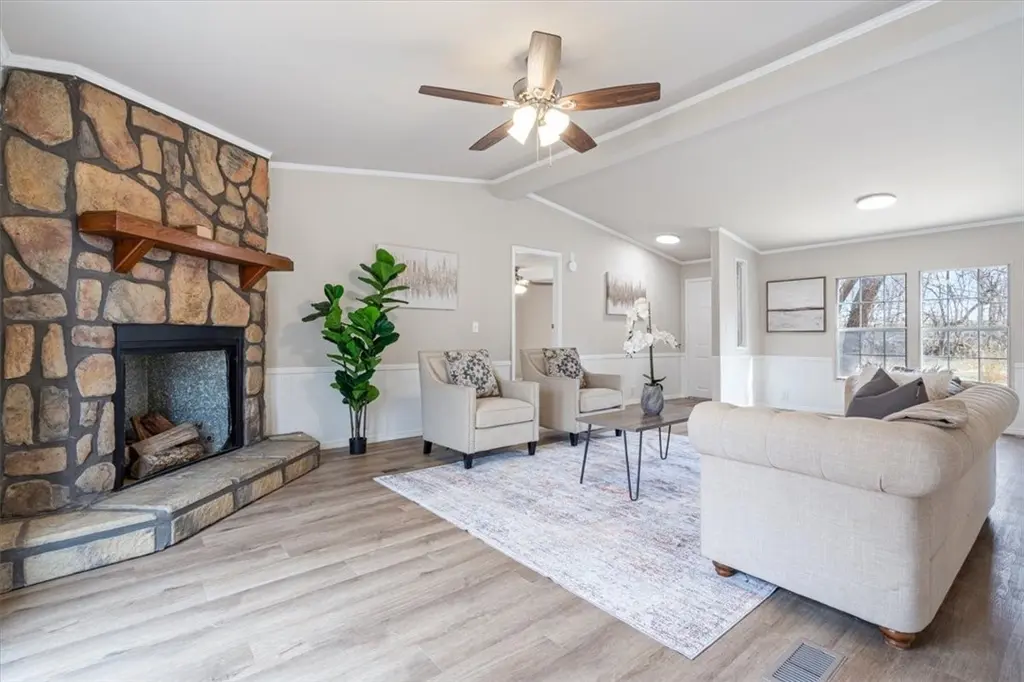
Edge of town, country vibes, private & discreet--the one you've been looking for! Come see this remodeled home featuring new paint, new floors, new fixtures, new appliances, new trim, new decks----the only thing this home is missing is NEW OWNERS! Large backyard with runoff creek & bridge; great for childhood adventures! 3 outbuildings give you space to setup your next workshop & project space. Circle drive, natural light, come see to believe.
Key facts
- Large backyard
- Outbuildings
- Circle drive
Tags
Neighborhood map
What this means for you Summary
Snapshot
- This is a 3-bed/2.0-bath manufactured listed at $225k.
Deal economics
- At list price, monthly cash flow is $-44 ($-531/yr) — negative.
- To cash-flow at today's rent, offer at most $219k (2.8% below list).
- To meet the 1% rule (rent ≥ 1% of price), the offer needs to be $200k (11.3% below list).
- Recommended offer: $200k (11.3% below list) — sets the bar for 1% rule.
- Cap rate 6.4% vs local median 3.4% in Pea Ridge — top-decile yield for the area; either an underpriced asset or a hidden risk that comps aren't pricing in. Stress-test before assuming the spread holds.
Location & tenants
- Location reads 67/100 on livability (#98 in AR) — a middle-class / working-renter tenant base. Strengths: employment A+, housing A+, cost of living A-; Watch: amenities F, commute F.
- Pea Ridge School District (suburban): math 43% / reading 42% proficiency, ranked #43 of 238 in AR (top 18%) — families likely to look elsewhere, expect single-tenant / working-renter base with shorter leases.
- Market conditions: 423 active listings in the ZIP; 18 comparable units currently listed for rent nearby; rentals lingering (median 44d on market — plan ~5-8 weeks vacancy on turnover, expect pricing pressure); 56% of comp listings sitting > 30 days — soft ceiling on asking rent; solid renter incomes; 4,359 units permitted in Benton County in 2024 (402 in 5+ unit buildings).
Forward outlook
- In year one you build about $18k of equity ($2k loan paydown + $17k appreciation (7.5% local appreciation)).
- Benton County population projected at +56% by 2050 — long-run rental-demand tailwind backs the buy-and-hold thesis.
- At projected returns (7.5% appreciation + 3.0% rent growth), your $63k cash investment doubles in ~4 years — after that, you're playing with house money.
- By year 3, paydown + projected appreciation supports a ~$46k cash-out refi (75% LTV) — recoverable capital for the next deal without selling this one.
Negotiation context
- It's been on market 34 days — a 3% lower offer ($218k) is reasonable based on typical stale-listing flexibility.
- 2 sale attempts with the ask held roughly flat each time — persistent listings suggest the price (not the market) is what's stuck; bring a comps-based counter.
- Current owner paid $92k; list at $225k implies a 145% gain — meaningful room to come down on a strong offer.
Risks & watch-outs
- Watch-outs: flood insurance adds $66/mo.
- Climate carrying-cost: severe flood risk — expect insurance premiums to compound above CPI over the hold.
Questions for the listing agent
- What do current leases actually rent for vs. the listed asking? Can we see a recent rent roll and the last 12 months of T-12 income?
- It's been on market 34 days. Have you received any prior offers? Is the seller open to a 11% concession, seller financing, or rate buy-down credit?
- What's the actual annual flood-insurance premium (NFIP or private), and is the property in a SFHA with mandatory coverage?
- Is there a deadline driving the sale (1031 exchange, divorce, estate, relocation)? That informs how much negotiation room exists.
- What's the average days-on-market for RENTAL listings here right now (not sales)? A rising rental-DOM trend means longer vacancies and softer asking-rent achievability than the comps imply.
- What's the recent tenant-quality profile in this submarket — average credit score on applications, eviction rate, late-payment / NSF rate, and stable-employment percentage? A property-management company in the area should have these aggregated.
- How much new for-sale + rental construction is in the pipeline within 1–3 miles? Heavy new supply typically softens prices + rents 12–24 months out; constrained supply supports both.
Investment metrics
- 1% rule
- 0.89% ✗
- Cap rate
- 6.41%
- Cash-on-cash
- 0.42%
- DSCR
- 1.02
- GRM
- 9.4
CMA / ARV
- ARV (median comp)
- $234,900
- List price
- $225,000
- Delta
- -4.21%
- Verdict
- FAIR
- Comps
- 3 within 2.0 mi
Show comp detail 1 sale within ~0.75 mi
| Address | Dist | Beds/Ba | Sqft | Sold | Price | $/sf | Match |
|---|---|---|---|---|---|---|---|
| 10501 Johnson Hollow Rd | 0.00mi | 3/2.0 | 1,792 (+15%) | 1mo | $234,900 | $131 | 74 |
Match score weights: distance 35% · size 25% · config 20% · recency 20%. Top-matched comps best support the ARV.
Projected returns pro-forma
7.48% appreciation · 3.0% rent growth · sell at horizon
- IRR
- 18.2%
- Equity multiple
- 2.31×
- Total profit
- $82,469
- Equity at exit
- $162,994
- IRR
- 17.3%
- Equity multiple
- 4.83×
- Total profit
- $241,496
- Equity at exit
- $316,244
Cash invested: $63,000 (down + closing). Projections, not guarantees.
Landlord ↔ Tenant lean methodology
- Overall (STATE)
- 92 Strongly Landlord-Friendly
- State Arkansas
- 92 Strongly Landlord-Friendly · R+14
- County
- — inherits STATE
- City
- — inherits STATE
ZIP-level market 72751
- Home prices YoY
- 2.2%
- Active inventory
- 423
- Price-to-rent
- 9.4×
Monthly cashflow live
- Estimated rent
- $1,996 high interval (Pro) →
- Mortgage (P&I)
- −$1,180
- Tax est. 1.5%
- −$281 /mo · $3,375/yr
- Insurance
- −$94
- Flood insurance flood zone
- −$66 /mo · $798/yr
- HOA
- −$0
- Vacancy / Maint / Mgmt
- −$419
- Net cashflow
- $-44
Break-even live
UW: 25.0% down · 7.5% · 30yr · 1.5% tax · 5.0% vac · 8.0% maint · 8.0% mgmt
Financing live
Cash to close
- Down payment
- $56,250
- Closing costs
- $6,750
- Reserves months
- —
- Total cash needed
- —
Loan-product check · same deal, 3 products live
Conventional
25% down · 7.5% · 30yr
- Down + closing
- —
- Monthly P&I
- —
- Monthly cashflow
- —
- DSCR
- —
- Eligible?
- —
Personal DTI + credit; lowest rate.
DSCR
20% down · 8.5% · 30yr
- Down + closing
- —
- Monthly P&I
- —
- Monthly cashflow
- —
- DSCR
- —
- Eligible?
- —
No personal income docs; deal must DSCR.
Hard money
10% down · 12.0% · 12mo
- Down + closing
- —
- Monthly P&I
- —
- Monthly cashflow
- —
- DSCR
- —
- Eligible?
- —
Short-term bridge; refi at stabilization.
Rent comps 18 comps
| Address | Beds | Baths | Sqft | Rent | $/sqft | DOM | Units | Dist |
|---|---|---|---|---|---|---|---|---|
| 2415 England Ln Pea Ridge, AR | 3.0 | 2.0 | 1678 | $2,600 | $1.55 | 14d | 1 | 0.26mi |
| 1400 Hickery St Pea Ridge, AR | 3.0 | 2.0 | 1400 | $1,700 | $1.21 | 21d | 1 | 0.75mi |
| 1006 Seaborn Way Pea Ridge, AR | 3.0 | 2.5 | 1750 | $1,650 | $0.94 | 43d | 1 | 0.89mi |
| 1002 Seaborn Way Pea Ridge, AR | 3.0 | 2.0 | 1750 | $1,650 | $0.94 | 43d | 1 | 0.90mi |
| 308 Alder St Pea Ridge, AR | 3.0 | 2.0 | 1425 | $1,625 | $1.14 | 43d | 1 | 0.90mi |
| 308 Alder St Pea Ridge, AR | 3.0 | 2.0 | 1425 | $1,625 | $1.14 | 23d | 1 | 0.90mi |
| 112 Alder St Pea Ridge, AR | 3.0 | 2.0 | 1350 | $1,625 | $1.20 | 44d | 1 | 0.91mi |
| 942 Seaborn Way Pea Ridge, AR | 3.0 | 2.5 | 1750 | $1,650 | $0.94 | 43d | 1 | 0.91mi |
| 940 Seaborn Way Pea Ridge, AR | 3.0 | 2.5 | 1750 | $1,650 | $0.94 | 43d | 1 | 0.91mi |
| 938 Seaborn Way Pea Ridge, AR | 3.0 | 2.5 | 1750 | $1,650 | $0.94 | 23d | 1 | 0.92mi |
| 938 Seaborn Way Pea Ridge, AR | 3.0 | 2.5 | 1750 | $1,650 | $0.94 | 43d | 1 | 0.92mi |
| 536 Lewis St Pea Ridge, AR | 3.0 | 2.0 | 1649 | $1,995 | $1.21 | 21d | 1 | 0.93mi |
| 801 Lewis St Pea Ridge, AR | 3.0 | 2.0 | 1744 | $2,000 | $1.15 | 13d | 1 | 0.96mi |
| 1036 Tracey Ln Pea Ridge, AR | 4.0 | 2.0 | 1911 | $2,075 | $1.09 | 23d | 1 | 1.02mi |
| 1812 Seay Cir Pea Ridge, AR | 4.0 | 2.5 | 1854 | $1,900 | $1.02 | 44d | 1 | 1.07mi |
| 1393 Hutchinson St Pea Ridge, AR | 3.0 | 2.0 | 1580 | $1,675 | $1.06 | 43d | 1 | 1.32mi |
| 1910 Hahn St Pea Ridge, AR | 3.0 | 2.0 | 1555 | $1,900 | $1.22 | 43d | 1 | 1.37mi |
| 2301 Langford St Pea Ridge, AR | 3.0 | 2.0 | 1637 | $1,800 | $1.10 | 21d | 1 | 1.44mi |
Listing history 6 events
-
2026-05-14status Pending 465-char remark
Show marketing remark (465 chars)
Edge of town, country vibes, private & discreet--the one you've been looking for! Come see this remodeled home featuring new paint, new floors, new fixtures, new appliances, new trim, new decks----the only thing this home is missing is NEW OWNERS! Large backyard with runoff creek & bridge; great for childhood adventures! 3 outbuildings give you space to setup your next workshop & project space. Circle drive, natural light, come see to believe.
-
2026-04-17status Active 465-char remark
Show marketing remark (465 chars)
Edge of town, country vibes, private & discreet--the one you've been looking for! Come see this remodeled home featuring new paint, new floors, new fixtures, new appliances, new trim, new decks----the only thing this home is missing is NEW OWNERS! Large backyard with runoff creek & bridge; great for childhood adventures! 3 outbuildings give you space to setup your next workshop & project space. Circle drive, natural light, come see to believe.
-
2026-02-20status Pending 465-char remark
Show marketing remark (465 chars)
Edge of town, country vibes, private & discreet--the one you've been looking for! Come see this remodeled home featuring new paint, new floors, new fixtures, new appliances, new trim, new decks----the only thing this home is missing is NEW OWNERS! Large backyard with runoff creek & bridge; great for childhood adventures! 3 outbuildings give you space to setup your next workshop & project space. Circle drive, natural light, come see to believe.
-
2026-02-13$225,000 Active 465-char remark
Show marketing remark (465 chars)
Edge of town, country vibes, private & discreet--the one you've been looking for! Come see this remodeled home featuring new paint, new floors, new fixtures, new appliances, new trim, new decks----the only thing this home is missing is NEW OWNERS! Large backyard with runoff creek & bridge; great for childhood adventures! 3 outbuildings give you space to setup your next workshop & project space. Circle drive, natural light, come see to believe.
-
2025-09-15soldstatus $92,000
-
2017-10-02soldstatus $73,000
ⓘ Source: listings_history table (triggers on properties + properties_extension) + one-shot
backfill from property_details.listing_events for pre-trigger history.
Climate risk First Street
- Flood 8/10 Severe FEMA zone X (unshaded) · 99% chance over 30 yrs
- Wildfire 4/10 Moderate
- Heat 4/10 Moderate 7 d/yr ≥104°F today · 21 d/yr by 30 yrs out
- Wind 2/10 Low 2% chance of damaging wind over 30 yrs
- Air quality 2/10 Low 1 unhealthy d/yr today · 1 by 30 yrs out
Nearby sold comps map
Loading sold comps map…
Walkable amenities ~0.75 mi
Loading nearby amenities…
Taxation est. · year 1
- Rental income
- $23,956
- − Mortgage interest
- −$12,603
- − Property taxes
- −$3,375
- − Insurance
- −$1,922
- − Repairs & maintenance
- −$1,916
- − Management
- −$1,916
- − Depreciation
- −$6,545
- Taxable loss
- −$4,324
- Est. tax savings @ 24.0%
- +$1,038
- After-tax cash flow
- $506/yr
For passive investors: Depreciation is non-cash, so a rental often shows a tax loss while cash-flowing — sheltering income. Rental losses are passive: they offset passive income freely, and up to $25,000/yr can offset ordinary (W-2) income if you actively participate and your MAGI is under $100k (phasing out to $0 by $150k); unused losses carry forward. On sale, claimed depreciation is recaptured at up to 25%, and gains may owe capital-gains tax (a 1031 exchange can defer both). Figures are a year-1 estimate at your 24.0% rate — not tax advice; consult a CPA.
Schools (NCES district)
- District
- Pea Ridge School District
- NCES district ID
- 0503030
- Math proficiency
- 43% ▼ -3.00%
- Reading proficiency
- 42% ▼ -8.00%
- Median HH income
- $53,156
- Composite
- 36.88/100
- National rank
- #4546
- State rank
- #43 of 238 in AR
Livability — Pea Ridge
- Score
- 67/100
- State rank
- #98
- US rank
- #10429
Category grades
Schools grade is shown separately in the Schools card above.
Census & demographics
- County
- Benton County · 259,241 people
- City population
- 9,997
- Metro
- Fayetteville-Springdale-Rogers, AR
- Population (ZIP)
- 9,997
- Household income
- $95,299
- Rent vs Own
- Severe rent burden
- 83.0
Population outlook (Benton County) Hauer SSP2
- Today (2025)
- 318,683 people
- By 2030
- 353,481 · +10.9%
- By 2040
- 425,280 · +33.4%
- By 2050
- 497,239 · +56.0%
- By 2075
- 662,114 · +107.8%
- By 2100
- 776,431 · +143.6%
Race, ethnicity, and origin ACS 2023
- Neighborhood character
- Predominantly White (72%)
- Race & ethnicity
- White 72% Two or more races 17% Hispanic / Latino 7% Black 3%
- Hispanic origin (detail)
- Mexican 5%
- Common ancestry
- Slovak 4% Scottish 2% Lithuanian 2%
- Foreign-born
- 7% · Canada, Vietnam
- Languages at home
- 97% English-only · Spanish 2% Vietnamese 1%
Political lean MEDSL · Benton
- 2024 margin
- Strong R (+27.0) · D 35.2% · R 62.1% · Other 2.7%
- 2008→2024 swing
- +9.6pp toward D · 2008: -36.5pp · 2024: -27.0pp
- All cycles
- 2024: R+27.0 2020: R+26.4 2016: R+34.9 2012: R+40.4 2008: R+36.5
Not yet ingested
- Civics
- —
Market trends
- HPI YoY
- ▲ 7.48%
- Current HPI
- 352.7133
- Rent YoY
- —
- Metro
- Fayetteville-Springdale-Rogers, AR
- State GDP YoY
- ▲ 3.80%
- F500 in state
- 10
Industry mix (Fortune 500 HQ in AR)
| Industry | F500 HQs | Revenue |
|---|---|---|
| Retail | 1 | $681B |
|
||
| Food / Agriculture | 1 | $53B |
|
||
| Retail / Energy | 1 | $22B |
|
||
| Transportation / Logistics | 1 | $12B |
|
||
| Energy | 1 | $4B |
|
||
Price history
+208.2% since first listed6 events — show timeline
- 2026-05-14 Pending — NWARMLS
- 2026-04-17 Relisted — NWARMLS
- 2026-02-20 Pending — NWARMLS
- 2026-02-13 Listed $225,000 NWARMLS
- 2025-09-15 Sold (Public Records) $92,000 Public Records
- 2017-10-02 Sold (Public Records) $73,000 Public Records
Property tax history
-7.9%/yrLatest (2025): $49 · +0.0% YoY. Source: county tax records.
Cash-flow waterfall
monthlySold comps — $/sqft
last 12 mo · ≤1 miLoading sold comps…