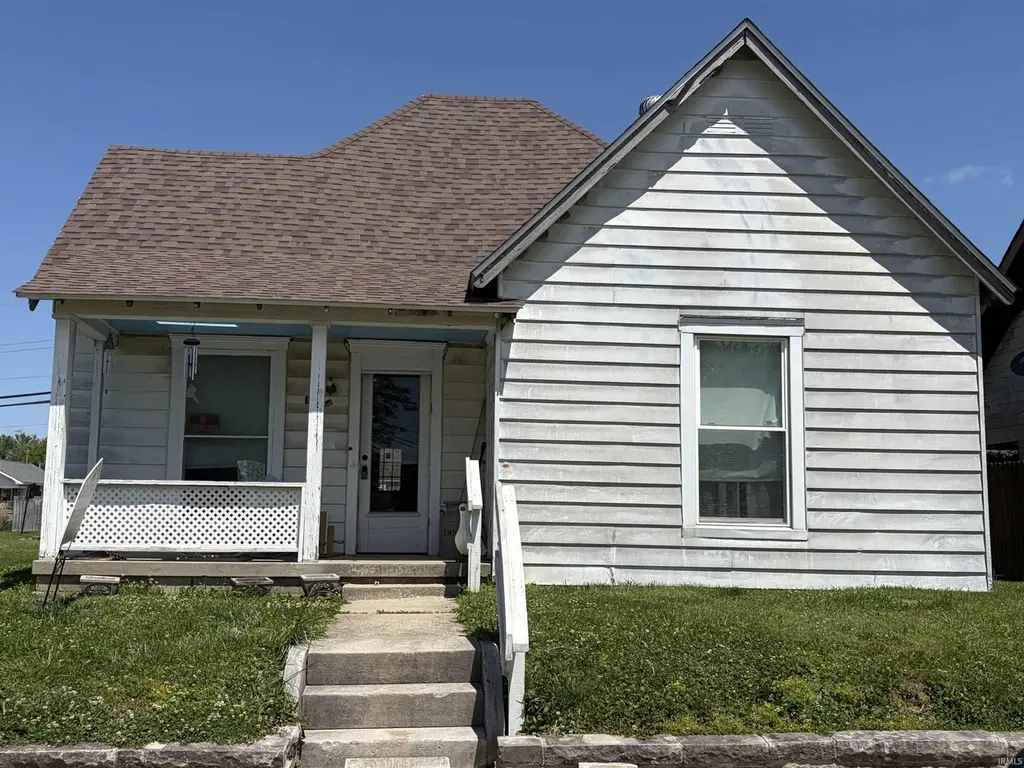
1523 4th St · Bedford, IN
Flood risk 1/10 · Minimal
- FEMA flood zone
- X (unshaded)
- Chance of flooding over 30 yrs
- 0.0%
- Est. flood insurance / yr
- $507 – $1,088
Fire risk 3/10 · Minor
- Est. fire insurance / yr
- $717 – $1,331
Heat risk 4/10 · Minor
- Hot days now (above 104°F)
- 7 days/yr
- Hot days in 30 yrs
- 19 days/yr
Wind risk 2/10 · Minimal
- Chance of severe wind over 30 yrs
- 1.0%
Air-quality risk 2/10 · Minimal
- Unhealthy air days now
- 0 days/yr
- Unhealthy air days in 30 yrs
- 1 days/yr
Risk factors via First Street. Map © Google.
Why this score? — see what drove the C grade
The composite is a weighted blend of 9 inputs, each scored 0–100. Each bar is that input's sub-score; the figure is the points it added to the 100-point composite (weight × sub-score).
- Cash flow +21.5/30.0
- ARV discount +15.0/15.0
- DSCR +6.9/10.0
- 1% rule +4.4/10.0
- Livability +4.0/5.0
- Schools +3.2/10.0
- Rent growth +2.5/5.0
- Condition / age +2.5/5.0
- Appreciation +0.0/10.0
$117,900
🖨 Deal sheet 📄 Offer letter ✓ Due diligence
Listing remarks MLS
Don't miss this 2 bedroom, 1 bath home in town. This home offers "single-level" living and features large rooms, high ceilings, wood floors, and convenient location with easy access to downtown Bedford or Highway 37. The main floor includes: living room, family room/den, 2 bedrooms, bathroom, kitchen and laundry. Additionally, there is a detached garage for extra storage or workshop.
Key facts
- Single-level living
- Convenient location
- Detached garage
Tags
Neighborhood map
What this means for you Summary
Snapshot
- This is a 2-bed/1.0-bath single-family listed at $118k.
Deal economics
- At list price, monthly cash flow is $177 ($2k/yr) — positive.
- The deal already cash-flows at list — no discount required.
- To meet the 1% rule (rent ≥ 1% of price), the offer needs to be $111k (5.9% below list).
- Recommended offer: $104k (12.0% below list) — sets the bar for market timing.
- Cap rate 8.1% vs local median 4.2% in Bedford — top-decile yield for the area; either an underpriced asset or a hidden risk that comps aren't pricing in. Stress-test before assuming the spread holds.
Location & tenants
- Location reads 80/100 on livability (#23 in IN, #1,958 nationally) — a professional / high-income tenant draw. Strengths: crime A+, cost of living A+, housing A+; Watch: schools C-, employment D, commute F.
- North Lawrence Community Schools (rural): math 35% / reading 40% proficiency, ranked #170 of 301 in IN (top 56%) — families likely to look elsewhere, expect single-tenant / working-renter base with shorter leases.
- Market conditions: 158 active listings in the ZIP; 8 units permitted in Lawrence County in 2024 (0 in 5+ unit buildings).
Forward outlook
- Local home prices are declining (-3.0%/yr); year-one equity from $815 of loan paydown is wiped out by about $4k of value loss. Plan a longer hold.
- Lawrence County population projected at -14% by 2050 — secular population decline; favor cash flow + early exit over multi-decade hold.
Negotiation context
- It's been on market 137 days — a 12% lower offer ($104k) is reasonable based on typical stale-listing flexibility.
Risks & watch-outs
- Watch-outs: built in 1922 — expect roof / HVAC / electrical / plumbing capex.
Questions for the listing agent
- It's been on market 137 days. Have you received any prior offers? Is the seller open to a 12% concession, seller financing, or rate buy-down credit?
- Built in 1922 — when were the roof, HVAC, electrical panel, plumbing, and water heater last replaced?
- Why hasn't it sold? Are there any deal-killer items the seller is aware of (foundation, flood, title, zoning, code violations)?
- Is there a deadline driving the sale (1031 exchange, divorce, estate, relocation)? That informs how much negotiation room exists.
- What's the average days-on-market for RENTAL listings here right now (not sales)? A rising rental-DOM trend means longer vacancies and softer asking-rent achievability than the comps imply.
- What's the recent tenant-quality profile in this submarket — average credit score on applications, eviction rate, late-payment / NSF rate, and stable-employment percentage? A property-management company in the area should have these aggregated.
- How much new for-sale + rental construction is in the pipeline within 1–3 miles? Heavy new supply typically softens prices + rents 12–24 months out; constrained supply supports both.
Investment metrics
- 1% rule
- 0.94% ✗
- Cap rate
- 8.10%
- Cash-on-cash
- 6.45%
- DSCR
- 1.29
- GRM
- 8.9
CMA / ARV
- ARV (median comp)
- $150,033
- List price
- $117,900
- Delta
- -21.42%
- Verdict
- UNDERPRICED
- Comps
- 20 within 1.0 mi
Show comp detail 12 sales within ~0.75 mi
| Address | Dist | Beds/Ba | Sqft | Sold | Price | $/sf | Match |
|---|---|---|---|---|---|---|---|
| 414 N St | 0.13mi | 2/2.0 | 1,200 (-1%) | 1mo | $71,000 | $59 | 87 |
| 702 O St | 0.24mi | 3/2.5 (+1) | 1,220 (+1%) | 2mo | $187,000 | $153 | 75 |
| 1511 2nd St | 0.12mi | 2/1.0 | 1,040 (-14%) | 0mo | $151,000 | $145 | 70 |
| 505 T St | 0.33mi | 3/2.0 (+1) | 1,148 (-5%) | 2mo | $199,000 | $173 | 66 |
| 9 Murray Ct | 0.30mi | 3/1.0 (+1) | 1,104 (-9%) | 2mo | $215,000 | $195 | 64 |
| 1539 Breckenridge Rd | 0.51mi | 3/1.0 (+1) | 1,130 (-7%) | 0mo | $28,000 | $25 | 60 |
| 1511 11th Street St | 0.62mi | 3/2.0 (+1) | 1,190 (-2%) | 1mo | $192,000 | $161 | 58 |
| 1219 9th St | 0.50mi | 3/2.0 (+1) | 1,114 (-8%) | 2mo | $185,000 | $166 | 52 |
| 423 J St | 0.44mi | 3/2.5 (+1) | 1,360 (+12%) | 4mo | $232,500 | $171 | 45 |
| 1017 Q St | 0.58mi | 2/1.5 | 1,032 (-15%) | 2mo | $150,000 | $145 | 44 |
| 1117 P St | 0.68mi | 3/1.0 (+1) | 1,064 (-12%) | 3mo | $165,000 | $155 | 40 |
| 311 N Madison St | 0.55mi | 3/2.0 (+1) | 1,392 (+15%) | 1mo | $204,500 | $147 | 39 |
Match score weights: distance 35% · size 25% · config 20% · recency 20%. Top-matched comps best support the ARV.
Projected returns pro-forma
-3.0% appreciation · 3.0% rent growth · sell at horizon
- IRR
- -6.4%
- Equity multiple
- 0.76×
- Total profit
- $-7,865
- Equity at exit
- $17,579
- IRR
- 3.1%
- Equity multiple
- 1.23×
- Total profit
- $7,472
- Equity at exit
- $10,194
Cash invested: $33,012 (down + closing). Projections, not guarantees.
Landlord ↔ Tenant lean methodology
- Overall (STATE)
- 90 Strongly Landlord-Friendly
- State Indiana
- 90 Strongly Landlord-Friendly · R+11
- County
- — inherits STATE
- City
- — inherits STATE
ZIP-level market 47421
- Home prices YoY
- -25.2%
- Active inventory
- 158
- Price-to-rent
- 8.9×
Monthly cashflow live
- Estimated rent
- $1,109 medium interval (Pro) →
- Mortgage (P&I)
- −$618
- Tax from tax record
- −$31 /mo · $376/yr
- Insurance
- −$49
- HOA
- −$0
- Vacancy / Maint / Mgmt
- −$233
- Net cashflow
- $177
Break-even live
UW: 25.0% down · 7.5% · 30yr · 1.5% tax · 5.0% vac · 8.0% maint · 8.0% mgmt
Financing live
Cash to close
- Down payment
- $29,475
- Closing costs
- $3,537
- Reserves months
- —
- Total cash needed
- —
Loan-product check · same deal, 3 products live
Conventional
25% down · 7.5% · 30yr
- Down + closing
- —
- Monthly P&I
- —
- Monthly cashflow
- —
- DSCR
- —
- Eligible?
- —
Personal DTI + credit; lowest rate.
DSCR
20% down · 8.5% · 30yr
- Down + closing
- —
- Monthly P&I
- —
- Monthly cashflow
- —
- DSCR
- —
- Eligible?
- —
No personal income docs; deal must DSCR.
Hard money
10% down · 12.0% · 12mo
- Down + closing
- —
- Monthly P&I
- —
- Monthly cashflow
- —
- DSCR
- —
- Eligible?
- —
Short-term bridge; refi at stabilization.
Listing history 18 events
-
2026-06-19days on market $117,900 Active 137 DOM
-
2026-06-18days on market $117,900 Active 136 DOM
-
2026-06-17days on market $117,900 Active 135 DOM
-
2026-06-16days on market $117,900 Active 134 DOM
-
2026-06-15days on market $117,900 Active 133 DOM
-
2026-06-14days on market $117,900 Active 131 DOM
-
2026-06-13days on market $117,900 Active 130 DOM
-
2026-06-10days on market $117,900 Active 128 DOM
-
2026-06-09days on market $117,900 Active 127 DOM
-
2026-06-08days on market $117,900 Active 126 DOM
-
2026-06-07days on market $117,900 Active 125 DOM
-
2026-06-05days on market $117,900 Active 122 DOM
-
2026-06-03days on market $117,900 Active 121 DOM
-
2026-06-02days on market $117,900 Active 120 DOM
-
2026-06-01days on market $117,900 Active 119 DOM
-
2026-05-31days on market $117,900 Active 118 DOM
-
2026-05-30days on market $117,900 Active 117 DOM
-
2026-01-30$117,900 Active 396-char remark
Show marketing remark (396 chars)
Don't miss this 2 bedroom, 1 bath home in town. This home offers "single-level" living and features large rooms, high ceilings, wood floors, and convenient location with easy access to downtown Bedford or Highway 37. The main floor includes: living room, family room/den, 2 bedrooms, bathroom, kitchen and laundry. Additionally, there is a detached garage for extra storage or workshop.
ⓘ Source: listings_history table (triggers on properties + properties_extension) + one-shot
backfill from property_details.listing_events for pre-trigger history.
Tax reassessment forecast IN · Partial reset (capped growth)
- Current annual tax
- $376 · $31/mo
- Projected year-2 tax
- $689 · $57/mo
- Expected delta
- +$313/yr (+$26/mo · 83.1%)
ⓘ Screening estimate from a state-policy table — verify with the county assessor before closing.
Climate risk First Street
- Flood 1/10 Low FEMA zone X (unshaded) · 0% chance over 30 yrs
- Wildfire 3/10 Moderate
- Heat 4/10 Moderate 7 d/yr ≥104°F today · 19 d/yr by 30 yrs out
- Wind 2/10 Low 100% chance of damaging wind over 30 yrs
- Air quality 2/10 Low 0 unhealthy d/yr today · 1 by 30 yrs out
Nearby sold comps map
Loading sold comps map…
Walkable amenities ~0.75 mi
Loading nearby amenities…
Taxation est. · year 1
- Rental income
- $13,308
- − Mortgage interest
- −$6,604
- − Property taxes
- −$376
- − Insurance
- −$590
- − Repairs & maintenance
- −$1,065
- − Management
- −$1,065
- − Depreciation
- −$3,430
- Taxable income
- $179
- Est. tax owed @ 24.0%
- −$43
- After-tax cash flow
- $2,085/yr
For passive investors: Depreciation is non-cash, so a rental often shows a tax loss while cash-flowing — sheltering income. Rental losses are passive: they offset passive income freely, and up to $25,000/yr can offset ordinary (W-2) income if you actively participate and your MAGI is under $100k (phasing out to $0 by $150k); unused losses carry forward. On sale, claimed depreciation is recaptured at up to 25%, and gains may owe capital-gains tax (a 1031 exchange can defer both). Figures are a year-1 estimate at your 24.0% rate — not tax advice; consult a CPA.
Schools (NCES district)
- District
- North Lawrence Community Schools
- NCES district ID
- 1807860
- Math proficiency
- 35% ▼ -2.00%
- Reading proficiency
- 40% ▼ -3.00%
- Median HH income
- $44,566
- Composite
- 31.88/100
- National rank
- #5864
- State rank
- #170 of 301 in IN
Livability — Bedford
- Score
- 80/100
- State rank
- #23
- US rank
- #1958
Category grades
Schools grade is shown separately in the Schools card above.
Census & demographics
- Census place
- Bedford, IN
- County
- Lawrence County · 27,599 people
- City population
- 27,599
- Metro
- Bedford, IN
- Population (ZIP)
- 27,599
- Household income
- $68,108
- Rent vs Own
- Severe rent burden
- 507.0
Population outlook (Lawrence County) Hauer SSP2
- Today (2025)
- 44,347 people
- By 2030
- 43,331 · -2.3%
- By 2040
- 40,887 · -7.8%
- By 2050
- 38,297 · -13.6%
- By 2075
- 32,479 · -26.8%
- By 2100
- 26,051 · -41.3%
Race, ethnicity, and origin ACS 2023
- Neighborhood character
- Predominantly White (94%)
- Race & ethnicity
- White 94% Two or more races 4% Hispanic / Latino 2%
- Common ancestry
- Slovak 3% Italian 2% Scotch-Irish 1%
- Foreign-born
- 1% · Canada
- Languages at home
- 99% English-only · Spanish 1%
Political lean MEDSL · Lawrence
- 2024 margin
- Solid R (+51.0) · D 23.6% · R 74.6% · Other 1.7%
- 2008→2024 swing
- -30.5pp toward R · 2008: -20.6pp · 2024: -51.0pp
- All cycles
- 2024: R+51.0 2020: R+50.6 2016: R+51.5 2012: R+32.8 2008: R+20.6
Not yet ingested
- Civics
- —
Market trends
- HPI YoY
- ▼ -81.32%
- Current HPI
- 240.959
- Rent YoY
- —
- Metro
- Bedford, IN
- State GDP YoY
- ▲ 2.90%
- F500 in state
- 18
Industry mix (Fortune 500 HQ in IN)
| Industry | F500 HQs | Revenue |
|---|---|---|
| Industrial Machinery | 2 | $37B |
|
||
| Healthcare | 1 | $177B |
|
||
| Pharmaceuticals | 1 | $45B |
|
||
| Metals / Steel | 1 | $18B |
|
||
| Agriculture | 1 | $17B |
|
||
| Packaging | 1 | $12B |
|
||
Price history
1 event — show timeline
- 2026-01-30 Listed $117,900 IRMLS
Property tax history
-11.0%/yrLatest (2023): $376 · -59.5% YoY. Source: county tax records.
Cash-flow waterfall
monthlySold comps — $/sqft
last 12 mo · ≤1 miLoading sold comps…