 Multi-family
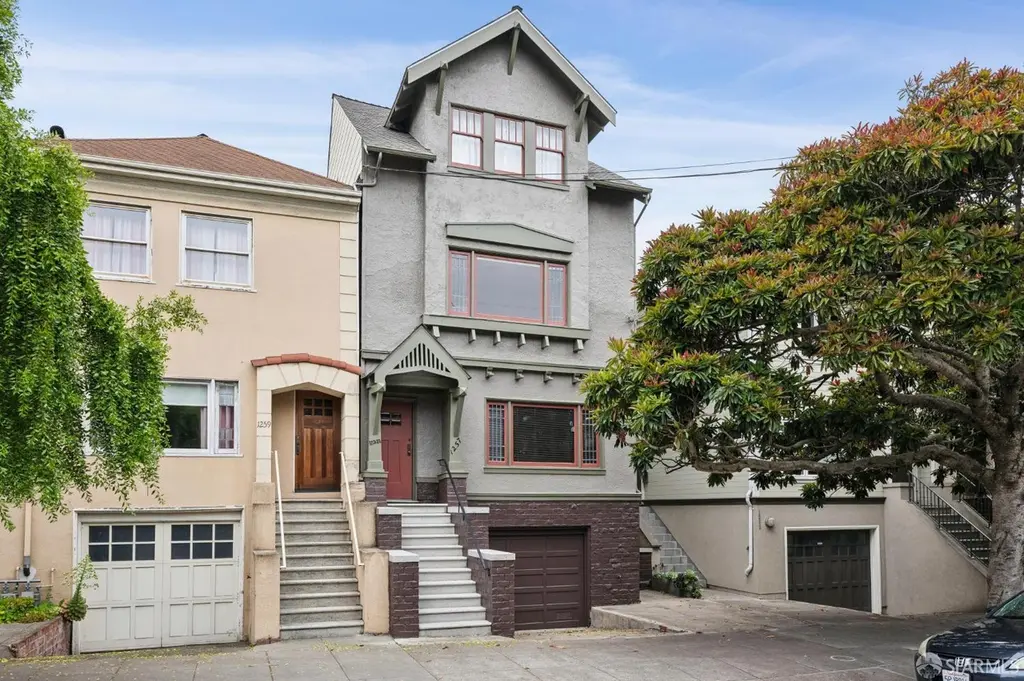
1255-1257 7th Ave · San Francisco, CA
Flood risk 1/10 · Minimal
- FEMA flood zone
- X (unshaded)
- Chance of flooding over 30 yrs
- 0.0%
- Est. flood insurance / yr
- $507 – $1,088
Fire risk 1/10 · Minimal
- Est. fire insurance / yr
- $659 – $1,223
Heat risk 2/10 · Minimal
- Hot days now (above 76°F)
- 7 days/yr
- Hot days in 30 yrs
- 16 days/yr
Wind risk 1/10 · Minimal
- Chance of severe wind over 30 yrs
- —
Air-quality risk 7/10 · Major
- Unhealthy air days now
- 13 days/yr
- Unhealthy air days in 30 yrs
- 13 days/yr
Risk factors via First Street. Map © Google.
Why this score? — see what drove the C grade
The composite is a weighted blend of 9 inputs, each scored 0–100. Each bar is that input's sub-score; the figure is the points it added to the 100-point composite (weight × sub-score).
- Cash flow +20.0/30.0
- ARV discount +13.0/15.0
- DSCR +6.3/10.0
- Schools +5.0/10.0
- Rent growth +4.9/5.0
- 1% rule +4.0/10.0
- Livability +3.8/5.0
- Condition / age +2.5/5.0
- Appreciation +0.0/10.0
$1,850,000
🖨 Deal sheet 📄 Offer letter ✓ Due diligence
Multi-family units
County records classify this as Multi-Family (2-4 Unit). Listing-text estimate: 1 unit. estimate disagrees with records
Listing remarks
1255-1257 7th Avenue is a Craftsman-style three-unit building well-suited as an investment or owner-user purchase in the Inner Sunset. The property consists of two full-floor 2-bedroom flats and a top-floor 1-bedroom unit. The flats share a nearly identical layout and an abundance of Craftsman character inlaid hardwood floors, two fireplaces (one decorative), built-in cabinetry, French doors separating rooms, and beautiful woodwork that gives each unit a warm and welcoming feel. The middle and top flats are approximately 1,317 and 1,375 square feet, respectively. All units enjoy high ceilings and generous natural light. The middle flat, 1257, will be delivered vacant an ideal opportunity
Key facts
- French doors
- High ceilings
- Craftsman style
Tags
Property features AI
Finance
- Other: Living/building area reported as 3,700 square feet; Lot area reported (approximately 2,997 sq ft)
- Financial info: Triplex with three units total: two leased and one vacant
- HOA & community: No association fee
Exterior
- Parking: Garage parking with three garage spaces; Additional off-street parking (tandem configuration) totaling four parking spaces
- Utilities: Separate gas meters; Separate electric meters
- Home design: Residential income property configured as a triplex; Single building
- Construction: Built in 1913
- Exterior features: No notable lot features listed
Interior
- Bedrooms: Five total bedrooms across units (includes two 2-bedroom units and one 1-bedroom unit)
- Bathrooms: Three full bathrooms total
- Interior features: In-unit laundry
- Laundry & utility: Laundry located in each unit (in-unit)
Neighborhood map
What this means for you Summary
Snapshot
- This is a 5-bed/3.0-bath multifamily listed at $1.85M.
Deal economics
- At list price, monthly cash flow is $2k ($27k/yr) — positive.
- The deal already cash-flows at list — no discount required.
- To meet the 1% rule (rent ≥ 1% of price), the offer needs to be $1.66M (10.3% below list).
- Recommended offer: $1.66M (10.3% below list) — sets the bar for 1% rule.
- Cap rate 7.8% vs local median 2.1% in San Francisco — top-decile yield for the area; either an underpriced asset or a hidden risk that comps aren't pricing in. Stress-test before assuming the spread holds.
Location & tenants
- Location reads 76/100 on livability (#90 in CA, #3,143 nationally) — a middle-class / working-renter tenant base. Strengths: amenities A+, commute A+, employment A+; Watch: crime F, cost of living F.
- San Francisco Unified (urban): math 50% / reading 56% proficiency, ranked #322 of 1,400 in CA (top 23%) — acceptable for families but not a draw, mixed tenant base, ~2y average lease.
- Market conditions: Rents rising fast (+9.7%/yr); 63 active listings in the ZIP; 1 comparable units currently listed for rent nearby; high-income renter base; 750 units permitted in San Francisco County in 2024 (688 in 5+ unit buildings).
- At $16,595/mo this rent would consume 136% of the median local household income ($146k/yr) (locally 2227% of renters already pay >50% of income on rent) — very limited rent-growth headroom before tenants either downsize or default.
Forward outlook
- Local home prices are declining (-3.0%/yr); year-one equity from $13k of loan paydown is wiped out by about $56k of value loss. Plan a longer hold.
- San Francisco County population projected at +39% by 2050 — long-run rental-demand tailwind backs the buy-and-hold thesis.
- At projected returns (-3.0% appreciation + 8.0% rent growth), your $518k cash investment doubles in ~10 years — after that, you're playing with house money.
Negotiation context
- It's been on market 17 days — a 2% lower offer ($1.82M) is reasonable based on typical stale-listing flexibility.
Risks & watch-outs
- Watch-outs: built in 1913 — expect roof / HVAC / electrical / plumbing capex.
Questions for the listing agent
- Built in 1913 — when were the roof, HVAC, electrical panel, plumbing, and water heater last replaced?
- Is there a deadline driving the sale (1031 exchange, divorce, estate, relocation)? That informs how much negotiation room exists.
- Schools are B-rated — typically a magnet for longer-tenancy family renters. What's the average tenant stay here, and is there a school-zone premium baked into asking?
- Crime grade is F in this area — have there been break-ins, vandalism, or insurance claims at this property in the last 3 years? What carrier currently insures it and at what premium?
- What's the average days-on-market for RENTAL listings here right now (not sales)? A rising rental-DOM trend means longer vacancies and softer asking-rent achievability than the comps imply.
- What's the recent tenant-quality profile in this submarket — average credit score on applications, eviction rate, late-payment / NSF rate, and stable-employment percentage? A property-management company in the area should have these aggregated.
- How much new apartment / multifamily construction is in the pipeline within 1–3 miles? Heavy new supply (>2% of stock underway) typically softens rents 12–24 months out; light construction supports rent growth.
Investment metrics
- 1% rule
- 0.90% ✗
- Cap rate
- 7.75%
- Cash-on-cash
- 5.22%
- DSCR
- 1.23
- GRM
- 9.3
CMA / ARV
- ARV (on-the-fly)
- $2,109,000
- Comps found
- 12
Show comp detail 12 sales within ~0.75 mi
| Address | Dist | Beds/Ba | Sqft | Sold | Price | $/sf | Match |
|---|---|---|---|---|---|---|---|
| 1229-1231 2nd Ave | 0.30mi | 5/3.0 | 3,732 (+1%) | 19mo | $2,005,000 | $537 | 69 |
| 1228-1232 12th Ave | 0.26mi | 6/3.0 (+1) | 4,002 (+8%) | 2mo | $1,250,000 | $312 | 67 |
| 512 Judah St | 0.24mi | 5/3.0 | 3,250 (-12%) | 8mo | $1,700,000 | $523 | 62 |
| 1231-1233 4th Ave | 0.18mi | 6/3.0 (+1) | 3,200 (-14%) | 4mo | $2,865,000 | $895 | 61 |
| 1527-1529 10th Ave | 0.39mi | 4/3.0 (-1) | 3,370 (-9%) | 3mo | $2,138,000 | $634 | 60 |
| 1215-1217 3rd Ave | 0.24mi | 4/4.0 (-1) | 3,260 (-12%) | 4mo | $1,900,000 | $583 | 57 |
| 1523-1525 10th Ave | 0.38mi | 6/4.0 (+1) | 3,370 (-9%) | 6mo | $2,175,000 | $645 | 53 |
| 238-242 Alma St | 0.72mi | 5/— | 3,425 (-7%) | 3mo | $3,800,000 | $1,109 | 52 |
| 751-753 8th Ave | 0.66mi | 5/3.0 | 3,330 (-10%) | 11mo | $1,520,000 | $456 | 44 |
| 743-745 9th Ave | 0.67mi | 5/3.0 | 3,935 (+6%) | 17mo | $2,055,000 | $522 | 44 |
| 265 Rivoli St | 0.72mi | 4/4.0 (-1) | 3,400 (-8%) | 8mo | $1,937,813 | $570 | 37 |
| 1330 17th Ave | 0.57mi | 6/4.0 (+1) | 4,032 (+9%) | 18mo | $1,540,500 | $382 | 35 |
Match score weights: distance 35% · size 25% · config 20% · recency 20%. Top-matched comps best support the ARV.
Projected returns pro-forma
-3.0% appreciation · 8.0% rent growth · sell at horizon
- IRR
- -3.4%
- Equity multiple
- 0.87×
- Total profit
- $-69,598
- Equity at exit
- $275,841
- IRR
- 10.7%
- Equity multiple
- 2.00×
- Total profit
- $519,433
- Equity at exit
- $159,954
Cash invested: $518,000 (down + closing). Projections, not guarantees.
Landlord ↔ Tenant lean methodology
- Overall (CITY)
- 0 Strongly Tenant-Friendly
- State California
- 18 Strongly Tenant-Friendly · D+13
- County
- — inherits STATE
- City San Francisco
- 0 Strongly Tenant-Friendly · D+57
ZIP-level market 94122
- Rents YoY
- 9.7%
- Active inventory
- 63
- Price-to-rent
- 36.8×
Monthly cashflow live
- Estimated rent
- $16,595 high interval (Pro) →
- Mortgage (P&I)
- −$9,702
- Tax from tax record
- −$386 /mo · $4,631/yr
- Insurance
- −$771
- HOA
- −$0
- Vacancy / Maint / Mgmt
- −$3,485
- Net cashflow
- $2,252
Break-even live
4-unit breakdown (identical units grouped — click to expand)
| Units | Beds | Baths | Est. rent |
|---|---|---|---|
| 3× units | 2 | 1 | $12,561 |
| #1 | 2 | 1 | $4,187 |
| #2 | 2 | 1 | $4,187 |
| #3 | 2 | 1 | $4,187 |
| 1× unit | 1 | 1 | $4,033 |
| Total (4 units) | $16,595 | ||
UW: 25.0% down · 7.5% · 30yr · 1.5% tax · 5.0% vac · 8.0% maint · 8.0% mgmt
Financing live
Cash to close
- Down payment
- $462,500
- Closing costs
- $55,500
- Reserves months
- —
- Total cash needed
- —
Loan-product check · same deal, 3 products live
Conventional
25% down · 7.5% · 30yr
- Down + closing
- —
- Monthly P&I
- —
- Monthly cashflow
- —
- DSCR
- —
- Eligible?
- —
Personal DTI + credit; lowest rate.
DSCR
20% down · 8.5% · 30yr
- Down + closing
- —
- Monthly P&I
- —
- Monthly cashflow
- —
- DSCR
- —
- Eligible?
- —
No personal income docs; deal must DSCR.
Hard money
10% down · 12.0% · 12mo
- Down + closing
- —
- Monthly P&I
- —
- Monthly cashflow
- —
- DSCR
- —
- Eligible?
- —
Short-term bridge; refi at stabilization.
Rent comps 1 comps
| Address | Beds | Baths | Sqft | Rent | $/sqft | DOM | Units | Dist |
|---|---|---|---|---|---|---|---|---|
| 143 Corbett Ave San Francisco, CA | 4.0 | 4.0 | 2500 | $10,500 | $4.20 | 44d | 1 | 1.31mi |
Listing history 4 events
-
2026-06-02status $1,850,000 Pending 17 DOM
-
2026-06-01days on market $1,850,000 Active 17 DOM
-
2026-05-31days on market $1,850,000 Active 16 DOM
-
2026-05-15$1,850,000 Active
ⓘ Source: listings_history table (triggers on properties + properties_extension) + one-shot
backfill from property_details.listing_events for pre-trigger history.
Tax reassessment forecast CA · Resets to sale price
- Current annual tax
- $4,631 · $386/mo
- Projected year-2 tax
- $14,060 · $1,172/mo
- Expected delta
- +$9,429/yr (+$786/mo · 203.6%)
ⓘ Screening estimate from a state-policy table — verify with the county assessor before closing.
Climate risk First Street
- Flood 1/10 Low FEMA zone X (unshaded) · 0% chance over 30 yrs
- Wildfire 1/10 Low
- Heat 2/10 Low 7 d/yr ≥76°F today · 16 d/yr by 30 yrs out
- Wind 1/10 Low
- Air quality 7/10 Severe 13 unhealthy d/yr today · 13 by 30 yrs out
Nearby sold comps map
Loading sold comps map…
Walkable amenities ~0.75 mi
Loading nearby amenities…
Taxation est. · year 1
- Rental income
- $199,140
- − Mortgage interest
- −$103,629
- − Property taxes
- −$4,631
- − Insurance
- −$9,250
- − Repairs & maintenance
- −$15,931
- − Management
- −$15,931
- − Depreciation
- −$53,818
- Taxable loss
- −$4,050
- Est. tax savings @ 24.0%
- +$972
- After-tax cash flow
- $27,993/yr
For passive investors: Depreciation is non-cash, so a rental often shows a tax loss while cash-flowing — sheltering income. Rental losses are passive: they offset passive income freely, and up to $25,000/yr can offset ordinary (W-2) income if you actively participate and your MAGI is under $100k (phasing out to $0 by $150k); unused losses carry forward. On sale, claimed depreciation is recaptured at up to 25%, and gains may owe capital-gains tax (a 1031 exchange can defer both). Figures are a year-1 estimate at your 24.0% rate — not tax advice; consult a CPA.
Schools (NCES district)
- District
- San Francisco Unified
- NCES district ID
- 0634410
- Math proficiency
- 50% ▬ 0.00%
- Reading proficiency
- 56% ▲ 1.00%
- Median HH income
- $81,249
- Composite
- 50.14/100
- National rank
- #4088
- State rank
- #322 of 1400 in CA
Livability — San Francisco
- Score
- 76/100
- State rank
- #90
- US rank
- #3143
Category grades
Schools grade is shown separately in the Schools card above.
Census & demographics
- Census place
- San Francisco, CA
- County
- San Francisco County · 827,552 people
- City population
- 827,552
- Metro
- San Francisco-Oakland-Berkeley, CA
- Population (ZIP)
- 55,819
- Household income
- $146,250
- Rent vs Own
- Severe rent burden
- 2227.0
Population outlook (San Francisco County) Hauer SSP2
- Today (2025)
- 1,030,936 people
- By 2030
- 1,110,409 · +7.7%
- By 2040
- 1,270,010 · +23.2%
- By 2050
- 1,435,001 · +39.2%
- By 2075
- 1,779,074 · +72.6%
- By 2100
- 1,966,767 · +90.8%
Race, ethnicity, and origin ACS 2023
- Neighborhood character
- Diverse neighborhood (Simpson 0.66)
- Race & ethnicity
- Asian 44% White 36% Hispanic / Latino 11% Two or more races 11% Black 2%
- Hispanic origin (detail)
- Mexican 4%
- Common ancestry
- Italian 2% Scotch-Irish 2% Lithuanian 2%
- Foreign-born
- 36% · China, Canada, Vietnam
- Languages at home
- 54% English-only · Chinese 26% Spanish 7% Other Indo-European 3%
Political lean MEDSL · San Francisco
- 2024 margin
- Solid D (+64.8) · D 80.3% · R 15.5% · Other 4.1%
- 2008→2024 swing
- -5.7pp toward R · 2008: 70.5pp · 2024: 64.8pp
- All cycles
- 2024: D+64.8 2020: D+72.5 2016: D+76.1 2012: D+70.2 2008: D+70.5
Not yet ingested
- Civics
- —
Market trends
- HPI YoY
- ▼ -946.32%
- Current HPI
- 314.9762
- Rent YoY
- ▲ 9.73%
- Metro
- San Francisco-Oakland-Berkeley, CA
- State GDP YoY
- ▲ 3.21%
- F500 in state
- 116
Industry mix (Fortune 500 HQ in CA)
| Industry | F500 HQs | Revenue |
|---|---|---|
| Technology | 27 | $1,492B |
|
||
| Financial Services | 3 | $174B |
|
||
| Retail | 3 | $44B |
|
||
| Insurance | 3 | $26B |
|
||
| Media / Entertainment | 2 | $115B |
|
||
| Pharmaceuticals / Biotech | 2 | $62B |
|
||
Price history
1 event — show timeline
- 2026-05-15 Listed $1,850,000 San Francisco MLS
Property tax history
+2.8%/yrLatest (2025): $4,631 · +3.1% YoY. Source: county tax records.
Cash-flow waterfall
monthlySold comps — $/sqft
last 12 mo · ≤1 miLoading sold comps…