1803 Harkey St · Paris, AR
Flood risk 1/10 · Minimal
- FEMA flood zone
- X (unshaded)
- Chance of flooding over 30 yrs
- 0.0%
- Est. flood insurance / yr
- $507 – $1,088
Fire risk 5/10 · Moderate
- Est. fire insurance / yr
- $1,499 – $2,785
Heat risk 7/10 · Major
- Hot days now (above 111°F)
- 7 days/yr
- Hot days in 30 yrs
- 21 days/yr
Wind risk 2/10 · Minimal
- Chance of severe wind over 30 yrs
- 2.0%
Air-quality risk 1/10 · Minimal
- Unhealthy air days now
- 0 days/yr
- Unhealthy air days in 30 yrs
- 0 days/yr
Risk factors via First Street. Map © Google.
Why this score? — see what drove the B- grade
The composite is a weighted blend of 9 inputs, each scored 0–100. Each bar is that input's sub-score; the figure is the points it added to the 100-point composite (weight × sub-score).
- Cash flow +25.3/30.0
- ARV discount +13.7/15.0
- DSCR +8.3/10.0
- 1% rule +6.6/10.0
- Livability +3.5/5.0
- Schools +3.2/10.0
- Rent growth +2.5/5.0
- Condition / age +2.5/5.0
- Appreciation +0.0/10.0
$90,000
🖨 Deal sheet (PDF) 📄 Offer letter ✓ Due diligence
Listing remarks MLS
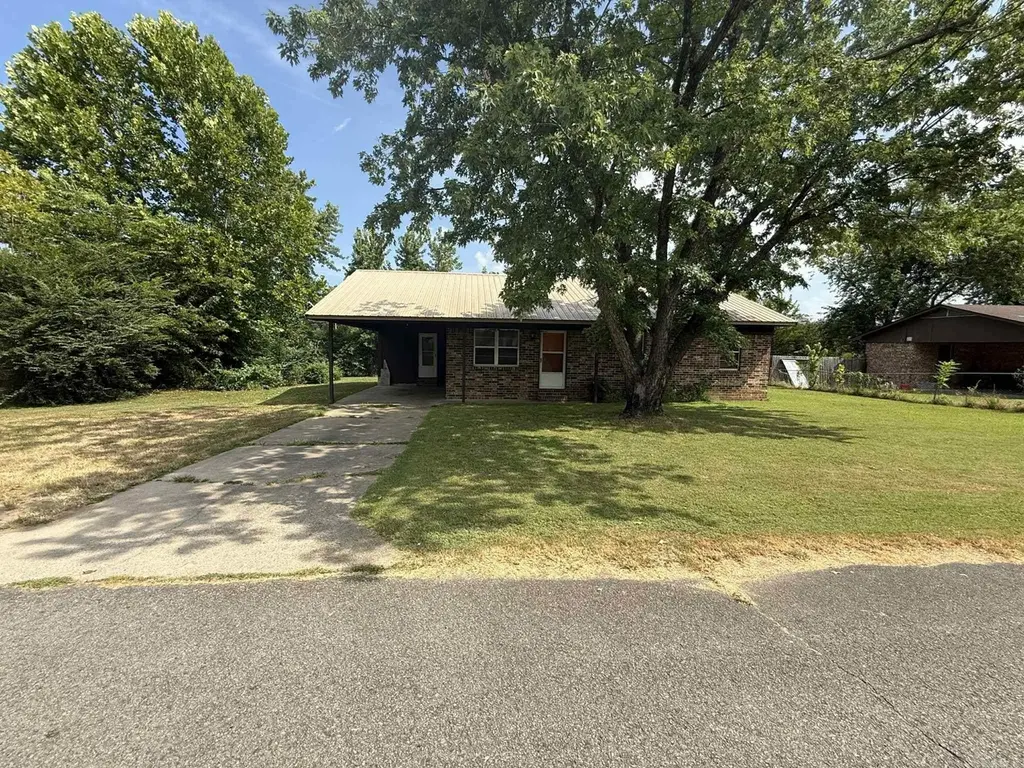
Welcome to 1803 E Harkey ST, a single-family residence in Paris, Arkansas, built in 1980. The metal roof provides years of service. This property offers a unique opportunity to create your ideal living space on a manageable . 27 acre lot. With three well-proportioned bedrooms and a large bathroom with tiled step in shower. This home has an open kitchen, dining, and living area. It presents a canvas for personalized living.
Key facts
- Metal roof
- 0.27 acre lot
- Parking
Tags
Property features AI
Finance
- HOA & community: Monthly association fee
Exterior
- Parking: Attached carport; 1 covered parking space; Has carport
- Utilities: Electricity available; Public water; Public sewer
- Home design: 1 story; Brick construction; Metal roof; Slab foundation
- Construction: Brick construction; Metal roof; Built 25+ years ago; Slab foundation
- Exterior features: Concrete driveway; Covered porch; Partial fencing; City lot; Level lot; Subdivision lot; Paved public road frontage
Interior
- Kitchen: Electric range
- Flooring: Carpet; Tile
- Bathrooms: 1 full bathroom
- Heating & cooling: Central heating; Central air; Window unit(s)
- Interior features: Ceiling fan(s)
- Laundry & utility: Electric water heater
Neighborhood map
What this means for you Summary
Snapshot
- This is a 3-bed/1.0-bath single-family listed at $90k.
Deal economics
- At list price, monthly cash flow is $204 ($2k/yr) — positive.
- The deal already cash-flows at list — no discount required.
- Meets the 1% rule at list price ($1k rent vs $90k).
- Cap rate 9.0% vs local median 5.5% in Paris — top-decile yield for the area; either an underpriced asset or a hidden risk that comps aren't pricing in. Stress-test before assuming the spread holds.
Location & tenants
- Location reads 69/100 on livability (#68 in AR) — a middle-class / working-renter tenant base. Strengths: cost of living A+, housing A+, health & safety A+; Watch: crime F, amenities F, commute F.
- Paris School District (town): math 41% / reading 37% proficiency, ranked #83 of 238 in AR (top 35%) — families likely to look elsewhere, expect single-tenant / working-renter base with shorter leases.
- Zoned schools: Paris Elementary School (math 57% / reading 27%, grade F, #173 of 454 statewide, top 43%, 431 students, 100% FRL); Paris Middle School (math 39% / reading 43%, grade F, #83 of 201 statewide, top 44%, 317 students, 100% FRL); Paris High School (math 32% / reading 37%, grade F, #92 of 292 statewide, top 37%, 335 students, 100% FRL) — zoned schools average 100% FRL vs 54% district-wide (46 pts higher); higher-poverty schools than district average — tighter screening recommended.
- Market conditions: 78 active listings in the ZIP; 11 units permitted in Logan County in 2024 (0 in 5+ unit buildings).
Forward outlook
- Local home prices are declining (-3.0%/yr); year-one equity from $622 of loan paydown is wiped out by about $3k of value loss. Plan a longer hold.
- Logan County population projected at -13% by 2050 — secular population decline; favor cash flow + early exit over multi-decade hold.
Negotiation context
- Only 8 days on market — expect competitive offers; lowballing is unlikely to land.
- 4 sale attempts since 6y ago with the ask held roughly flat each time — persistent listings suggest the price (not the market) is what's stuck; bring a comps-based counter.
Risks & watch-outs
- Climate carrying-cost: moderate wildfire risk; extreme-heat days projected 7→21/yr by 2055 (HVAC capex compounding) — expect insurance premiums to compound above CPI over the hold.
Questions for the listing agent
- Is there a deadline driving the sale (1031 exchange, divorce, estate, relocation)? That informs how much negotiation room exists.
- Schools are D-rated, which usually means shorter tenancies and higher turnover. Who's the typical renter profile here, and what's been the actual vacancy rate?
- Crime grade is F in this area — have there been break-ins, vandalism, or insurance claims at this property in the last 3 years? What carrier currently insures it and at what premium?
- What's the average days-on-market for RENTAL listings here right now (not sales)? A rising rental-DOM trend means longer vacancies and softer asking-rent achievability than the comps imply.
- What's the recent tenant-quality profile in this submarket — average credit score on applications, eviction rate, late-payment / NSF rate, and stable-employment percentage? A property-management company in the area should have these aggregated.
- How much new for-sale + rental construction is in the pipeline within 1–3 miles? Heavy new supply typically softens prices + rents 12–24 months out; constrained supply supports both.
Investment metrics
- 1% rule
- 1.16% ✓
- Cap rate
- 9.02%
- Cash-on-cash
- 9.73%
- DSCR
- 1.43
- GRM
- 7.2
CMA / ARV
- ARV (median comp)
- $104,270
- List price
- $90,000
- Delta
- -13.69%
- Verdict
- UNDERPRICED
- Comps
- 20 within 1.0 mi
Show comp detail 12 sales within ~0.75 mi
| Address | Dist | Beds/Ba | Sqft | Sold | Price | $/sf | Match |
|---|---|---|---|---|---|---|---|
| 1205 Crescent Dr | 0.74mi | 3/1.5 | 1,161 (0%) | 6mo | $30,000 | $26 | 58 |
| 1112 E Wood St | 0.60mi | 3/2.0 | 1,209 (+4%) | 9mo | $152,700 | $126 | 53 |
| 1160 Wood St | 0.59mi | 3/1.0 | 1,032 (-11%) | 1mo | $115,000 | $111 | 53 |
| 1116 Academy St | 0.35mi | 3/2.0 | 1,274 (+10%) | 18mo | $30,000 | $24 | 48 |
| 1104 Main St | 0.39mi | 2/2.0 (-1) | 1,260 (+8%) | 15mo | $20,000 | $16 | 46 |
| 817 E Chism St | 0.59mi | 2/1.0 (-1) | 1,232 (+6%) | 15mo | $57,400 | $47 | 45 |
| 519 S 10th St | 0.45mi | 2/1.0 (-1) | 1,004 (-14%) | 10mo | $62,000 | $62 | 43 |
| 618 Academy St | 0.57mi | 3/2.0 | 1,240 (+7%) | 20mo | $105,000 | $85 | 41 |
| 804 Wahl St | 0.68mi | 3/2.0 | 1,250 (+8%) | 15mo | $157,000 | $126 | 39 |
| 3202 Chism St | 0.69mi | 3/2.0 | 1,294 (+12%) | 8mo | $80,000 | $62 | 38 |
| 614 N 7th St | 0.73mi | 2/1.0 (-1) | 1,039 (-10%) | 13mo | $120,000 | $115 | 33 |
| 610 N 7th St | 0.72mi | 2/1.0 (-1) | 988 (-15%) | 20mo | $84,000 | $85 | 20 |
Match score weights: distance 35% · size 25% · config 20% · recency 20%. Top-matched comps best support the ARV.
Projected returns pro-forma
-3.0% appreciation · 3.0% rent growth · sell at horizon
- IRR
- -1.6%
- Equity multiple
- 0.94×
- Total profit
- $-1,559
- Equity at exit
- $13,419
- IRR
- 8.1%
- Equity multiple
- 1.61×
- Total profit
- $15,459
- Equity at exit
- $7,782
Cash invested: $25,200 (down + closing). Projections, not guarantees.
Landlord ↔ Tenant lean methodology
- Overall (STATE)
- 92 Strongly Landlord-Friendly
- State Arkansas
- 92 Strongly Landlord-Friendly · R+14
- County
- — inherits STATE
- City
- — inherits STATE
ZIP-level market 72855
- Home prices YoY
- -8.3%
- Active inventory
- 78
- Price-to-rent
- 7.2×
Monthly cashflow live
- Estimated rent
- $1,046 medium interval (Pro) →
- Mortgage (P&I)
- −$472
- Tax est. 1.5%
- −$112 /mo · $1,350/yr
- Insurance
- −$38
- HOA
- −$0
- Vacancy / Maint / Mgmt
- −$220
- Net cashflow
- $204
Break-even live
Sensitivity live
| Price | -10% $266 | -5% $235 | +0% $204 | +5% $173 | +10% $142 |
|---|---|---|---|---|---|
| Rent | -10% $122 | -5% $163 | +0% $204 | +5% $246 | +10% $287 |
| Rate | -1.0pp $250 | -0.5pp $227 | base $204 | +0.5pp $181 | +1.0pp $157 |
UW: 25.0% down · 7.5% · 30yr · 1.5% tax · 5.0% vac · 8.0% maint · 8.0% mgmt
Financing live
Cash to close
- Down payment
- $22,500
- Closing costs
- $2,700
- Reserves months
- —
- Total cash needed
- —
Loan-product check · same deal, 3 products live
Conventional
25% down · 7.5% · 30yr
- Down + closing
- —
- Monthly P&I
- —
- Monthly cashflow
- —
- DSCR
- —
- Eligible?
- —
Personal DTI + credit; lowest rate.
DSCR
20% down · 8.5% · 30yr
- Down + closing
- —
- Monthly P&I
- —
- Monthly cashflow
- —
- DSCR
- —
- Eligible?
- —
No personal income docs; deal must DSCR.
Hard money
10% down · 12.0% · 12mo
- Down + closing
- —
- Monthly P&I
- —
- Monthly cashflow
- —
- DSCR
- —
- Eligible?
- —
Short-term bridge; refi at stabilization.
Listing history 12 events
-
2026-06-15remarks 427-char remark
-
2026-06-15status $90,000 Pending 8 DOM
-
2026-05-13status Under Contract 426-char remark
Show marketing remark (426 chars)
Welcome to 1803 E Harkey ST, a single-family residence in Paris, Arkansas, built in 1980. The metal roof provides years of service. This property offers a unique opportunity to create your ideal living space on a manageable . 27 acre lot. With three well-proportioned bedrooms and a large bathroom with tiled step in shower. This home has an open kitchen, dining, and living area. It presents a canvas for personalized living.
-
2026-05-13status Pending 427-char remark
Show marketing remark (426 chars)
Welcome to 1803 E Harkey ST, a single-family residence in Paris, Arkansas, built in 1980. The metal roof provides years of service. This property offers a unique opportunity to create your ideal living space on a manageable . 27 acre lot. With three well-proportioned bedrooms and a large bathroom with tiled step in shower. This home has an open kitchen, dining, and living area. It presents a canvas for personalized living.
-
2026-05-05$90,000 New Listing 426-char remark
Show marketing remark (426 chars)
Welcome to 1803 E Harkey ST, a single-family residence in Paris, Arkansas, built in 1980. The metal roof provides years of service. This property offers a unique opportunity to create your ideal living space on a manageable . 27 acre lot. With three well-proportioned bedrooms and a large bathroom with tiled step in shower. This home has an open kitchen, dining, and living area. It presents a canvas for personalized living.
-
2026-05-05$90,000 Active 427-char remark
Show marketing remark (426 chars)
Welcome to 1803 E Harkey ST, a single-family residence in Paris, Arkansas, built in 1980. The metal roof provides years of service. This property offers a unique opportunity to create your ideal living space on a manageable . 27 acre lot. With three well-proportioned bedrooms and a large bathroom with tiled step in shower. This home has an open kitchen, dining, and living area. It presents a canvas for personalized living.
-
2025-10-20$126,000 Active
-
2021-05-13soldstatus $78,000
-
2021-05-13soldstatus $78,000
-
2020-10-16$82,500
-
1995-08-24soldstatus $38,000
-
1995-03-28soldstatus $17,333
ⓘ Source: listings_history table (triggers on properties + properties_extension) + one-shot
backfill from property_details.listing_events for pre-trigger history.
Climate risk First Street
- Flood 1/10 Low FEMA zone X (unshaded) · 0% chance over 30 yrs
- Wildfire 5/10 Major
- Heat 7/10 Severe 7 d/yr ≥111°F today · 21 d/yr by 30 yrs out
- Wind 2/10 Low 2% chance of damaging wind over 30 yrs
- Air quality 1/10 Low 0 unhealthy d/yr today · 0 by 30 yrs out
Nearby sold comps map
Loading sold comps map…
Walkable amenities ~0.75 mi
Loading nearby amenities…
Taxation est. · year 1
- Rental income
- $12,550
- − Mortgage interest
- −$5,041
- − Property taxes
- −$1,350
- − Insurance
- −$450
- − Repairs & maintenance
- −$1,004
- − Management
- −$1,004
- − Depreciation
- −$2,618
- Taxable income
- $1,083
- Est. tax owed @ 24.0%
- −$260
- After-tax cash flow
- $2,191/yr
For passive investors: Depreciation is non-cash, so a rental often shows a tax loss while cash-flowing — sheltering income. Rental losses are passive: they offset passive income freely, and up to $25,000/yr can offset ordinary (W-2) income if you actively participate and your MAGI is under $100k (phasing out to $0 by $150k); unused losses carry forward. On sale, claimed depreciation is recaptured at up to 25%, and gains may owe capital-gains tax (a 1031 exchange can defer both). Figures are a year-1 estimate at your 24.0% rate — not tax advice; consult a CPA.
Schools (NCES district)
- District
- Paris School District
- NCES district ID
- 0511130
- Math proficiency
- 41% ▼ -9.00%
- Reading proficiency
- 37% ▼ -6.00%
- Median HH income
- $34,950
- Composite
- 32.25/100
- National rank
- #5763
- State rank
- #83 of 238 in AR
Livability — Paris
- Score
- 69/100
- State rank
- #68
- US rank
- #8544
Category grades
Schools grade is shown separately in the Schools card above.
Census & demographics
- Census place
- Paris, AR
- Population (ZIP)
- 6,462
Population outlook (Logan County) Hauer SSP2
- Today (2025)
- 21,046 people
- By 2030
- 20,537 · -2.4%
- By 2040
- 19,443 · -7.6%
- By 2050
- 18,220 · -13.4%
- By 2075
- 16,164 · -23.2%
- By 2100
- 14,858 · -29.4%
Race, ethnicity, and origin ACS 2023
- Neighborhood character
- Predominantly White (87%)
- Race & ethnicity
- White 87% Two or more races 8% Asian 3% Hispanic / Latino 2%
- Common ancestry
- Italian 1% Serbian 1% Lithuanian 1%
- Foreign-born
- 2% · China, Vietnam
- Languages at home
- 95% English-only · Spanish 3% Other Asian/Pacific 1% Chinese 1%
Political lean MEDSL · Logan
- 2024 margin
- Solid R (+62.2) · D 17.8% · R 80.0% · Other 2.1%
- 2008→2024 swing
- -23.5pp toward R · 2008: -38.8pp · 2024: -62.2pp
- All cycles
- 2024: R+62.2 2020: R+59.5 2016: R+51.4 2012: R+41.9 2008: R+38.8
Not yet ingested
- Civics
- —
Market trends
- HPI YoY
- ▼ -15.40%
- Current HPI
- 170.513
- Rent YoY
- —
- Metro
- —
- State GDP YoY
- ▲ 3.80%
- F500 in state
- 10
Industry mix (Fortune 500 HQ in AR)
| Industry | F500 HQs | Revenue |
|---|---|---|
| Retail | 1 | $681B |
|
||
| Food / Agriculture | 1 | $53B |
|
||
| Retail / Energy | 1 | $22B |
|
||
| Transportation / Logistics | 1 | $12B |
|
||
| Energy | 1 | $4B |
|
||
Price history
+419.2% since first listed12 events — show timeline
- 2026-06-12 Sold (MLS) $90,000 CARMLS
- 2026-06-12 Sold (MLS) $90,000 NWARMLS
- 2026-05-13 Pending — CARMLS
- 2026-05-13 Pending — NWARMLS
- 2026-05-05 Listed $90,000 CARMLS
- 2026-05-05 Listed $90,000 NWARMLS
- 2025-10-20 Listed $126,000 WRVBOR
- 2021-05-13 Sold (Public Records) $78,000 Public Records
- 2021-05-13 Sold (MLS) $78,000 WRVBOR
- 2020-10-16 Listed $82,500 WRVBOR
- 1995-08-24 Sold (Public Records) $38,000 Public Records
- 1995-03-28 Sold (Public Records) $17,333 Public Records
Property tax history
+10.1%/yrLatest (2025): $82 · -45.1% YoY. Source: county tax records.
Cash-flow waterfall
monthlySold comps — $/sqft
last 12 mo · ≤1 miLoading sold comps…