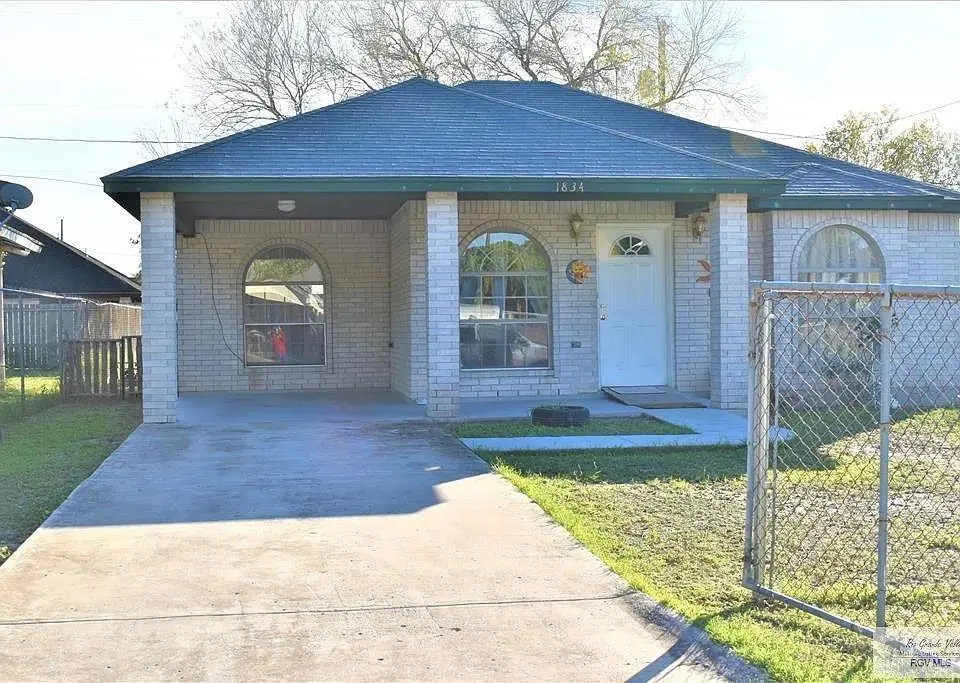
1834 Victoria Dr · Brownsville, TX
Flood risk 1/10 · Minimal
- FEMA flood zone
- X (unshaded)
- Chance of flooding over 30 yrs
- 0.0%
- Est. flood insurance / yr
- $507 – $1,088
Fire risk 4/10 · Minor
- Est. fire insurance / yr
- $1,222 – $2,270
Heat risk 8/10 · Major
- Hot days now (above 111°F)
- 4 days/yr
- Hot days in 30 yrs
- 13 days/yr
Wind risk 9/10 · Severe
- Chance of severe wind over 30 yrs
- 99.0%
Air-quality risk 2/10 · Minimal
- Unhealthy air days now
- 1 days/yr
- Unhealthy air days in 30 yrs
- 1 days/yr
Risk factors via First Street. Map © Google.
Why this score? — see what drove the D+ grade
The composite is a weighted blend of 9 inputs, each scored 0–100. Each bar is that input's sub-score; the figure is the points it added to the 100-point composite (weight × sub-score).
- Cash flow +17.6/30.0
- ARV discount +7.5/15.0
- DSCR +5.5/10.0
- 1% rule +4.5/10.0
- Rent growth +4.5/5.0
- Livability +4.0/5.0
- Condition / age +2.5/5.0
- Schools +2.2/10.0
- Appreciation +0.0/10.0
$149,999
🖨 Deal sheet (PDF) 📄 Offer letter ✓ Due diligence
Listing remarks
Welcome to 1834 Victoria Dr in Brownsville, TX! This charming 3-bedroom, 1-bath brick home offers 926 square feet of comfortable living space and is perfect for first-time homebuyers, or investors. The durable brick exterior provides timeless curb appeal, while the functional floor plan makes the most of every square foot. Step outside and enjoy the spacious backyard, offering plenty of room for entertaining, gardening, pets, or future outdoor improvements. Whether you're looking for a place to call home or a great investment opportunity, this property offers both value and potential. Conveniently located near schools, shopping, dining, and major roadways, this home combines affordability w
Key facts
- Brick exterior
- Spacious backyard
- Conveniently located
Tags
Property features AI
Finance
- HOA & community: No association
Exterior
- Parking: 1 total parking space; 1 covered space; 1 carport space; Attached parking with garage facing front
- Utilities: City sewer
- Home design: Brick construction; Shingle roof; Slab foundation
- Construction: Brick exterior; Shingle roof; Built on slab foundation
- Exterior features: Chain link fencing; Mature trees on lot; Paved road access
Interior
- Kitchen: No conveying appliances
- Flooring: Tile
- Bathrooms: 1 full bathroom
- Heating & cooling: Central heating; Central air conditioning
- Interior features: Tile flooring; Drapes on windows; Laminate countertops
- Laundry & utility: Laundry closet and separate laundry room; Water heater located in laundry room
Neighborhood map
What this means for you Summary
Snapshot
- This is a 3-bed/1.0-bath single-family listed at $150k.
Deal economics
- At list price, monthly cash flow is $119 ($1k/yr) — positive.
- The deal already cash-flows at list — no discount required.
- To meet the 1% rule (rent ≥ 1% of price), the offer needs to be $143k (4.8% below list).
- Recommended offer: $143k (4.8% below list) — sets the bar for 1% rule.
- Cap rate 7.2% vs local median 5.0% in Brownsville — top-decile yield for the area; either an underpriced asset or a hidden risk that comps aren't pricing in. Stress-test before assuming the spread holds.
Location & tenants
- Location reads 79/100 on livability (#62 in TX, #2,311 nationally) — a middle-class / working-renter tenant base. Strengths: commute A+, cost of living A+, housing A+; Watch: amenities D, crime D-, employment F.
- Brownsville ISD (urban): math 20% / reading 34% proficiency, ranked #710 of 826 in TX (top 86%) — low school quality limits family demand, transient renter base, plan for 1-2y turnover; 83% free/reduced lunch — lower-income household profile, screen leases tightly.
- Zoned schools: Aiken El (math 17% / reading 22%, grade F, #3,583 of 4,322 statewide, top 86%, 570 students, 98% FRL); Besteiro Middle (math 14% / reading 28%, grade F, #1,387 of 1,662 statewide, top 85%, 575 students, 98% FRL); Lopez Early College H S (math 20% / reading 39%, grade F, #1,112 of 1,632 statewide, top 70%, 1,831 students, 95% FRL).
- Market conditions: Rents rising fast (+8.2%/yr); 365 active listings in the ZIP; 5 comparable units currently listed for rent nearby; rentals lingering (median 45d on market — plan ~5-8 weeks vacancy on turnover, expect pricing pressure); 80% of comp listings sitting > 30 days — soft ceiling on asking rent; lower-income renter base — watch delinquency; 2,326 units permitted in Cameron County in 2024 (503 in 5+ unit buildings).
- This rent runs 38% of the median local income ($45k/yr) — at the standard rent-burdened threshold; future hikes will face affordability resistance.
Forward outlook
- Local home prices are declining (-3.0%/yr); year-one equity from $1k of loan paydown is wiped out by about $4k of value loss. Plan a longer hold.
- Cameron County population projected at +3% by 2050 — modest demand growth; plan on rents tracking national, not racing it.
- At projected returns (-3.0% appreciation + 8.0% rent growth), your $42k cash investment doubles in ~10 years — after that, you're playing with house money.
Negotiation context
- Only 14 days on market — expect competitive offers; lowballing is unlikely to land.
- 2 sale attempts since 5y ago with the ask held roughly flat each time — persistent listings suggest the price (not the market) is what's stuck; bring a comps-based counter.
Risks & watch-outs
- Climate carrying-cost: severe wind risk, 99% chance of damaging wind over 30y; extreme-heat days projected 4→13/yr by 2055 (HVAC capex compounding) — expect insurance premiums to compound above CPI over the hold.
Questions for the listing agent
- Is there a deadline driving the sale (1031 exchange, divorce, estate, relocation)? That informs how much negotiation room exists.
- Crime grade is D in this area — have there been break-ins, vandalism, or insurance claims at this property in the last 3 years? What carrier currently insures it and at what premium?
- The area grade is low — what's the realistic commute time and amenity access for the typical tenant pool here? Any planned neighborhood developments (good or bad) we should know about?
- What's the average days-on-market for RENTAL listings here right now (not sales)? A rising rental-DOM trend means longer vacancies and softer asking-rent achievability than the comps imply.
- What's the recent tenant-quality profile in this submarket — average credit score on applications, eviction rate, late-payment / NSF rate, and stable-employment percentage? A property-management company in the area should have these aggregated.
- How much new for-sale + rental construction is in the pipeline within 1–3 miles? Heavy new supply typically softens prices + rents 12–24 months out; constrained supply supports both.
Investment metrics
- 1% rule
- 0.95% ✗
- Cap rate
- 7.24%
- Cash-on-cash
- 3.39%
- DSCR
- 1.15
- GRM
- 8.8
CMA / ARV
- ARV (on-the-fly)
- $93,526
- Comps found
- 1
Show comp detail 1 sale within ~0.75 mi
| Address | Dist | Beds/Ba | Sqft | Sold | Price | $/sf | Match |
|---|---|---|---|---|---|---|---|
| 3013 Alameda Dr | 0.37mi | 3/1.0 | 888 (-4%) | 12mo | $90,000 | $101 | 66 |
Match score weights: distance 35% · size 25% · config 20% · recency 20%. Top-matched comps best support the ARV.
Projected returns pro-forma
-3.0% appreciation · 8.0% rent growth · sell at horizon
- IRR
- -5.6%
- Equity multiple
- 0.78×
- Total profit
- $-9,196
- Equity at exit
- $22,365
- IRR
- 9.1%
- Equity multiple
- 1.86×
- Total profit
- $36,084
- Equity at exit
- $12,969
Cash invested: $42,000 (down + closing). Projections, not guarantees.
Landlord ↔ Tenant lean methodology
- Overall (STATE)
- 87 Strongly Landlord-Friendly
- State Texas
- 87 Strongly Landlord-Friendly · R+5
- County
- — inherits STATE
- City
- — inherits STATE
ZIP-level market 78521
- Home prices YoY
- -26.0%
- Rents YoY
- 8.2%
- Active inventory
- 365
- Price-to-rent
- 8.8×
Monthly cashflow live
- Estimated rent
- $1,427 high interval (Pro) →
- Mortgage (P&I)
- −$787
- Tax from tax record
- −$160 /mo · $1,918/yr
- Insurance
- −$62
- HOA
- −$0
- Vacancy / Maint / Mgmt
- −$300
- Net cashflow
- $119
Break-even live
Sensitivity live
| Price | -10% $204 | -5% $161 | +0% $119 | +5% $76 | +10% $34 |
|---|---|---|---|---|---|
| Rent | -10% $6 | -5% $62 | +0% $119 | +5% $175 | +10% $232 |
| Rate | -1.0pp $194 | -0.5pp $157 | base $119 | +0.5pp $80 | +1.0pp $40 |
UW: 25.0% down · 7.5% · 30yr · 1.5% tax · 5.0% vac · 8.0% maint · 8.0% mgmt
Financing live
Cash to close
- Down payment
- $37,500
- Closing costs
- $4,500
- Reserves months
- —
- Total cash needed
- —
Loan-product check · same deal, 3 products live
Conventional
25% down · 7.5% · 30yr
- Down + closing
- —
- Monthly P&I
- —
- Monthly cashflow
- —
- DSCR
- —
- Eligible?
- —
Personal DTI + credit; lowest rate.
DSCR
20% down · 8.5% · 30yr
- Down + closing
- —
- Monthly P&I
- —
- Monthly cashflow
- —
- DSCR
- —
- Eligible?
- —
No personal income docs; deal must DSCR.
Hard money
10% down · 12.0% · 12mo
- Down + closing
- —
- Monthly P&I
- —
- Monthly cashflow
- —
- DSCR
- —
- Eligible?
- —
Short-term bridge; refi at stabilization.
Rent comps 5 comps
| Address | Beds | Baths | Sqft | Rent | $/sqft | DOM | Units | Dist |
|---|---|---|---|---|---|---|---|---|
| 1919 Taxco Dr Brownsville, TX | 3.0 | 1.0 | 1024 | $1,300 | $1.27 | 22d | 1 | 0.12mi |
| 5824 Southmost Rd Unit 132 Brownsville, TX | 3.0 | 1.5 | 1100 | $995 | $0.90 | 45d | 1 | 0.66mi |
| 4995 Alexa Rd Unit B Brownsville, TX | 3.0 | 2.0 | 1063 | $1,750 | $1.65 | 45d | 1 | 0.87mi |
| 2150 Minnesota Ave Brownsville, TX | 1.0–2.0 | 1.0 | 782 | $990 | $1.27 | 45d | 1 | 1.10mi |
| 1898 Morningside Rd Unit 4 Brownsville, TX | 2.0 | 1.0 | 756 | $800 | $1.06 | 45d | 1 | 1.36mi |
Listing history 12 events
-
2026-06-18days on market $149,999 Active 14 DOM
-
2026-06-17days on market $149,999 Active 13 DOM
-
2026-06-16days on market $149,999 Active 12 DOM
-
2026-06-15pricedays on market $149,999 Active 11 DOM
-
2026-06-14days on market $155,000 Active 9 DOM
-
2026-06-13days on market $155,000 Active 8 DOM
-
2026-06-10days on market $155,000 Active 6 DOM
-
2026-06-09days on market $155,000 Active 5 DOM
-
2026-06-08days on market $155,000 Active 4 DOM
-
2026-06-07days on market $155,000 Active 3 DOM
-
2026-06-05remarks 699-char remark
-
2026-06-05$155,000 Active 1 DOM
ⓘ Source: listings_history table (triggers on properties + properties_extension) + one-shot
backfill from property_details.listing_events for pre-trigger history.
Tax reassessment forecast TX · Resets to sale price
- Current annual tax
- $1,918 · $160/mo
- Projected year-2 tax
- $2,745 · $229/mo
- Expected delta
- +$827/yr (+$69/mo · 43.1%)
ⓘ Screening estimate from a state-policy table — verify with the county assessor before closing.
Climate risk First Street
- Flood 1/10 Low FEMA zone X (unshaded) · 0% chance over 30 yrs
- Wildfire 4/10 Moderate
- Heat 8/10 Severe 4 d/yr ≥111°F today · 13 d/yr by 30 yrs out
- Wind 9/10 Extreme 99% chance of damaging wind over 30 yrs
- Air quality 2/10 Low 1 unhealthy d/yr today · 1 by 30 yrs out
Nearby sold comps map
Loading sold comps map…
Walkable amenities ~0.75 mi
Loading nearby amenities…
Taxation est. · year 1
- Rental income
- $17,129
- − Mortgage interest
- −$8,402
- − Property taxes
- −$1,918
- − Insurance
- −$750
- − Repairs & maintenance
- −$1,370
- − Management
- −$1,370
- − Depreciation
- −$4,364
- Taxable loss
- −$1,045
- Est. tax savings @ 24.0%
- +$251
- After-tax cash flow
- $1,676/yr
For passive investors: Depreciation is non-cash, so a rental often shows a tax loss while cash-flowing — sheltering income. Rental losses are passive: they offset passive income freely, and up to $25,000/yr can offset ordinary (W-2) income if you actively participate and your MAGI is under $100k (phasing out to $0 by $150k); unused losses carry forward. On sale, claimed depreciation is recaptured at up to 25%, and gains may owe capital-gains tax (a 1031 exchange can defer both). Figures are a year-1 estimate at your 24.0% rate — not tax advice; consult a CPA.
Schools (NCES district)
- District
- Brownsville ISD
- NCES district ID
- 4811680
- Math proficiency
- 20% ▼ -36.00%
- Reading proficiency
- 34% ▼ -13.00%
- Median HH income
- $30,490
- Composite
- 21.8/100
- National rank
- #8249
- State rank
- #710 of 826 in TX
Livability — Brownsville
- Score
- 79/100
- State rank
- #62
- US rank
- #2311
Category grades
Schools grade is shown separately in the Schools card above.
Census & demographics
- Census place
- Brownsville, TX
- County
- Cameron County · 310,734 people
- City population
- 212,132
- Metro
- Brownsville-Harlingen, TX
- Population (ZIP)
- 87,380
- Household income
- $44,509
- Rent vs Own
- Severe rent burden
- 2682.0
Population outlook (Cameron County) Hauer SSP2
- Today (2025)
- 441,603 people
- By 2030
- 448,113 · +1.5%
- By 2040
- 456,385 · +3.3%
- By 2050
- 456,294 · +3.3%
- By 2075
- 423,851 · -4.0%
- By 2100
- 342,787 · -22.4%
Race, ethnicity, and origin ACS 2023
- Neighborhood character
- Predominantly Hispanic (97%)
- Race & ethnicity
- Hispanic / Latino 97% Two or more races 45% White 3%
- Hispanic origin (detail)
- Mexican 91%
- Foreign-born
- 30% · Canada
- Languages at home
- 12% English-only · Spanish 88%
Political lean MEDSL · Cameron
- 2024 margin
- Lean R (+5.8) · D 46.7% · R 52.5%
- 2008→2024 swing
- -34.6pp toward R · 2008: 28.8pp · 2024: -5.8pp
- All cycles
- 2024: R+5.8 2020: D+13.2 2016: D+32.5 2012: D+32.4 2008: D+28.8
Not yet ingested
- Civics
- —
Market trends
- HPI YoY
- ▼ -81.45%
- Current HPI
- 232.1072
- Rent YoY
- ▲ 8.19%
- Metro
- Brownsville-Harlingen, TX
- State GDP YoY
- ▲ 3.95%
- F500 in state
- 110
Industry mix (Fortune 500 HQ in TX)
| Industry | F500 HQs | Revenue |
|---|---|---|
| Energy | 16 | $1,198B |
|
||
| Technology | 5 | $198B |
|
||
| Engineering / Construction | 4 | $72B |
|
||
| Energy Services | 3 | $60B |
|
||
| Utilities | 3 | $41B |
|
||
| Healthcare | 2 | $330B |
|
||
Price history
+58.2% since first listed3 events — show timeline
- 2026-06-04 Listed $155,000 MCALLENMLS
- 2021-01-13 Listed $98,000 RGVMLS
- 2019-07-22 Sold (Public Records) — Public Records
Property tax history
+4.5%/yrLatest (2025): $1,918 · +0.2% YoY. Source: county tax records.
Cash-flow waterfall
monthlySold comps — $/sqft
last 12 mo · ≤1 miLoading sold comps…