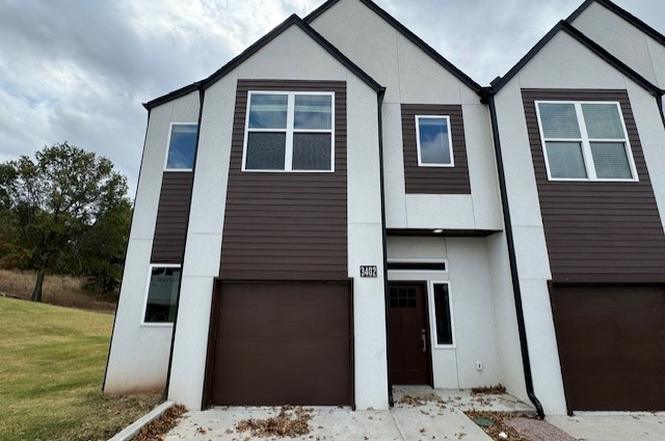
3402 Redbud Ln · Sapulpa, OK
Flood risk 1/10 · Minimal
- FEMA flood zone
- X (unshaded)
- Chance of flooding over 30 yrs
- 0.0%
- Est. flood insurance / yr
- $507 – $1,088
Fire risk 6/10 · Moderate
- Est. fire insurance / yr
- $2,463 – $4,575
Heat risk 6/10 · Moderate
- Hot days now (above 112°F)
- 7 days/yr
- Hot days in 30 yrs
- 17 days/yr
Wind risk 3/10 · Minor
- Chance of severe wind over 30 yrs
- 4.0%
Air-quality risk 2/10 · Minimal
- Unhealthy air days now
- 1 days/yr
- Unhealthy air days in 30 yrs
- 1 days/yr
Risk factors via First Street. Map © Google.
Why this score? — see what drove the D- grade
The composite is a weighted blend of 9 inputs, each scored 0–100. Each bar is that input's sub-score; the figure is the points it added to the 100-point composite (weight × sub-score).
- Cash flow +11.4/30.0
- ARV discount +7.5/15.0
- 1% rule +4.5/10.0
- Livability +3.4/5.0
- DSCR +3.3/10.0
- Schools +3.2/10.0
- Rent growth +2.5/5.0
- Condition / age +2.5/5.0
- Appreciation +0.0/10.0
$234,900
🖨 Deal sheet (PDF) 📄 Offer letter ✓ Due diligence
Listing remarks
Amazing luxury townhome living in Jenks Schools. .. Beautiful two story town house features an open living floor plan, beautiful kitchen with stainless appliances, nice dining area, large living with electric flame fireplace that is so chic and inviting. .. .all bedrooms are up. .. master features a nice en suite bath with walk in shower and double sinks, it also has a large walk in closet. .. town home also has an office or space room up. .. .community is gated. .. .
Key facts
- Double sinks
- Stainless appliances
- En suite bath
Tags
Property features AI
Exterior
- Parking: Attached garage (1 car)
- Security: No safety shelter
- Utilities: Public water; Public sewer; Electricity available; Natural gas available; Cable available
- Home design: Two-story; Faces north; Slab foundation
- Construction: Built with stucco and wood frame; Asphalt/fiberglass roof
- Exterior features: Patio; Zero lot line
Interior
- Kitchen: Dishwasher; Microwave; Oven; Range; Refrigerator; Gas water heater
- Flooring: Tile flooring; Vinyl flooring
- Bathrooms: Two full bathrooms; One half bathroom
- Heating & cooling: Central heating (gas); Central air conditioning
- Interior features: Granite counters; High ceilings; Ceiling fan(s); Vinyl window features
Neighborhood map
What this means for you Summary
Snapshot
- This is a 3-bed/2.0-bath townhouse listed at $235k.
Deal economics
- At list price, monthly cash flow is $-84 ($-1k/yr) — negative.
- To cash-flow at today's rent, offer at most $220k (6.3% below list).
- To meet the 1% rule (rent ≥ 1% of price), the offer needs to be $222k (5.3% below list).
- Recommended offer: $207k (12.0% below list) — sets the bar for market timing.
- Cap rate 5.9% vs local median 2.8% in Sapulpa — top-decile yield for the area; either an underpriced asset or a hidden risk that comps aren't pricing in. Stress-test before assuming the spread holds.
Location & tenants
- Location reads 67/100 on livability (#88 in OK) — a middle-class / working-renter tenant base. Strengths: cost of living A+, housing A+, crime B+; Watch: schools F, amenities F, commute F.
- Jenks (suburban): math 34% / reading 35% proficiency, ranked #27 of 270 in OK (top 10%) — families likely to look elsewhere, expect single-tenant / working-renter base with shorter leases.
- Market conditions: 96 active listings in the ZIP; 3 comparable units currently listed for rent nearby; rentals leasing fast (median 13d on market — plan ~1-2 weeks tenant-placement turnaround); 193 units permitted in Creek County in 2024 (76 in 5+ unit buildings).
Forward outlook
- Local home prices are declining (-3.0%/yr); year-one equity from $2k of loan paydown is wiped out by about $7k of value loss. Plan a longer hold.
Negotiation context
- It's been on market 139 days — a 12% lower offer ($207k) is reasonable based on typical stale-listing flexibility.
- 4 sale attempts since 2y ago; this cycle's ask has dropped $55k (19%) from the opening price — seller is motivated, your offer sets the floor, not the list.
Risks & watch-outs
- Watch-outs: property tax is 2.6% of price.
- Climate carrying-cost: major wildfire risk; extreme-heat days projected 7→17/yr by 2055 (HVAC capex compounding) — expect insurance premiums to compound above CPI over the hold.
Questions for the listing agent
- What do current leases actually rent for vs. the listed asking? Can we see a recent rent roll and the last 12 months of T-12 income?
- It's been on market 139 days. Have you received any prior offers? Is the seller open to a 12% concession, seller financing, or rate buy-down credit?
- Property tax is high relative to price — has the assessment been appealed recently, and will the sale trigger a re-assessment?
- Why hasn't it sold? Are there any deal-killer items the seller is aware of (foundation, flood, title, zoning, code violations)?
- Is there a deadline driving the sale (1031 exchange, divorce, estate, relocation)? That informs how much negotiation room exists.
- Schools are F-rated, which usually means shorter tenancies and higher turnover. Who's the typical renter profile here, and what's been the actual vacancy rate?
- The area grade is low — what's the realistic commute time and amenity access for the typical tenant pool here? Any planned neighborhood developments (good or bad) we should know about?
- What's the average days-on-market for RENTAL listings here right now (not sales)? A rising rental-DOM trend means longer vacancies and softer asking-rent achievability than the comps imply.
- What's the recent tenant-quality profile in this submarket — average credit score on applications, eviction rate, late-payment / NSF rate, and stable-employment percentage? A property-management company in the area should have these aggregated.
- How much new for-sale + rental construction is in the pipeline within 1–3 miles? Heavy new supply typically softens prices + rents 12–24 months out; constrained supply supports both.
Investment metrics
- 1% rule
- 0.95% ✗
- Cap rate
- 5.87%
- Cash-on-cash
- -1.53%
- DSCR
- 0.93
- GRM
- 8.8
CMA / ARV
No comps found within radius.
Projected returns pro-forma
-3.0% appreciation · 3.0% rent growth · sell at horizon
- IRR
- -18.7%
- Equity multiple
- 0.34×
- Total profit
- $-43,226
- Equity at exit
- $35,024
- IRR
- -11.0%
- Equity multiple
- 0.33×
- Total profit
- $-43,822
- Equity at exit
- $20,310
Cash invested: $65,772 (down + closing). Projections, not guarantees.
Landlord ↔ Tenant lean methodology
- Overall (STATE)
- 83 Strongly Landlord-Friendly
- State Oklahoma
- 83 Strongly Landlord-Friendly · R+20
- County
- — inherits STATE
- City
- — inherits STATE
ZIP-level market 74132
- Home prices YoY
- -34.7%
- Active inventory
- 96
- Price-to-rent
- 8.8×
Monthly cashflow live
- Estimated rent
- $2,225 medium interval (Pro) →
- Mortgage (P&I)
- −$1,232
- Tax from tax record
- −$511 /mo · $6,136/yr
- Insurance
- −$98
- HOA
- −$0
- Vacancy / Maint / Mgmt
- −$467
- Net cashflow
- $-84
Break-even live
Sensitivity live
| Price | -10% $49 | -5% $-17 | +0% $-84 | +5% $-150 | +10% $-217 |
|---|---|---|---|---|---|
| Rent | -10% $-259 | -5% $-172 | +0% $-84 | +5% $4 | +10% $92 |
| Rate | -1.0pp $35 | -0.5pp $-24 | base $-84 | +0.5pp $-145 | +1.0pp $-206 |
UW: 25.0% down · 7.5% · 30yr · 1.5% tax · 5.0% vac · 8.0% maint · 8.0% mgmt
Financing live
Cash to close
- Down payment
- $58,725
- Closing costs
- $7,047
- Reserves months
- —
- Total cash needed
- —
Loan-product check · same deal, 3 products live
Conventional
25% down · 7.5% · 30yr
- Down + closing
- —
- Monthly P&I
- —
- Monthly cashflow
- —
- DSCR
- —
- Eligible?
- —
Personal DTI + credit; lowest rate.
DSCR
20% down · 8.5% · 30yr
- Down + closing
- —
- Monthly P&I
- —
- Monthly cashflow
- —
- DSCR
- —
- Eligible?
- —
No personal income docs; deal must DSCR.
Hard money
10% down · 12.0% · 12mo
- Down + closing
- —
- Monthly P&I
- —
- Monthly cashflow
- —
- DSCR
- —
- Eligible?
- —
Short-term bridge; refi at stabilization.
Rent comps 3 comps
| Address | Beds | Baths | Sqft | Rent | $/sqft | DOM | Units | Dist |
|---|---|---|---|---|---|---|---|---|
| 3401 Redbud Ln Tulsa, OK | 3.0 | 2.5 | 1708 | $2,250 | $1.32 | 2d | 5 | 0.04mi |
| 1551 W 78th St Tulsa, OK | 1.0–2.0 | 1.0–2.0 | 919 | $1,390 | $1.51 | 12d | 5 | 1.29mi |
| 2542 W 66th Pl Tulsa, OK | 4.0 | 2.0 | 2200 | $2,400 | $1.09 | 24d | 1 | 1.50mi |
Listing history 22 events
-
2026-06-13statusdays on market $234,900 Pending 139 DOM
-
2026-06-10days on market $234,900 Active 138 DOM
-
2026-06-09days on market $234,900 Active 137 DOM
-
2026-06-08days on market $234,900 Active 136 DOM
-
2026-06-07days on market $234,900 Active 135 DOM
-
2026-06-05days on market $234,900 Active 132 DOM
-
2026-06-03pricedays on market $234,900 Active 131 DOM
-
2026-06-02pricedays on market $195,000 Active 130 DOM
-
2026-06-01days on market $289,900 Active 129 DOM
-
2026-05-31days on market $289,900 Active 128 DOM
-
2026-01-23$289,900 Active
-
2026-01-20status Active
-
2025-09-30historical
-
2025-08-31status Pending
-
2025-08-29status Active
-
2025-07-21status Pending
-
2025-05-15price $289,900
-
2025-04-15price $299,900
-
2025-02-13price $310,000
-
2025-01-14price $319,900
-
2024-12-13price $329,900
-
2024-11-12$339,900 Active
ⓘ Source: listings_history table (triggers on properties + properties_extension) + one-shot
backfill from property_details.listing_events for pre-trigger history.
Tax reassessment forecast OK · Resets to sale price
- Current annual tax
- $6,136 · $511/mo
- Projected year-2 tax
- $6,136 · $511/mo
- Expected delta
- $0/yr ($0/mo · 0.0%)
ⓘ Screening estimate from a state-policy table — verify with the county assessor before closing.
Climate risk First Street
- Flood 1/10 Low FEMA zone X (unshaded) · 0% chance over 30 yrs
- Wildfire 6/10 Major
- Heat 6/10 Major 7 d/yr ≥112°F today · 17 d/yr by 30 yrs out
- Wind 3/10 Moderate 4% chance of damaging wind over 30 yrs
- Air quality 2/10 Low 1 unhealthy d/yr today · 1 by 30 yrs out
Nearby sold comps map
Loading sold comps map…
Walkable amenities ~0.75 mi
Loading nearby amenities…
Taxation est. · year 1
- Rental income
- $26,694
- − Mortgage interest
- −$13,158
- − Property taxes
- −$6,136
- − Insurance
- −$1,174
- − Repairs & maintenance
- −$2,136
- − Management
- −$2,136
- − Depreciation
- −$6,833
- Taxable loss
- −$4,879
- Est. tax savings @ 24.0%
- +$1,171
- After-tax cash flow
- $167/yr
For passive investors: Depreciation is non-cash, so a rental often shows a tax loss while cash-flowing — sheltering income. Rental losses are passive: they offset passive income freely, and up to $25,000/yr can offset ordinary (W-2) income if you actively participate and your MAGI is under $100k (phasing out to $0 by $150k); unused losses carry forward. On sale, claimed depreciation is recaptured at up to 25%, and gains may owe capital-gains tax (a 1031 exchange can defer both). Figures are a year-1 estimate at your 24.0% rate — not tax advice; consult a CPA.
Schools (NCES district)
- District
- Jenks
- NCES district ID
- 4015720
- Math proficiency
- 34% ▼ -9.00%
- Reading proficiency
- 35% ▼ -8.00%
- Median HH income
- $66,291
- Composite
- 31.5/100
- National rank
- #5973
- State rank
- #27 of 270 in OK
Livability — Sapulpa
- Score
- 67/100
- State rank
- #88
- US rank
- #10676
Category grades
Schools grade is shown separately in the Schools card above.
Census & demographics
- Census place
- Sapulpa, OK
- City population
- 32,292
- Population (ZIP)
- 10,629
Population outlook (Creek County) Hauer SSP2
- Today (2025)
- 72,706 people
- By 2030
- 73,032 · +0.4%
- By 2040
- 72,788 · +0.1%
- By 2050
- 71,558 · -1.6%
- By 2075
- 69,248 · -4.8%
- By 2100
- 62,722 · -13.7%
Race, ethnicity, and origin ACS 2023
- Neighborhood character
- Predominantly White (69%)
- Race & ethnicity
- White 69% Two or more races 12% Hispanic / Latino 8% Native American 6% Asian 5% Black 3%
- Hispanic origin (detail)
- Mexican 5%
- Common ancestry
- Slovak 2% Lithuanian 2% Italian 2%
- Foreign-born
- 6% · Canada, Philippines, China
- Languages at home
- 94% English-only · Other Asian/Pacific 2% Spanish 2% Chinese 1%
Political lean MEDSL · Creek
- 2024 margin
- Solid R (+55.7) · D 21.2% · R 77.0% · Other 1.8%
- 2008→2024 swing
- -14.1pp toward R · 2008: -41.6pp · 2024: -55.7pp
- All cycles
- 2024: R+55.7 2020: R+54.8 2016: R+54.5 2012: R+45.4 2008: R+41.6
Not yet ingested
- Civics
- —
Market trends
- HPI YoY
- ▼ -129.74%
- Current HPI
- 244.1502
- Rent YoY
- —
- Metro
- —
- State GDP YoY
- ▲ 1.55%
- F500 in state
- 6
Industry mix (Fortune 500 HQ in OK)
| Industry | F500 HQs | Revenue |
|---|---|---|
| Energy | 3 | $48B |
|
||
Price history
-14.7% since first listed12 events — show timeline
- 2026-01-23 Listed $289,900 MLS Technology, Inc.
- 2026-01-20 Relisted — MLS Technology, Inc.
- 2025-09-30 Listing Removed — MLS Technology, Inc.
- 2025-08-31 Pending — MLS Technology, Inc.
- 2025-08-29 Relisted — MLS Technology, Inc.
- 2025-07-21 Pending — MLS Technology, Inc.
- 2025-05-15 Price Changed $289,900 MLS Technology, Inc.
- 2025-04-15 Price Changed $299,900 MLS Technology, Inc.
- 2025-02-13 Price Changed $310,000 MLS Technology, Inc.
- 2025-01-14 Price Changed $319,900 MLS Technology, Inc.
- 2024-12-13 Price Changed $329,900 MLS Technology, Inc.
- 2024-11-12 Listed $339,900 MLS Technology, Inc.
Property tax history
+435.3%/yrLatest (2025): $6,136 · -16.4% YoY. Source: county tax records.
Cash-flow waterfall
monthlySold comps — $/sqft
last 12 mo · ≤1 miLoading sold comps…