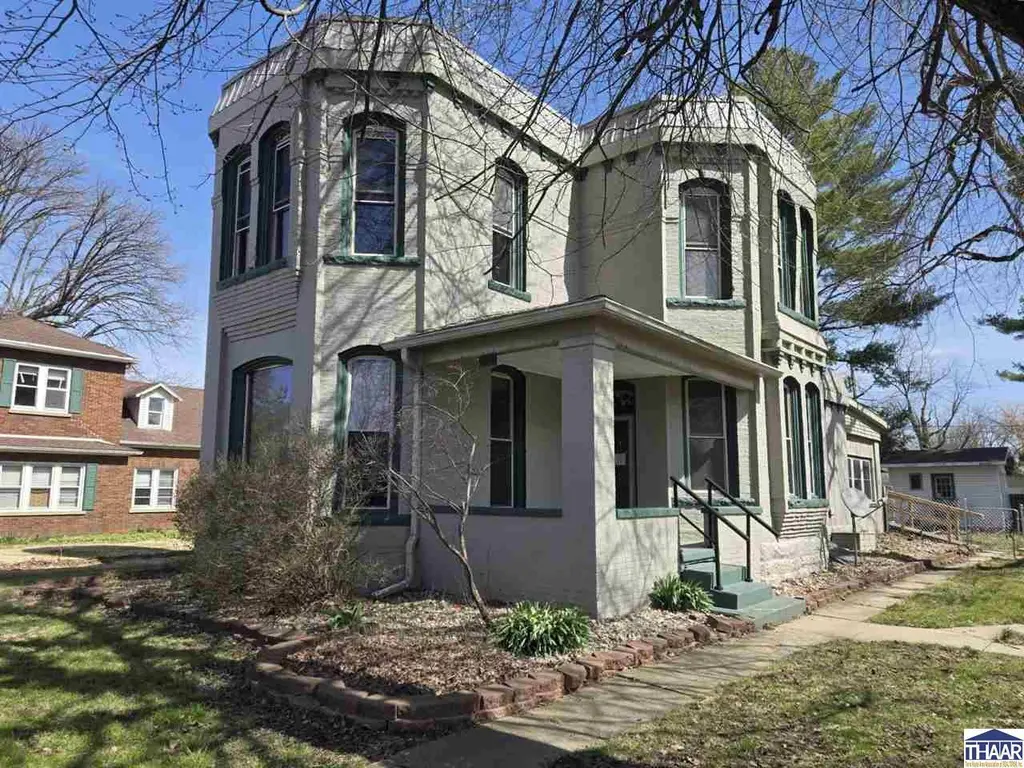
214 N Maple St · Dana, IN
Flood risk 1/10 · Minimal
- FEMA flood zone
- X (unshaded)
- Chance of flooding over 30 yrs
- 0.0%
- Est. flood insurance / yr
- $473 – $860
Fire risk 1/10 · Minimal
- Est. fire insurance / yr
- $717 – $1,331
Heat risk 4/10 · Minor
- Hot days now (above 105°F)
- 7 days/yr
- Hot days in 30 yrs
- 18 days/yr
Wind risk 2/10 · Minimal
- Chance of severe wind over 30 yrs
- 1.0%
Air-quality risk 2/10 · Minimal
- Unhealthy air days now
- 1 days/yr
- Unhealthy air days in 30 yrs
- 1 days/yr
Risk factors via First Street. Map © Google.
Why this score? — see what drove the C grade
The composite is a weighted blend of 9 inputs, each scored 0–100. Each bar is that input's sub-score; the figure is the points it added to the 100-point composite (weight × sub-score).
- Cash flow +19.5/30.0
- ARV discount +7.5/15.0
- Appreciation +6.8/10.0
- DSCR +6.1/10.0
- 1% rule +5.3/10.0
- Schools +3.1/10.0
- Livability +2.8/5.0
- Rent growth +2.5/5.0
- Condition / age +2.5/5.0
$115,000
🖨 Deal sheet 📄 Offer letter ✓ Due diligence
Listing remarks MLS
This historical home is a "Castle Home" in Dana Indiana. Home offers natural woodwork with built-in cabinets, beautiful staircase. Home had many updated over the past few years. Home has a good size kitchen with stainless steel sink and some appliances that was left with no guarantee. Home includes a 2-bedroom 1-bath apartment over the garage currently that could be extra income or a guest house for family members.
Key facts
- Natural woodwork
- Beautiful staircase
- Good size kitchen
Tags
Property features AI
Finance
- Other: Lot approximately 0.37 acres (1/4–1/2 acre)
Exterior
- Parking: Detached 2-car garage (720 sq ft)
- Utilities: Public water; Municipal sewer connected
- Home design: Single-family residence; Two levels (main and upper); Residential property
- Construction: Cultured stone exterior; Partial foundation
- Exterior features: Covered porch; Deck
Interior
- Kitchen: No appliances included
- Bedrooms: Three bedrooms on the upper level
- Bathrooms: Two full bathrooms; One half bathroom (main level)
- Heating & cooling: Electric forced-air heating; Central air conditioning
- Interior features: Attic access; Basement (partial)
- Laundry & utility: Main level laundry room (5.0 x 10.0)
Neighborhood map
What this means for you Summary
Snapshot
- This is a 3-bed/2.0-bath single-family listed at $115k.
Deal economics
- At list price, monthly cash flow is $130 ($2k/yr) — positive.
- The deal already cash-flows at list — no discount required.
- Meets the 1% rule at list price ($1k rent vs $115k).
- Recommended offer: $108k (6.0% below list) — sets the bar for market timing.
Location & tenants
- Location reads 55/100 on livability (#626 in IN) — a working-class tenant base; expect higher turnover. Strengths: cost of living A+, housing A-; Watch: crime D, amenities F, commute F.
- South Vermillion Community School Corporation (rural): math 31% / reading 42% proficiency, ranked #182 of 301 in IN (top 60%) — families likely to look elsewhere, expect single-tenant / working-renter base with shorter leases.
- Zoned schools: Van Duyn Elementary School (math 37% / reading 32%, grade F, #597 of 994 statewide, top 63%, 247 students, 53% FRL); South Vermillion High School (math 27% / reading 62%, grade F, #169 of 369 statewide, top 51%, 478 students, 54% FRL).
- Market conditions: 8 active listings in the ZIP; 28 units permitted in Vermillion County in 2024 (0 in 5+ unit buildings).
Forward outlook
- In year one you build about $5k of equity ($795 loan paydown + $4k appreciation (3.7% local appreciation)).
- Vermillion County population projected at -22% by 2050 — secular population decline; favor cash flow + early exit over multi-decade hold.
- At projected returns (3.7% appreciation + 3.0% rent growth), your $32k cash investment doubles in ~5 years — after that, you're playing with house money.
- By year 7, paydown + projected appreciation supports a ~$32k cash-out refi (75% LTV) — recoverable capital for the next deal without selling this one.
Negotiation context
- It's been on market 72 days — a 6% lower offer ($108k) is reasonable based on typical stale-listing flexibility.
- 2 sale attempts; this cycle's ask has dropped $20k (15%) from the opening price — seller is motivated, your offer sets the floor, not the list.
Risks & watch-outs
- Watch-outs: built in 1885 — expect roof / HVAC / electrical / plumbing capex.
Questions for the listing agent
- It's been on market 72 days. Have you received any prior offers? Is the seller open to a 6% concession, seller financing, or rate buy-down credit?
- Built in 1885 — when were the roof, HVAC, electrical panel, plumbing, and water heater last replaced?
- Why hasn't it sold? Are there any deal-killer items the seller is aware of (foundation, flood, title, zoning, code violations)?
- Is there a deadline driving the sale (1031 exchange, divorce, estate, relocation)? That informs how much negotiation room exists.
- Schools are F-rated, which usually means shorter tenancies and higher turnover. Who's the typical renter profile here, and what's been the actual vacancy rate?
- Crime grade is D in this area — have there been break-ins, vandalism, or insurance claims at this property in the last 3 years? What carrier currently insures it and at what premium?
- What's the average days-on-market for RENTAL listings here right now (not sales)? A rising rental-DOM trend means longer vacancies and softer asking-rent achievability than the comps imply.
- What's the recent tenant-quality profile in this submarket — average credit score on applications, eviction rate, late-payment / NSF rate, and stable-employment percentage? A property-management company in the area should have these aggregated.
- How much new for-sale + rental construction is in the pipeline within 1–3 miles? Heavy new supply typically softens prices + rents 12–24 months out; constrained supply supports both.
Investment metrics
- 1% rule
- 1.03% ✓
- Cap rate
- 7.65%
- Cash-on-cash
- 4.83%
- DSCR
- 1.21
- GRM
- 8.1
CMA / ARV
No comps found within radius.
Projected returns pro-forma
3.66% appreciation · 3.0% rent growth · sell at horizon
- IRR
- 13.7%
- Equity multiple
- 1.81×
- Total profit
- $26,193
- Equity at exit
- $56,029
- IRR
- 15.2%
- Equity multiple
- 3.39×
- Total profit
- $76,846
- Equity at exit
- $89,868
Cash invested: $32,200 (down + closing). Projections, not guarantees.
Landlord ↔ Tenant lean methodology
- Overall (STATE)
- 90 Strongly Landlord-Friendly
- State Indiana
- 90 Strongly Landlord-Friendly · R+11
- County
- — inherits STATE
- City
- — inherits STATE
ZIP-level market 47847
- Home prices YoY
- 1.7%
- Active inventory
- 8
- Price-to-rent
- 8.1×
Monthly cashflow live
- Estimated rent
- $1,188 medium interval (Pro) →
- Mortgage (P&I)
- −$603
- Tax from tax record
- −$158 /mo · $1,895/yr
- Insurance
- −$48
- HOA
- −$0
- Vacancy / Maint / Mgmt
- −$249
- Net cashflow
- $130
Break-even live
UW: 25.0% down · 7.5% · 30yr · 1.5% tax · 5.0% vac · 8.0% maint · 8.0% mgmt
Financing live
Cash to close
- Down payment
- $28,750
- Closing costs
- $3,450
- Reserves months
- —
- Total cash needed
- —
Loan-product check · same deal, 3 products live
Conventional
25% down · 7.5% · 30yr
- Down + closing
- —
- Monthly P&I
- —
- Monthly cashflow
- —
- DSCR
- —
- Eligible?
- —
Personal DTI + credit; lowest rate.
DSCR
20% down · 8.5% · 30yr
- Down + closing
- —
- Monthly P&I
- —
- Monthly cashflow
- —
- DSCR
- —
- Eligible?
- —
No personal income docs; deal must DSCR.
Hard money
10% down · 12.0% · 12mo
- Down + closing
- —
- Monthly P&I
- —
- Monthly cashflow
- —
- DSCR
- —
- Eligible?
- —
Short-term bridge; refi at stabilization.
Listing history 20 events
-
2026-06-18days on market $115,000 Active 72 DOM
-
2026-06-17days on market $115,000 Active 71 DOM
-
2026-06-16days on market $115,000 Active 70 DOM
-
2026-06-15days on market $115,000 Active 69 DOM
-
2026-06-13days on market $115,000 Active 67 DOM
-
2026-06-12pricedays on market $115,000 Active 66 DOM
-
2026-06-09days on market $125,000 Active 63 DOM
-
2026-06-08days on market $125,000 Active 62 DOM
-
2026-06-07days on market $125,000 Active 61 DOM
-
2026-06-07days on market $125,000 Active 60 DOM
-
2026-06-04days on market $125,000 Active 57 DOM
-
2026-06-02days on market $125,000 Active 56 DOM
-
2026-06-01days on market $125,000 Active 55 DOM
-
2026-05-31days on market $125,000 Active 54 DOM
-
2026-05-31days on market $125,000 Active 53 DOM
-
2026-05-13price $125,000
Show marketing remark (428 chars)
This historical home is a "Castle Home" in Dana Indiana. Home offers natural woodwork with built-in cabinets, beautiful staircase. Home had many updated over the past few years. Home has a good size kitchen with stainless steel sink and some appliances that was left with no guarantee. Home includes a 2-bedroom 1-bath apartment over the garage currently that could be extra income or a guest house for family members.
-
2026-05-13price $125,000 428-char remark
Show marketing remark (428 chars)
This historical home is a "Castle Home" in Dana Indiana. Home offers natural woodwork with built-in cabinets, beautiful staircase. Home had many updated over the past few years. Home has a good size kitchen with stainless steel sink and some appliances that was left with no guarantee. Home includes a 2-bedroom 1-bath apartment over the garage currently that could be extra income or a guest house for family members.
-
2026-04-07$135,000 Active 428-char remark
Show marketing remark (428 chars)
This historical home is a "Castle Home" in Dana Indiana. Home offers natural woodwork with built-in cabinets, beautiful staircase. Home had many updated over the past few years. Home has a good size kitchen with stainless steel sink and some appliances that was left with no guarantee. Home includes a 2-bedroom 1-bath apartment over the garage currently that could be extra income or a guest house for family members.
-
2026-04-06$135,000 Active
-
2021-12-08soldstatus $190,000
ⓘ Source: listings_history table (triggers on properties + properties_extension) + one-shot
backfill from property_details.listing_events for pre-trigger history.
Tax reassessment forecast IN · Partial reset (capped growth)
- Current annual tax
- $1,895 · $158/mo
- Projected year-2 tax
- $1,895 · $158/mo
- Expected delta
- $0/yr ($0/mo · 0.0%)
ⓘ Screening estimate from a state-policy table — verify with the county assessor before closing.
Climate risk First Street
- Flood 1/10 Low FEMA zone X (unshaded) · 0% chance over 30 yrs
- Wildfire 1/10 Low
- Heat 4/10 Moderate 7 d/yr ≥105°F today · 18 d/yr by 30 yrs out
- Wind 2/10 Low 100% chance of damaging wind over 30 yrs
- Air quality 2/10 Low 1 unhealthy d/yr today · 1 by 30 yrs out
Nearby sold comps map
Loading sold comps map…
Walkable amenities ~0.75 mi
Loading nearby amenities…
Taxation est. · year 1
- Rental income
- $14,255
- − Mortgage interest
- −$6,442
- − Property taxes
- −$1,895
- − Insurance
- −$575
- − Repairs & maintenance
- −$1,140
- − Management
- −$1,140
- − Depreciation
- −$3,345
- Taxable loss
- −$283
- Est. tax savings @ 24.0%
- +$68
- After-tax cash flow
- $1,623/yr
For passive investors: Depreciation is non-cash, so a rental often shows a tax loss while cash-flowing — sheltering income. Rental losses are passive: they offset passive income freely, and up to $25,000/yr can offset ordinary (W-2) income if you actively participate and your MAGI is under $100k (phasing out to $0 by $150k); unused losses carry forward. On sale, claimed depreciation is recaptured at up to 25%, and gains may owe capital-gains tax (a 1031 exchange can defer both). Figures are a year-1 estimate at your 24.0% rate — not tax advice; consult a CPA.
Schools (NCES district)
- District
- South Vermillion Community School Corporation
- NCES district ID
- 1810590
- Math proficiency
- 31% ▼ -6.00%
- Reading proficiency
- 42% ▬ 0.00%
- Median HH income
- $42,809
- Composite
- 30.87/100
- National rank
- #6123
- State rank
- #182 of 301 in IN
Livability — Dana
- Score
- 55/100
- State rank
- #626
- US rank
- #23211
Category grades
Schools grade is shown separately in the Schools card above.
Census & demographics
- Census place
- Dana, IN
- Population (ZIP)
- 869
Population outlook (Vermillion County) Hauer SSP2
- Today (2025)
- 14,605 people
- By 2030
- 13,942 · -4.5%
- By 2040
- 12,592 · -13.8%
- By 2050
- 11,381 · -22.1%
- By 2075
- 9,063 · -37.9%
- By 2100
- 7,098 · -51.4%
Race, ethnicity, and origin ACS 2023
- Neighborhood character
- Predominantly White (96%)
- Race & ethnicity
- White 96% Two or more races 4%
- Common ancestry
- Slovak 3% Lithuanian 3% Romanian 3%
Political lean MEDSL · Vermillion
- 2024 margin
- Solid R (+44.7) · D 26.6% · R 71.3% · Other 2.1%
- 2008→2024 swing
- -58.7pp toward R · 2008: 13.9pp · 2024: -44.7pp
- All cycles
- 2024: R+44.7 2020: R+40.6 2016: R+35.1 2012: R+6.8 2008: D+13.9
Not yet ingested
- Civics
- —
Market trends
- HPI YoY
- ▲ 3.66%
- Current HPI
- 221.4088
- Rent YoY
- —
- Metro
- —
- State GDP YoY
- ▲ 2.90%
- F500 in state
- 18
Industry mix (Fortune 500 HQ in IN)
| Industry | F500 HQs | Revenue |
|---|---|---|
| Industrial Machinery | 2 | $37B |
|
||
| Healthcare | 1 | $177B |
|
||
| Pharmaceuticals | 1 | $45B |
|
||
| Metals / Steel | 1 | $18B |
|
||
| Agriculture | 1 | $17B |
|
||
| Packaging | 1 | $12B |
|
||
Price history
-34.2% since first listed5 events — show timeline
- 2026-05-13 Price Changed $125,000 MIBOR as Distributed by MLS Grid
- 2026-05-13 Price Changed $125,000 THAAR
- 2026-04-07 Listed $135,000 THAAR
- 2026-04-06 Listed $135,000 MIBOR as Distributed by MLS Grid
- 2021-12-08 Sold (Public Records) $190,000 Public Records
Property tax history
-3.4%/yrLatest (2024): $1,895 · +9.3% YoY. Source: county tax records.
Cash-flow waterfall
monthlySold comps — $/sqft
last 12 mo · ≤1 miLoading sold comps…