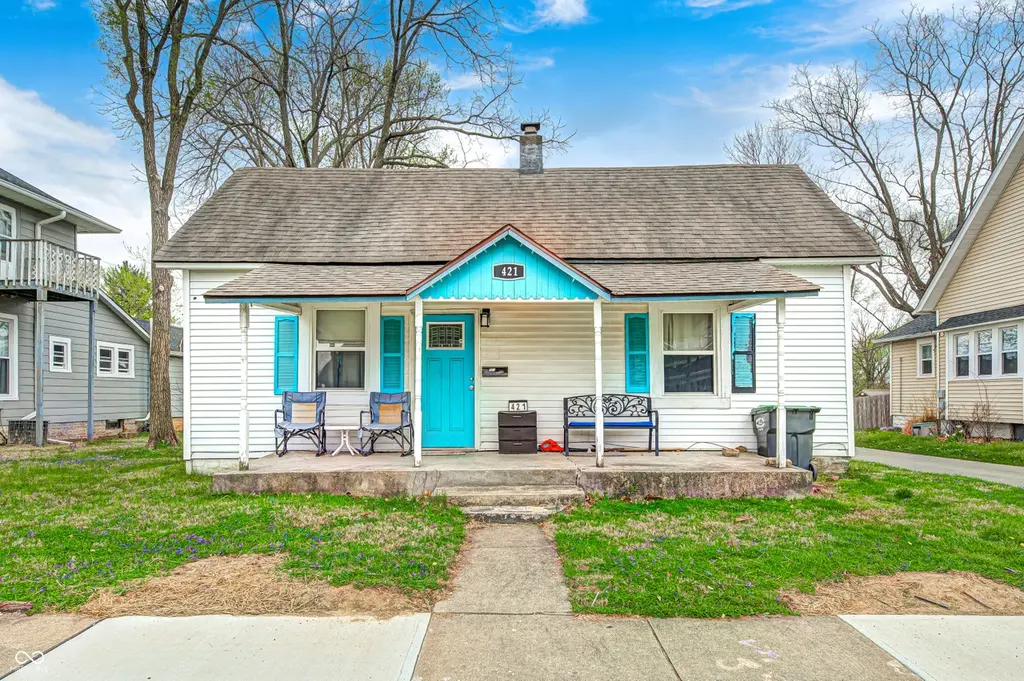
421 W Broadway St · Greenwood, IN
Flood risk 1/10 · Minimal
- FEMA flood zone
- X (unshaded)
- Chance of flooding over 30 yrs
- 0.0%
- Est. flood insurance / yr
- $507 – $1,088
Fire risk 1/10 · Minimal
- Est. fire insurance / yr
- $717 – $1,331
Heat risk 3/10 · Minor
- Hot days now (above 101°F)
- 7 days/yr
- Hot days in 30 yrs
- 18 days/yr
Wind risk 2/10 · Minimal
- Chance of severe wind over 30 yrs
- 1.0%
Air-quality risk 2/10 · Minimal
- Unhealthy air days now
- 2 days/yr
- Unhealthy air days in 30 yrs
- 2 days/yr
Risk factors via First Street. Map © Google.
Why this score? — see what drove the C- grade
The composite is a weighted blend of 9 inputs, each scored 0–100. Each bar is that input's sub-score; the figure is the points it added to the 100-point composite (weight × sub-score).
- Cash flow +15.5/30.0
- ARV discount +15.0/15.0
- DSCR +4.8/10.0
- Schools +4.0/10.0
- Livability +3.7/5.0
- 1% rule +3.3/10.0
- Rent growth +2.5/5.0
- Condition / age +2.5/5.0
- Appreciation +0.0/10.0
$190,000
🖨 Deal sheet (PDF) 📄 Offer letter ✓ Due diligence
Listing remarks MLS
Great opportunity to own in a growing area near downtown Greenwood where many homes are being updated and revitalized. This property offers the perfect chance to add your personal touch, create value, and make it truly your own. The home features 3 bedrooms with a functional layout that provides flexibility for a variety of living arrangements. Whether you are looking for a primary residence or an investment opportunity, this home has solid potential in an area seeing continued improvement and pride of ownership. Step outside to enjoy a fenced backyard-ideal for pets, entertaining, or simply relaxing. A 2-car detached garage provides ample room for parking, storage, or even a workshop setup. Located just minutes from downtown Greenwood, you will appreciate the easy access to local shops, restaurants, 4 parks, and everyday amenities. Convenient access to major roadways makes commuting simple while still enjoying the charm of an established neighborhood. Whether you are a buyer looking to customize your next home or an investor seeking opportunity in an improving area, this property is full of potential and ready for its next chapter.
Key facts
- Fenced backyard
- Detached garage
- 8,233 sq ft lot
Tags
Neighborhood map
What this means for you Summary
Snapshot
- This is a 3-bed/2.0-bath single-family listed at $190k.
Deal economics
- At list price, monthly cash flow is $75 ($898/yr) — positive.
- The deal already cash-flows at list — no discount required.
- To meet the 1% rule (rent ≥ 1% of price), the offer needs to be $158k (16.9% below list).
- Recommended offer: $158k (16.9% below list) — sets the bar for 1% rule.
- Cap rate 6.8% vs local median 4.5% in Greenwood — top-decile yield for the area; either an underpriced asset or a hidden risk that comps aren't pricing in. Stress-test before assuming the spread holds.
Location & tenants
- Location reads 73/100 on livability (#91 in IN) — a middle-class / working-renter tenant base. Strengths: cost of living A+, housing A+, crime A; Watch: amenities F, commute F, health & safety F.
- Greenwood Community School Corporation (suburban): math 41% / reading 52% proficiency, ranked #88 of 301 in IN (top 29%) — families likely to look elsewhere, expect single-tenant / working-renter base with shorter leases.
- Zoned schools: V O Isom Central Elem School (math 42% / reading 37%, grade F, #500 of 994 statewide, top 53%, 361 students, 70% FRL); Greenwood Middle School (math 36% / reading 52%, grade D, #87 of 330 statewide, top 27%, 948 students, 53% FRL); Greenwood Community High Sch (math 37% / reading 79%, grade C, #62 of 369 statewide, top 17%, 1,175 students, 43% FRL) — zoned schools average 56% FRL vs 38% district-wide (18 pts higher); higher-poverty schools than district average — tighter screening recommended.
- Market conditions: Rents soft (-0.1%/yr); 61 active listings in the ZIP; 24 comparable units currently listed for rent nearby; rentals at typical pace (median 22d on market — plan ~3-4 weeks tenant-placement turnaround); solid renter incomes; 1,133 units permitted in Johnson County in 2024 (0 in 5+ unit buildings).
Forward outlook
- Local home prices are declining (-3.0%/yr); year-one equity from $1k of loan paydown is wiped out by about $6k of value loss. Plan a longer hold.
- Johnson County population projected at +26% by 2050 — long-run rental-demand tailwind backs the buy-and-hold thesis.
Negotiation context
- It's been on market 33 days — a 3% lower offer ($184k) is reasonable based on typical stale-listing flexibility.
- 9 sale attempts since 26y ago; this cycle's ask has dropped $10k (5%) from the opening price — seller is motivated, your offer sets the floor, not the list.
Risks & watch-outs
- Watch-outs: built in 1952 — expect roof / HVAC / electrical / plumbing capex.
Questions for the listing agent
- It's been on market 33 days. Have you received any prior offers? Is the seller open to a 17% concession, seller financing, or rate buy-down credit?
- Built in 1952 — when were the roof, HVAC, electrical panel, plumbing, and water heater last replaced?
- Is there a deadline driving the sale (1031 exchange, divorce, estate, relocation)? That informs how much negotiation room exists.
- Schools are B-rated — typically a magnet for longer-tenancy family renters. What's the average tenant stay here, and is there a school-zone premium baked into asking?
- What's the average days-on-market for RENTAL listings here right now (not sales)? A rising rental-DOM trend means longer vacancies and softer asking-rent achievability than the comps imply.
- What's the recent tenant-quality profile in this submarket — average credit score on applications, eviction rate, late-payment / NSF rate, and stable-employment percentage? A property-management company in the area should have these aggregated.
- How much new for-sale + rental construction is in the pipeline within 1–3 miles? Heavy new supply typically softens prices + rents 12–24 months out; constrained supply supports both.
Investment metrics
- 1% rule
- 0.83% ✗
- Cap rate
- 6.77%
- Cash-on-cash
- 1.69%
- DSCR
- 1.08
- GRM
- 10.0
CMA / ARV
- ARV (median comp)
- $241,465
- List price
- $190,000
- Delta
- -21.31%
- Verdict
- UNDERPRICED
- Comps
- 20 within 1.0 mi
Show comp detail 12 sales within ~0.75 mi
| Address | Dist | Beds/Ba | Sqft | Sold | Price | $/sf | Match |
|---|---|---|---|---|---|---|---|
| 520 Woodland Pl | 0.25mi | 3/1.5 | 1,242 (-3%) | 2mo | $230,000 | $185 | 80 |
| 51 N Brewer St | 0.31mi | 3/2.0 | 1,176 (-8%) | 1mo | $235,000 | $200 | 71 |
| 608 Horton St | 0.64mi | 3/2.0 | 1,307 (+2%) | 2mo | $265,000 | $203 | 65 |
| 351 N Smart St | 0.45mi | 3/1.0 | 1,248 (-2%) | 8mo | $199,000 | $159 | 64 |
| 235 N Meridian St | 0.45mi | 3/1.0 | 1,176 (-8%) | 1mo | $155,000 | $132 | 61 |
| 300 Sunset Blvd | 0.60mi | 3/2.0 | 1,372 (+7%) | 3mo | $265,000 | $193 | 58 |
| 143 Howard Rd | 0.66mi | 3/1.5 | 1,308 (+2%) | 9mo | $254,900 | $195 | 56 |
| 290 Polk Manor Dr | 0.67mi | 3/2.0 | 1,332 (+4%) | 8mo | $251,000 | $188 | 56 |
| 374 Redbud Pl | 0.54mi | 3/2.0 | 1,386 (+8%) | 9mo | $239,900 | $173 | 54 |
| 420 Glenn Dr | 0.46mi | 2/1.0 (-1) | 1,176 (-8%) | 10mo | $235,000 | $200 | 48 |
| 103 Bentwood Dr | 0.74mi | 4/1.5 (+1) | 1,254 (-2%) | 11mo | $209,000 | $167 | 46 |
| 394 Polk Village Rd | 0.71mi | 3/2.0 | 1,133 (-12%) | 7mo | $225,000 | $199 | 42 |
Match score weights: distance 35% · size 25% · config 20% · recency 20%. Top-matched comps best support the ARV.
Projected returns pro-forma
-3.0% appreciation · 0.0% rent growth · sell at horizon
- IRR
- -16.7%
- Equity multiple
- 0.42×
- Total profit
- $-30,714
- Equity at exit
- $28,330
- IRR
- -14.5%
- Equity multiple
- 0.27×
- Total profit
- $-38,748
- Equity at exit
- $16,428
Cash invested: $53,200 (down + closing). Projections, not guarantees.
Landlord ↔ Tenant lean methodology
- Overall (STATE)
- 90 Strongly Landlord-Friendly
- State Indiana
- 90 Strongly Landlord-Friendly · R+11
- County
- — inherits STATE
- City
- — inherits STATE
ZIP-level market 46142
- Rents YoY
- -0.1%
- Active inventory
- 61
- Price-to-rent
- 10.0×
Monthly cashflow live
- Estimated rent
- $1,579 high interval (Pro) →
- Mortgage (P&I)
- −$996
- Tax from tax record
- −$97 /mo · $1,166/yr
- Insurance
- −$79
- HOA
- −$0
- Vacancy / Maint / Mgmt
- −$332
- Net cashflow
- $75
Break-even live
Sensitivity live
| Price | -10% $182 | -5% $129 | +0% $75 | +5% $21 | +10% $-33 |
|---|---|---|---|---|---|
| Rent | -10% $-50 | -5% $12 | +0% $75 | +5% $137 | +10% $200 |
| Rate | -1.0pp $170 | -0.5pp $123 | base $75 | +0.5pp $26 | +1.0pp $-25 |
UW: 25.0% down · 7.5% · 30yr · 1.5% tax · 5.0% vac · 8.0% maint · 8.0% mgmt
Financing live
Cash to close
- Down payment
- $47,500
- Closing costs
- $5,700
- Reserves months
- —
- Total cash needed
- —
Loan-product check · same deal, 3 products live
Conventional
25% down · 7.5% · 30yr
- Down + closing
- —
- Monthly P&I
- —
- Monthly cashflow
- —
- DSCR
- —
- Eligible?
- —
Personal DTI + credit; lowest rate.
DSCR
20% down · 8.5% · 30yr
- Down + closing
- —
- Monthly P&I
- —
- Monthly cashflow
- —
- DSCR
- —
- Eligible?
- —
No personal income docs; deal must DSCR.
Hard money
10% down · 12.0% · 12mo
- Down + closing
- —
- Monthly P&I
- —
- Monthly cashflow
- —
- DSCR
- —
- Eligible?
- —
Short-term bridge; refi at stabilization.
Rent comps 24 comps
| Address | Beds | Baths | Sqft | Rent | $/sqft | DOM | Units | Dist |
|---|---|---|---|---|---|---|---|---|
| 464 Carol Dr Greenwood, IN | 3.0 | 1.0 | 888 | $1,550 | $1.75 | 45d | 1 | 0.57mi |
| 614 Park Madison Dr Greenwood, IN | 2.0 | 2.0 | 1150 | $1,250 | $1.09 | 12d | 1 | 0.61mi |
| 601 Wood Dale Ter Greenwood, IN | 2.0 | 1.5 | 960 | $1,174 | $1.22 | 46d | 1 | 0.68mi |
| 628 Wooddale Ter Unit 1007 Greenwood, IN | 2.0 | 1.5 | 1013 | $1,104 | $1.09 | 45d | 1 | 0.75mi |
| 622 Wood Dale Ter Greenwood, IN | 1.0–2.0 | 1.0–1.5 | 947 | $1,104 | $1.17 | 25d | 3 | 0.76mi |
| 501 E Main St Greenwood, IN | 2.0 | 1.0 | 968 | $1,395 | $1.44 | 45d | 1 | 0.82mi |
| 902 Wallington Cir Greenwood, IN | 1.0–3.0 | 1.0–1.5 | 899 | $1,687 | $1.88 | 0d | 23 | 0.84mi |
| 88 Keran Manor Ct Greenwood, IN | 2.0 | 1.0 | 945 | $1,450 | $1.53 | 45d | 1 | 0.87mi |
| 745 Wood Dale Ter Greenwood, IN | 1.0–2.0 | 1.0–1.5 | 818 | $1,397 | $1.71 | 0d | 9 | 0.92mi |
| 1146 Freemont Ln Greenwood, IN | 3.0 | 2.5 | 1742 | $2,035 | $1.17 | 0d | 1 | 0.99mi |
| 1225 Freemont Ln Greenwood, IN | 3.0 | 2.5 | 1304 | $1,750 | $1.34 | 12d | 1 | 1.06mi |
| 968 Greenwood Trl W Greenwood, IN | 2.0 | 2.0 | 1088 | $1,475 | $1.36 | 14d | 1 | 1.10mi |
| 1284 Edgewater Dr Greenwood, IN | 3.0 | 2.5 | 1304 | $1,781 | $1.37 | 25d | 1 | 1.11mi |
| 1285 Kenwood Dr Greenwood, IN | 3.0 | 2.5 | 1470 | $1,755 | $1.19 | 25d | 1 | 1.12mi |
| 714 Connors Dr Greenwood, IN | 1.0–2.0 | 1.0 | 750 | $1,254 | $1.67 | 3d | 15 | 1.13mi |
| 49 Trails End Unit 1 Greenwood, IN | 2.0 | 1.5 | 1088 | $1,450 | $1.33 | 0d | 1 | 1.13mi |
| 757 Cypress S Greenwood, IN | 3.0 | 2.0 | 1474 | $1,900 | $1.29 | 45d | 1 | 1.17mi |
| 1318 Crescent Dr Greenwood, IN | 3.0 | 2.5 | 1747 | $1,600 | $0.92 | 25d | 1 | 1.21mi |
| 14 Greenwood Trl N Greenwood, IN | 2.0 | 1.5 | 1088 | $1,275 | $1.17 | 16d | 1 | 1.21mi |
| 1335 Millridge Dr Greenwood, IN | 3.0 | 2.0 | 1119 | $1,715 | $1.53 | 5d | 1 | 1.27mi |
| 1039 N Paz Dr Greenwood, IN | 1.0–3.0 | 1.0–2.0 | 925 | $1,434 | $1.55 | 0d | 9 | 1.28mi |
| 800 Kings Mill Rd Greenwood, IN | 2.0 | 1.0–2.0 | 701 | $1,347 | $1.92 | 0d | 50 | 1.28mi |
| 1570 Countryside Dr Greenwood, IN | 1.0–3.0 | 1.0–2.5 | 946 | $1,740 | $1.84 | 22d | 1 | 1.29mi |
| 1043 Mikes Way Greenwood, IN | 3.0 | 2.0 | 1090 | $1,650 | $1.51 | 45d | 1 | 1.49mi |
Listing history 18 events
-
2026-05-04price $190,000 1151-char remark
Show marketing remark (1151 chars)
Great opportunity to own in a growing area near downtown Greenwood where many homes are being updated and revitalized. This property offers the perfect chance to add your personal touch, create value, and make it truly your own. The home features 3 bedrooms with a functional layout that provides flexibility for a variety of living arrangements. Whether you are looking for a primary residence or an investment opportunity, this home has solid potential in an area seeing continued improvement and pride of ownership. Step outside to enjoy a fenced backyard-ideal for pets, entertaining, or simply relaxing. A 2-car detached garage provides ample room for parking, storage, or even a workshop setup. Located just minutes from downtown Greenwood, you will appreciate the easy access to local shops, restaurants, 4 parks, and everyday amenities. Convenient access to major roadways makes commuting simple while still enjoying the charm of an established neighborhood. Whether you are a buyer looking to customize your next home or an investor seeking opportunity in an improving area, this property is full of potential and ready for its next chapter.
-
2026-04-30status Active 1151-char remark
Show marketing remark (1151 chars)
Great opportunity to own in a growing area near downtown Greenwood where many homes are being updated and revitalized. This property offers the perfect chance to add your personal touch, create value, and make it truly your own. The home features 3 bedrooms with a functional layout that provides flexibility for a variety of living arrangements. Whether you are looking for a primary residence or an investment opportunity, this home has solid potential in an area seeing continued improvement and pride of ownership. Step outside to enjoy a fenced backyard-ideal for pets, entertaining, or simply relaxing. A 2-car detached garage provides ample room for parking, storage, or even a workshop setup. Located just minutes from downtown Greenwood, you will appreciate the easy access to local shops, restaurants, 4 parks, and everyday amenities. Convenient access to major roadways makes commuting simple while still enjoying the charm of an established neighborhood. Whether you are a buyer looking to customize your next home or an investor seeking opportunity in an improving area, this property is full of potential and ready for its next chapter.
-
2026-04-19status Pending 1151-char remark
Show marketing remark (1151 chars)
Great opportunity to own in a growing area near downtown Greenwood where many homes are being updated and revitalized. This property offers the perfect chance to add your personal touch, create value, and make it truly your own. The home features 3 bedrooms with a functional layout that provides flexibility for a variety of living arrangements. Whether you are looking for a primary residence or an investment opportunity, this home has solid potential in an area seeing continued improvement and pride of ownership. Step outside to enjoy a fenced backyard-ideal for pets, entertaining, or simply relaxing. A 2-car detached garage provides ample room for parking, storage, or even a workshop setup. Located just minutes from downtown Greenwood, you will appreciate the easy access to local shops, restaurants, 4 parks, and everyday amenities. Convenient access to major roadways makes commuting simple while still enjoying the charm of an established neighborhood. Whether you are a buyer looking to customize your next home or an investor seeking opportunity in an improving area, this property is full of potential and ready for its next chapter.
-
2026-04-06$200,000 Active 1151-char remark
Show marketing remark (1151 chars)
Great opportunity to own in a growing area near downtown Greenwood where many homes are being updated and revitalized. This property offers the perfect chance to add your personal touch, create value, and make it truly your own. The home features 3 bedrooms with a functional layout that provides flexibility for a variety of living arrangements. Whether you are looking for a primary residence or an investment opportunity, this home has solid potential in an area seeing continued improvement and pride of ownership. Step outside to enjoy a fenced backyard-ideal for pets, entertaining, or simply relaxing. A 2-car detached garage provides ample room for parking, storage, or even a workshop setup. Located just minutes from downtown Greenwood, you will appreciate the easy access to local shops, restaurants, 4 parks, and everyday amenities. Convenient access to major roadways makes commuting simple while still enjoying the charm of an established neighborhood. Whether you are a buyer looking to customize your next home or an investor seeking opportunity in an improving area, this property is full of potential and ready for its next chapter.
-
2006-03-15historical
-
2005-08-16$84,900
-
2005-08-10historical
-
2005-02-16$84,900
-
2004-05-12historical
-
2003-12-15$92,900
-
2002-07-13historical
-
2002-01-16$92,900
-
2001-12-31historical
-
2001-07-12historical
-
2001-06-01$94,900
-
2001-01-18$89,900
-
2000-12-31historical
-
2000-03-20$92,900
ⓘ Source: listings_history table (triggers on properties + properties_extension) + one-shot
backfill from property_details.listing_events for pre-trigger history.
Tax reassessment forecast IN · Partial reset (capped growth)
- Current annual tax
- $1,166 · $97/mo
- Projected year-2 tax
- $1,390 · $116/mo
- Expected delta
- +$225/yr (+$19/mo · 19.3%)
ⓘ Screening estimate from a state-policy table — verify with the county assessor before closing.
Climate risk First Street
- Flood 1/10 Low FEMA zone X (unshaded) · 0% chance over 30 yrs
- Wildfire 1/10 Low
- Heat 3/10 Moderate 7 d/yr ≥101°F today · 18 d/yr by 30 yrs out
- Wind 2/10 Low 100% chance of damaging wind over 30 yrs
- Air quality 2/10 Low 2 unhealthy d/yr today · 2 by 30 yrs out
Nearby sold comps map
Loading sold comps map…
Walkable amenities ~0.75 mi
Loading nearby amenities…
Taxation est. · year 1
- Rental income
- $18,949
- − Mortgage interest
- −$10,643
- − Property taxes
- −$1,166
- − Insurance
- −$950
- − Repairs & maintenance
- −$1,516
- − Management
- −$1,516
- − Depreciation
- −$5,527
- Taxable loss
- −$2,369
- Est. tax savings @ 24.0%
- +$568
- After-tax cash flow
- $1,466/yr
For passive investors: Depreciation is non-cash, so a rental often shows a tax loss while cash-flowing — sheltering income. Rental losses are passive: they offset passive income freely, and up to $25,000/yr can offset ordinary (W-2) income if you actively participate and your MAGI is under $100k (phasing out to $0 by $150k); unused losses carry forward. On sale, claimed depreciation is recaptured at up to 25%, and gains may owe capital-gains tax (a 1031 exchange can defer both). Figures are a year-1 estimate at your 24.0% rate — not tax advice; consult a CPA.
Schools (NCES district)
- District
- Greenwood Community School Corporation
- NCES district ID
- 1804110
- Math proficiency
- 41% ▼ -12.00%
- Reading proficiency
- 52% ▼ -7.00%
- Median HH income
- $48,589
- Composite
- 39.71/100
- National rank
- #3902
- State rank
- #88 of 301 in IN
Livability — Greenwood
- Score
- 73/100
- State rank
- #91
- US rank
- #5255
Category grades
Schools grade is shown separately in the Schools card above.
Census & demographics
- Census place
- Greenwood, IN
- County
- Johnson County · 154,261 people
- City population
- 96,151
- Metro
- Indianapolis-Carmel-Anderson, IN
- Population (ZIP)
- 34,348
- Household income
- $89,001
- Rent vs Own
- Severe rent burden
- 482.0
Population outlook (Johnson County) Hauer SSP2
- Today (2025)
- 170,080 people
- By 2030
- 179,983 · +5.8%
- By 2040
- 198,580 · +16.8%
- By 2050
- 214,661 · +26.2%
- By 2075
- 247,990 · +45.8%
- By 2100
- 257,821 · +51.6%
Race, ethnicity, and origin ACS 2023
- Neighborhood character
- Predominantly White (83%)
- Race & ethnicity
- White 83% Asian 6% Hispanic / Latino 5% Two or more races 4% Black 3%
- Hispanic origin (detail)
- Mexican 3% Puerto Rican 1%
- Common ancestry
- Slovak 3% Italian 2% Romanian 2%
- Foreign-born
- 6% · Canada, Philippines
- Languages at home
- 91% English-only · Spanish 3% Other Asian/Pacific 3% Other Indo-European 1%
Political lean MEDSL · Johnson
- 2024 margin
- Solid R (+34.3) · D 32.0% · R 66.3% · Other 1.7%
- 2008→2024 swing
- -8.9pp toward R · 2008: -25.5pp · 2024: -34.3pp
- All cycles
- 2024: R+34.3 2020: R+34.1 2016: R+42.5 2012: R+38.5 2008: R+25.5
Not yet ingested
- Civics
- —
Market trends
- HPI YoY
- ▼ -222.62%
- Current HPI
- 210.7473
- Rent YoY
- ▼ -0.15%
- Metro
- Indianapolis-Carmel-Anderson, IN
- State GDP YoY
- ▲ 2.90%
- F500 in state
- 18
Industry mix (Fortune 500 HQ in IN)
| Industry | F500 HQs | Revenue |
|---|---|---|
| Industrial Machinery | 2 | $37B |
|
||
| Healthcare | 1 | $177B |
|
||
| Pharmaceuticals | 1 | $45B |
|
||
| Metals / Steel | 1 | $18B |
|
||
| Agriculture | 1 | $17B |
|
||
| Packaging | 1 | $12B |
|
||
Price history
+104.5% since first listed18 events — show timeline
- 2026-05-04 Price Changed $190,000 MIBOR as Distributed by MLS Grid
- 2026-04-30 Relisted — MIBOR as Distributed by MLS Grid
- 2026-04-19 Pending — MIBOR as Distributed by MLS Grid
- 2026-04-06 Listed $200,000 MIBOR as Distributed by MLS Grid
- 2006-03-15 Listing Removed — MIBOR as Distributed by MLS Grid
- 2005-08-16 Listed $84,900 MIBOR as Distributed by MLS Grid
- 2005-08-10 Listing Removed — MIBOR as Distributed by MLS Grid
- 2005-02-16 Listed $84,900 MIBOR as Distributed by MLS Grid
- 2004-05-12 Listing Removed — MIBOR as Distributed by MLS Grid
- 2003-12-15 Listed $92,900 MIBOR as Distributed by MLS Grid
- 2002-07-13 Listing Removed — MIBOR as Distributed by MLS Grid
- 2002-01-16 Listed $92,900 MIBOR as Distributed by MLS Grid
- 2001-12-31 Listing Removed — MIBOR as Distributed by MLS Grid
- 2001-07-12 Listing Removed — MIBOR as Distributed by MLS Grid
- 2001-06-01 Listed $94,900 MIBOR as Distributed by MLS Grid
- 2001-01-18 Listed $89,900 MIBOR as Distributed by MLS Grid
- 2000-12-31 Listing Removed — MIBOR as Distributed by MLS Grid
- 2000-03-20 Listed $92,900 MIBOR as Distributed by MLS Grid
Property tax history
-1.9%/yrLatest (2024): $1,166 · +26.3% YoY. Source: county tax records.
Cash-flow waterfall
monthlySold comps — $/sqft
last 12 mo · ≤1 miLoading sold comps…