1246 Pine St · Colorado City, TX
Flood risk 1/10 · Minimal
- FEMA flood zone
- X
- Chance of flooding over 30 yrs
- 0.0%
- Est. flood insurance / yr
- $507 – $1,088
Fire risk 6/10 · Moderate
- Est. fire insurance / yr
- $1,222 – $2,270
Heat risk 7/10 · Major
- Hot days now (above 104°F)
- 7 days/yr
- Hot days in 30 yrs
- 22 days/yr
Wind risk 3/10 · Minor
- Chance of severe wind over 30 yrs
- 6.0%
Air-quality risk 1/10 · Minimal
- Unhealthy air days now
- 0 days/yr
- Unhealthy air days in 30 yrs
- 0 days/yr
Risk factors via First Street. Map © Google.
Why this score? — see what drove the B grade
The composite is a weighted blend of 9 inputs, each scored 0–100. Each bar is that input's sub-score; the figure is the points it added to the 100-point composite (weight × sub-score).
- Cash flow +30.0/30.0
- DSCR +10.0/10.0
- 1% rule +9.1/10.0
- Appreciation +7.2/10.0
- Livability +3.5/5.0
- Schools +3.0/10.0
- ARV discount +2.8/15.0
- Rent growth +2.5/5.0
- Condition / age +2.5/5.0
$67,000
🖨 Deal sheet (PDF) 📄 Offer letter ✓ Due diligence
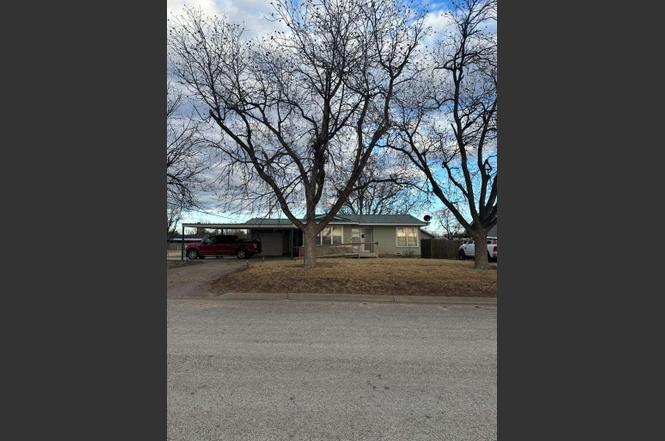
Listing remarks
Well-kept 2 bed one bath home with water well, carport, garage, built in storage room, metal roof, five mature pecan trees, peach trees, ceiling fans, corner lot, large, covered patio, large front and back manicured yard with 6-foot privacy fence. Washer/Dryer and refrigerator convey. Don't miss out on this home.
Key facts
- Metal roof
- Water well
- Carport
Tags
Neighborhood map
What this means for you Summary
Snapshot
- This is a 2-bed/1.0-bath single-family listed at $67k.
Deal economics
- At list price, monthly cash flow is $254 ($3k/yr) — positive.
- The deal already cash-flows at list — no discount required.
- Meets the 1% rule at list price ($944 rent vs $67k).
- Recommended offer: $63k (6.0% below list) — sets the bar for market timing.
Location & tenants
- Location reads 70/100 on livability (#355 in TX) — a middle-class / working-renter tenant base. Strengths: cost of living A+, housing A+, crime B+; Watch: health & safety C-, amenities F, commute F.
- Colorado ISD (town): math 37% / reading 34% proficiency, ranked #508 of 826 in TX (top 62%) — families likely to look elsewhere, expect single-tenant / working-renter base with shorter leases.
- Zoned schools: Colorado El And Middle (math 35% / reading 34%, grade F, #1,995 of 4,322 statewide, top 50%, 708 students, 63% FRL); Colorado H S (math 44% / reading 44%, grade F, #652 of 1,632 statewide, top 43%, 227 students, 65% FRL).
- Market conditions: 86 active listings in the ZIP.
Forward outlook
- In year one you build about $3k of equity ($463 loan paydown + $3k appreciation (4.4% local appreciation)).
- Mitchell County population projected at +8% by 2050 — modest demand growth; plan on rents tracking national, not racing it.
- At projected returns (4.4% appreciation + 3.0% rent growth), your $19k cash investment doubles in ~3 years — after that, you're playing with house money.
- By year 10, paydown + projected appreciation supports a ~$33k cash-out refi (75% LTV) — recoverable capital for the next deal without selling this one.
Negotiation context
- It's been on market 68 days — a 6% lower offer ($63k) is reasonable based on typical stale-listing flexibility.
Risks & watch-outs
- Watch-outs: built in 1954 — expect roof / HVAC / electrical / plumbing capex.
- Climate carrying-cost: major wildfire risk; extreme-heat days projected 7→22/yr by 2055 (HVAC capex compounding) — expect insurance premiums to compound above CPI over the hold.
Questions for the listing agent
- It's been on market 68 days. Have you received any prior offers? Is the seller open to a 6% concession, seller financing, or rate buy-down credit?
- Built in 1954 — when were the roof, HVAC, electrical panel, plumbing, and water heater last replaced?
- Why hasn't it sold? Are there any deal-killer items the seller is aware of (foundation, flood, title, zoning, code violations)?
- Is there a deadline driving the sale (1031 exchange, divorce, estate, relocation)? That informs how much negotiation room exists.
- What's the average days-on-market for RENTAL listings here right now (not sales)? A rising rental-DOM trend means longer vacancies and softer asking-rent achievability than the comps imply.
- What's the recent tenant-quality profile in this submarket — average credit score on applications, eviction rate, late-payment / NSF rate, and stable-employment percentage? A property-management company in the area should have these aggregated.
- How much new for-sale + rental construction is in the pipeline within 1–3 miles? Heavy new supply typically softens prices + rents 12–24 months out; constrained supply supports both.
Investment metrics
- 1% rule
- 1.41% ✓
- Cap rate
- 10.85%
- Cash-on-cash
- 16.27%
- DSCR
- 1.72
- GRM
- 5.9
CMA / ARV
- ARV (on-the-fly)
- $60,710
- Comps found
- 2
Show comp detail 2 sales within ~0.75 mi
| Address | Dist | Beds/Ba | Sqft | Sold | Price | $/sf | Match |
|---|---|---|---|---|---|---|---|
| 1120 Locust St | 0.38mi | 2/1.0 | 840 (-10%) | 15mo | $55,000 | $65 | 53 |
| 603 Pine St | 0.48mi | 2/1.0 | 1,036 (+11%) | 14mo | $36,550 | $35 | 48 |
Match score weights: distance 35% · size 25% · config 20% · recency 20%. Top-matched comps best support the ARV.
Projected returns pro-forma
4.37% appreciation · 3.0% rent growth · sell at horizon
- IRR
- 25.7%
- Equity multiple
- 2.56×
- Total profit
- $29,295
- Equity at exit
- $35,436
- IRR
- 25.3%
- Equity multiple
- 5.04×
- Total profit
- $75,837
- Equity at exit
- $59,160
Cash invested: $18,760 (down + closing). Projections, not guarantees.
Landlord ↔ Tenant lean methodology
- Overall (STATE)
- 87 Strongly Landlord-Friendly
- State Texas
- 87 Strongly Landlord-Friendly · R+5
- County
- — inherits STATE
- City
- — inherits STATE
ZIP-level market 79512
- Home prices YoY
- 4.6%
- Active inventory
- 86
- Price-to-rent
- 5.9×
Monthly cashflow live
- Estimated rent
- $944 medium interval (Pro) →
- Mortgage (P&I)
- −$351
- Tax from tax record
- −$112 /mo · $1,348/yr
- Insurance
- −$28
- HOA
- −$0
- Vacancy / Maint / Mgmt
- −$198
- Net cashflow
- $254
Break-even live
Sensitivity live
| Price | -10% $292 | -5% $273 | +0% $254 | +5% $235 | +10% $216 |
|---|---|---|---|---|---|
| Rent | -10% $180 | -5% $217 | +0% $254 | +5% $292 | +10% $329 |
| Rate | -1.0pp $288 | -0.5pp $271 | base $254 | +0.5pp $237 | +1.0pp $219 |
UW: 25.0% down · 7.5% · 30yr · 1.5% tax · 5.0% vac · 8.0% maint · 8.0% mgmt
Financing live
Cash to close
- Down payment
- $16,750
- Closing costs
- $2,010
- Reserves months
- —
- Total cash needed
- —
Loan-product check · same deal, 3 products live
Conventional
25% down · 7.5% · 30yr
- Down + closing
- —
- Monthly P&I
- —
- Monthly cashflow
- —
- DSCR
- —
- Eligible?
- —
Personal DTI + credit; lowest rate.
DSCR
20% down · 8.5% · 30yr
- Down + closing
- —
- Monthly P&I
- —
- Monthly cashflow
- —
- DSCR
- —
- Eligible?
- —
No personal income docs; deal must DSCR.
Hard money
10% down · 12.0% · 12mo
- Down + closing
- —
- Monthly P&I
- —
- Monthly cashflow
- —
- DSCR
- —
- Eligible?
- —
Short-term bridge; refi at stabilization.
Listing history 4 events
-
2026-04-27status Pending
-
2026-03-17price $67,000
-
2026-03-06price $77,000
-
2026-02-18$82,000 Active
ⓘ Source: listings_history table (triggers on properties + properties_extension) + one-shot
backfill from property_details.listing_events for pre-trigger history.
Tax reassessment forecast TX · Resets to sale price
- Current annual tax
- $1,348 · $112/mo
- Projected year-2 tax
- $1,348 · $112/mo
- Expected delta
- $0/yr ($0/mo · 0.0%)
ⓘ Screening estimate from a state-policy table — verify with the county assessor before closing.
Climate risk First Street
- Flood 1/10 Low FEMA zone X · 0% chance over 30 yrs
- Wildfire 6/10 Major
- Heat 7/10 Severe 7 d/yr ≥104°F today · 22 d/yr by 30 yrs out
- Wind 3/10 Moderate 6% chance of damaging wind over 30 yrs
- Air quality 1/10 Low 0 unhealthy d/yr today · 0 by 30 yrs out
Nearby sold comps map
Loading sold comps map…
Walkable amenities ~0.75 mi
Loading nearby amenities…
Taxation est. · year 1
- Rental income
- $11,332
- − Mortgage interest
- −$3,753
- − Property taxes
- −$1,348
- − Insurance
- −$335
- − Repairs & maintenance
- −$907
- − Management
- −$907
- − Depreciation
- −$1,949
- Taxable income
- $2,133
- Est. tax owed @ 24.0%
- −$512
- After-tax cash flow
- $2,540/yr
For passive investors: Depreciation is non-cash, so a rental often shows a tax loss while cash-flowing — sheltering income. Rental losses are passive: they offset passive income freely, and up to $25,000/yr can offset ordinary (W-2) income if you actively participate and your MAGI is under $100k (phasing out to $0 by $150k); unused losses carry forward. On sale, claimed depreciation is recaptured at up to 25%, and gains may owe capital-gains tax (a 1031 exchange can defer both). Figures are a year-1 estimate at your 24.0% rate — not tax advice; consult a CPA.
Schools (NCES district)
- District
- Colorado ISD
- NCES district ID
- 4814640
- Math proficiency
- 37% ▼ -8.00%
- Reading proficiency
- 34% ▼ -4.00%
- Median HH income
- $46,054
- Composite
- 30.41/100
- National rank
- #6249
- State rank
- #508 of 826 in TX
Livability — Colorado City
- Score
- 70/100
- State rank
- #355
- US rank
- #7722
Category grades
Schools grade is shown separately in the Schools card above.
Census & demographics
- Census place
- Colorado City, TX
- City population
- 7,672
- Population (ZIP)
- 7,672
Population outlook (Mitchell County) Hauer SSP2
- Today (2025)
- 8,476 people
- By 2030
- 8,723 · +2.9%
- By 2040
- 9,046 · +6.7%
- By 2050
- 9,200 · +8.5%
- By 2075
- 8,936 · +5.4%
- By 2100
- 7,978 · -5.9%
Race, ethnicity, and origin ACS 2023
- Neighborhood character
- Diverse neighborhood (Simpson 0.64)
- Race & ethnicity
- White 47% Hispanic / Latino 37% Two or more races 20% Black 6% Asian 2%
- Hispanic origin (detail)
- Mexican 34%
- Common ancestry
- Serbian 2% Lithuanian 1% Slovak 1%
- Foreign-born
- 3% · Canada
- Languages at home
- 80% English-only · Spanish 18% Tagalog/Filipino 1%
Political lean MEDSL · Mitchell
- 2024 margin
- Solid R (+71.3) · D 14.0% · R 85.3%
- 2008→2024 swing
- -20.8pp toward R · 2008: -50.5pp · 2024: -71.3pp
- All cycles
- 2024: R+71.3 2020: R+68.8 2016: R+65.2 2012: R+52.7 2008: R+50.5
Not yet ingested
- Civics
- —
Market trends
- HPI YoY
- ▲ 4.37%
- Current HPI
- 99.8822
- Rent YoY
- —
- Metro
- —
- State GDP YoY
- ▲ 3.95%
- F500 in state
- 110
Industry mix (Fortune 500 HQ in TX)
| Industry | F500 HQs | Revenue |
|---|---|---|
| Energy | 16 | $1,198B |
|
||
| Technology | 5 | $198B |
|
||
| Engineering / Construction | 4 | $72B |
|
||
| Energy Services | 3 | $60B |
|
||
| Utilities | 3 | $41B |
|
||
| Healthcare | 2 | $330B |
|
||
Price history
-18.3% since first listed4 events — show timeline
- 2026-04-27 Pending — PBBOR
- 2026-03-17 Price Changed $67,000 PBBOR
- 2026-03-06 Price Changed $77,000 PBBOR
- 2026-02-18 Listed $82,000 PBBOR
Property tax history
+1.3%/yrLatest (2025): $1,348 · -11.3% YoY. Source: county tax records.
Cash-flow waterfall
monthlySold comps — $/sqft
last 12 mo · ≤1 miLoading sold comps…