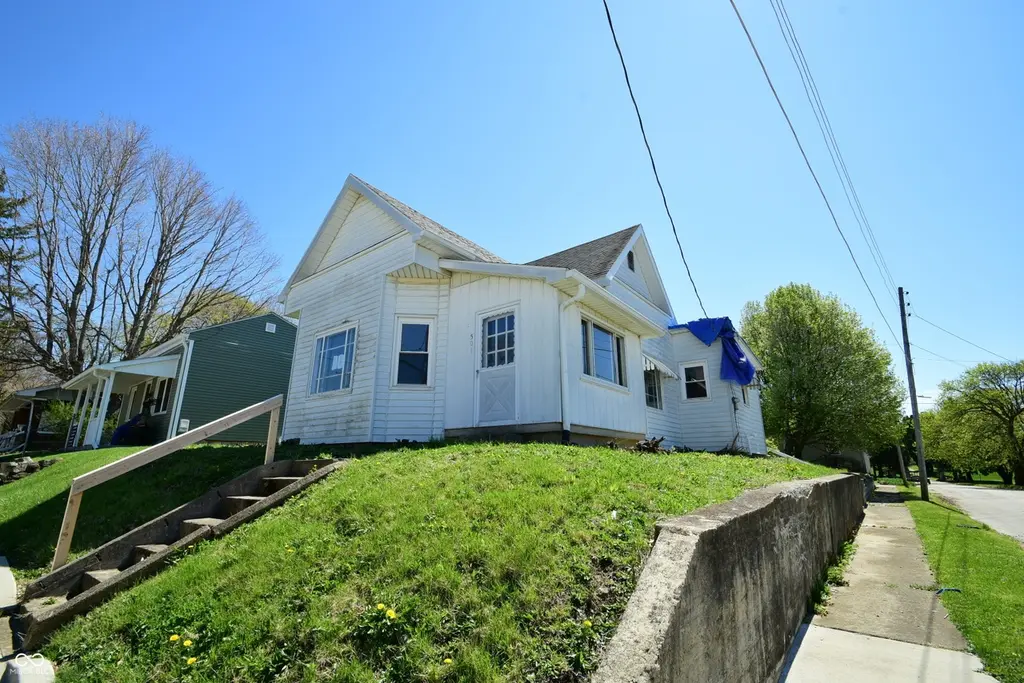
501 E Main St · Lewisville, IN
Flood risk 1/10 · Minimal
- FEMA flood zone
- X (unshaded)
- Chance of flooding over 30 yrs
- 0.0%
- Est. flood insurance / yr
- $473 – $860
Fire risk 1/10 · Minimal
- Est. fire insurance / yr
- $717 – $1,331
Heat risk 3/10 · Minor
- Hot days now (above 100°F)
- 7 days/yr
- Hot days in 30 yrs
- 18 days/yr
Wind risk 2/10 · Minimal
- Chance of severe wind over 30 yrs
- 1.0%
Air-quality risk 3/10 · Minor
- Unhealthy air days now
- 2 days/yr
- Unhealthy air days in 30 yrs
- 4 days/yr
Risk factors via First Street. Map © Google.
Why this score? — see what drove the B grade
The composite is a weighted blend of 9 inputs, each scored 0–100. Each bar is that input's sub-score; the figure is the points it added to the 100-point composite (weight × sub-score).
- Cash flow +30.0/30.0
- 1% rule +10.0/10.0
- DSCR +10.0/10.0
- ARV discount +7.5/15.0
- Appreciation +6.8/10.0
- Livability +3.1/5.0
- Rent growth +2.5/5.0
- Condition / age +2.5/5.0
- Schools +2.3/10.0
$59,900
🖨 Deal sheet 📄 Offer letter ✓ Due diligence
Listing remarks MLS
Value opportunity on Old National Road with strong upside potential! Situated on a raised lot, this home offers appealing curb presence and a setting that stands out from the street. Inside, you'll find generously sized rooms and a functional split-bedroom floor plan. The layout includes an eat-in kitchen, separate dining room, and a comfortable living area, along with both front and rear enclosed porches that add flexible space. Additional features include a large barn providing ample storage or workshop potential. This property will require updates and repairs, but with the right vision, it presents an excellent opportunity for investors or buyers looking to build equity. Bring your ideas and make it your own!
Key facts
- 7,492 sq ft lot
- Garage
- Built 1900
Neighborhood map
What this means for you Summary
Snapshot
- This is a 3-bed/1.0-bath single-family listed at $60k.
Deal economics
- At list price, monthly cash flow is $959 ($12k/yr) — positive.
- The deal already cash-flows at list — no discount required.
- Meets the 1% rule at list price ($2k rent vs $60k).
- Recommended offer: $58k (3.0% below list) — sets the bar for market timing.
Location & tenants
- Location reads 62/100 on livability (#464 in IN) — a middle-class / working-renter tenant base. Strengths: cost of living A+, housing A+; Watch: health & safety C-, crime D, schools F.
- South Henry School Corporation (rural): math 25% / reading 27% proficiency, ranked #258 of 301 in IN (top 86%) — low school quality limits family demand, transient renter base, plan for 1-2y turnover.
- Market conditions: 10 active listings in the ZIP; 47 units permitted in Henry County in 2024 (0 in 5+ unit buildings).
Forward outlook
- In year one you build about $3k of equity ($414 loan paydown + $2k appreciation (3.6% local appreciation)).
- Henry County population projected at -12% by 2050 — secular population decline; favor cash flow + early exit over multi-decade hold.
- At projected returns (3.6% appreciation + 3.0% rent growth), your $17k cash investment doubles in ~2 years — after that, you're playing with house money.
Negotiation context
- It's been on market 41 days — a 3% lower offer ($58k) is reasonable based on typical stale-listing flexibility.
- 5 sale attempts since 6y ago with the ask held roughly flat each time — persistent listings suggest the price (not the market) is what's stuck; bring a comps-based counter.
Risks & watch-outs
- Watch-outs: built in 1900 — expect roof / HVAC / electrical / plumbing capex.
Questions for the listing agent
- It's been on market 41 days. Have you received any prior offers? Is the seller open to a 3% concession, seller financing, or rate buy-down credit?
- Built in 1900 — when were the roof, HVAC, electrical panel, plumbing, and water heater last replaced?
- Is there a deadline driving the sale (1031 exchange, divorce, estate, relocation)? That informs how much negotiation room exists.
- Schools are F-rated, which usually means shorter tenancies and higher turnover. Who's the typical renter profile here, and what's been the actual vacancy rate?
- Crime grade is D in this area — have there been break-ins, vandalism, or insurance claims at this property in the last 3 years? What carrier currently insures it and at what premium?
- What's the average days-on-market for RENTAL listings here right now (not sales)? A rising rental-DOM trend means longer vacancies and softer asking-rent achievability than the comps imply.
- What's the recent tenant-quality profile in this submarket — average credit score on applications, eviction rate, late-payment / NSF rate, and stable-employment percentage? A property-management company in the area should have these aggregated.
- How much new for-sale + rental construction is in the pipeline within 1–3 miles? Heavy new supply typically softens prices + rents 12–24 months out; constrained supply supports both.
Investment metrics
- 1% rule
- 2.83% ✓
- Cap rate
- 25.51%
- Cash-on-cash
- 68.65%
- DSCR
- 4.05
- GRM
- 2.9
CMA / ARV
- ARV (median comp)
- $168,334
- List price
- $59,900
- Delta
- -64.42%
- Verdict
- UNDERPRICED
- Comps
- 12 within 1.0 mi
Projected returns pro-forma
3.59% appreciation · 3.0% rent growth · sell at horizon
- IRR
- 73.8%
- Equity multiple
- 5.19×
- Total profit
- $70,212
- Equity at exit
- $28,937
- IRR
- 72.9%
- Equity multiple
- 10.66×
- Total profit
- $162,051
- Equity at exit
- $46,219
Cash invested: $16,772 (down + closing). Projections, not guarantees.
Landlord ↔ Tenant lean methodology
- Overall (STATE)
- 90 Strongly Landlord-Friendly
- State Indiana
- 90 Strongly Landlord-Friendly · R+11
- County
- — inherits STATE
- City
- — inherits STATE
ZIP-level market 47352
- Home prices YoY
- 1.6%
- Active inventory
- 10
- Price-to-rent
- 2.9×
Monthly cashflow live
- Estimated rent
- $1,698 medium interval (Pro) →
- Mortgage (P&I)
- −$314
- Tax from tax record
- −$43 /mo · $512/yr
- Insurance
- −$25
- HOA
- −$0
- Vacancy / Maint / Mgmt
- −$357
- Net cashflow
- $959
Break-even live
UW: 25.0% down · 7.5% · 30yr · 1.5% tax · 5.0% vac · 8.0% maint · 8.0% mgmt
Financing live
Cash to close
- Down payment
- $14,975
- Closing costs
- $1,797
- Reserves months
- —
- Total cash needed
- —
Loan-product check · same deal, 3 products live
Conventional
25% down · 7.5% · 30yr
- Down + closing
- —
- Monthly P&I
- —
- Monthly cashflow
- —
- DSCR
- —
- Eligible?
- —
Personal DTI + credit; lowest rate.
DSCR
20% down · 8.5% · 30yr
- Down + closing
- —
- Monthly P&I
- —
- Monthly cashflow
- —
- DSCR
- —
- Eligible?
- —
No personal income docs; deal must DSCR.
Hard money
10% down · 12.0% · 12mo
- Down + closing
- —
- Monthly P&I
- —
- Monthly cashflow
- —
- DSCR
- —
- Eligible?
- —
Short-term bridge; refi at stabilization.
Listing history 15 events
-
2026-05-18status Pending 724-char remark
Show marketing remark (724 chars)
Value opportunity on Old National Road with strong upside potential! Situated on a raised lot, this home offers appealing curb presence and a setting that stands out from the street. Inside, you'll find generously sized rooms and a functional split-bedroom floor plan. The layout includes an eat-in kitchen, separate dining room, and a comfortable living area, along with both front and rear enclosed porches that add flexible space. Additional features include a large barn providing ample storage or workshop potential. This property will require updates and repairs, but with the right vision, it presents an excellent opportunity for investors or buyers looking to build equity. Bring your ideas and make it your own!
-
2026-04-06$59,900 Active 724-char remark
Show marketing remark (724 chars)
Value opportunity on Old National Road with strong upside potential! Situated on a raised lot, this home offers appealing curb presence and a setting that stands out from the street. Inside, you'll find generously sized rooms and a functional split-bedroom floor plan. The layout includes an eat-in kitchen, separate dining room, and a comfortable living area, along with both front and rear enclosed porches that add flexible space. Additional features include a large barn providing ample storage or workshop potential. This property will require updates and repairs, but with the right vision, it presents an excellent opportunity for investors or buyers looking to build equity. Bring your ideas and make it your own!
-
2026-04-06historical
Show marketing remark (724 chars)
Value opportunity on Old National Road with strong upside potential! Situated on a raised lot, this home offers appealing curb presence and a setting that stands out from the street. Inside, you'll find generously sized rooms and a functional split-bedroom floor plan. The layout includes an eat-in kitchen, separate dining room, and a comfortable living area, along with both front and rear enclosed porches that add flexible space. Additional features include a large barn providing ample storage or workshop potential. This property will require updates and repairs, but with the right vision, it presents an excellent opportunity for investors or buyers looking to build equity. Bring your ideas and make it your own!
-
2026-03-25price $59,900
-
2026-02-24price $74,900
-
2026-01-28price $89,900
-
2025-12-29price $99,900
-
2025-11-26price $109,900
-
2025-10-24$119,900 Active
-
2021-03-02soldstatus $58,400
-
2021-03-02soldstatus $58,400
-
2021-03-02soldstatus $58,400
-
2020-12-09$54,900
-
2020-11-30$54,900
-
2020-11-30$54,900
ⓘ Source: listings_history table (triggers on properties + properties_extension) + one-shot
backfill from property_details.listing_events for pre-trigger history.
Tax reassessment forecast IN · Partial reset (capped growth)
- Current annual tax
- $512 · $43/mo
- Projected year-2 tax
- $512 · $43/mo
- Expected delta
- $0/yr ($0/mo · 0.0%)
ⓘ Screening estimate from a state-policy table — verify with the county assessor before closing.
Climate risk First Street
- Flood 1/10 Low FEMA zone X (unshaded) · 0% chance over 30 yrs
- Wildfire 1/10 Low
- Heat 3/10 Moderate 7 d/yr ≥100°F today · 18 d/yr by 30 yrs out
- Wind 2/10 Low 100% chance of damaging wind over 30 yrs
- Air quality 3/10 Moderate 2 unhealthy d/yr today · 4 by 30 yrs out
Nearby sold comps map
Loading sold comps map…
Walkable amenities ~0.75 mi
Loading nearby amenities…
Taxation est. · year 1
- Rental income
- $20,372
- − Mortgage interest
- −$3,355
- − Property taxes
- −$512
- − Insurance
- −$300
- − Repairs & maintenance
- −$1,630
- − Management
- −$1,630
- − Depreciation
- −$1,743
- Taxable income
- $11,204
- Est. tax owed @ 24.0%
- −$2,689
- After-tax cash flow
- $8,824/yr
For passive investors: Depreciation is non-cash, so a rental often shows a tax loss while cash-flowing — sheltering income. Rental losses are passive: they offset passive income freely, and up to $25,000/yr can offset ordinary (W-2) income if you actively participate and your MAGI is under $100k (phasing out to $0 by $150k); unused losses carry forward. On sale, claimed depreciation is recaptured at up to 25%, and gains may owe capital-gains tax (a 1031 exchange can defer both). Figures are a year-1 estimate at your 24.0% rate — not tax advice; consult a CPA.
Schools (NCES district)
- District
- South Henry School Corporation
- NCES district ID
- 1810380
- Math proficiency
- 25% ▼ -15.00%
- Reading proficiency
- 27% ▼ -14.00%
- Median HH income
- $47,772
- Composite
- 22.67/100
- National rank
- #8045
- State rank
- #258 of 301 in IN
Livability — Lewisville
- Score
- 62/100
- State rank
- #464
- US rank
- #16379
Category grades
Schools grade is shown separately in the Schools card above.
Census & demographics
- Census place
- Lewisville, IN
- Population (ZIP)
- 823
Population outlook (Henry County) Hauer SSP2
- Today (2025)
- 48,028 people
- By 2030
- 47,125 · -1.9%
- By 2040
- 44,820 · -6.7%
- By 2050
- 42,207 · -12.1%
- By 2075
- 35,814 · -25.4%
- By 2100
- 26,779 · -44.2%
Race, ethnicity, and origin ACS 2023
- Neighborhood character
- Predominantly White (98%)
- Race & ethnicity
- White 98% Two or more races 1% Hispanic / Latino 1%
- Common ancestry
- Serbian 2% Portuguese 1% Slovak 1%
- Foreign-born
- 1% · Canada
- Languages at home
- 98% English-only · Spanish 2%
Political lean MEDSL · Henry
- 2024 margin
- Solid R (+47.7) · D 25.3% · R 73.0% · Other 1.7%
- 2008→2024 swing
- -43.8pp toward R · 2008: -3.9pp · 2024: -47.7pp
- All cycles
- 2024: R+47.7 2020: R+45.2 2016: R+43.7 2012: R+17.0 2008: R+3.9
Not yet ingested
- Civics
- —
Market trends
- HPI YoY
- ▲ 3.59%
- Current HPI
- 230.5852
- Rent YoY
- —
- Metro
- —
- State GDP YoY
- ▲ 2.90%
- F500 in state
- 18
Industry mix (Fortune 500 HQ in IN)
| Industry | F500 HQs | Revenue |
|---|---|---|
| Industrial Machinery | 2 | $37B |
|
||
| Healthcare | 1 | $177B |
|
||
| Pharmaceuticals | 1 | $45B |
|
||
| Metals / Steel | 1 | $18B |
|
||
| Agriculture | 1 | $17B |
|
||
| Packaging | 1 | $12B |
|
||
Price history
+9.1% since first listed15 events — show timeline
- 2026-05-18 Pending — MIBOR as Distributed by MLS Grid
- 2026-04-06 Listing Removed — MIBOR as Distributed by MLS Grid
- 2026-04-06 Listed $59,900 MIBOR as Distributed by MLS Grid
- 2026-03-25 Price Changed $59,900 MIBOR as Distributed by MLS Grid
- 2026-02-24 Price Changed $74,900 MIBOR as Distributed by MLS Grid
- 2026-01-28 Price Changed $89,900 MIBOR as Distributed by MLS Grid
- 2025-12-29 Price Changed $99,900 MIBOR as Distributed by MLS Grid
- 2025-11-26 Price Changed $109,900 MIBOR as Distributed by MLS Grid
- 2025-10-24 Listed $119,900 MIBOR as Distributed by MLS Grid
- 2021-03-02 Sold (MLS) $58,400 IRMLS
- 2021-03-02 Sold (MLS) $58,400 RRELMS
- 2021-03-02 Sold (MLS) $58,400 MIBOR as Distributed by MLS Grid
- 2020-12-09 Listed $54,900 IRMLS
- 2020-11-30 Listed $54,900 RRELMS
- 2020-11-30 Listed $54,900 MIBOR as Distributed by MLS Grid
Property tax history
+30.7%/yrLatest (2024): $512 · +22.7% YoY. Source: county tax records.
Cash-flow waterfall
monthlySold comps — $/sqft
last 12 mo · ≤1 miLoading sold comps…