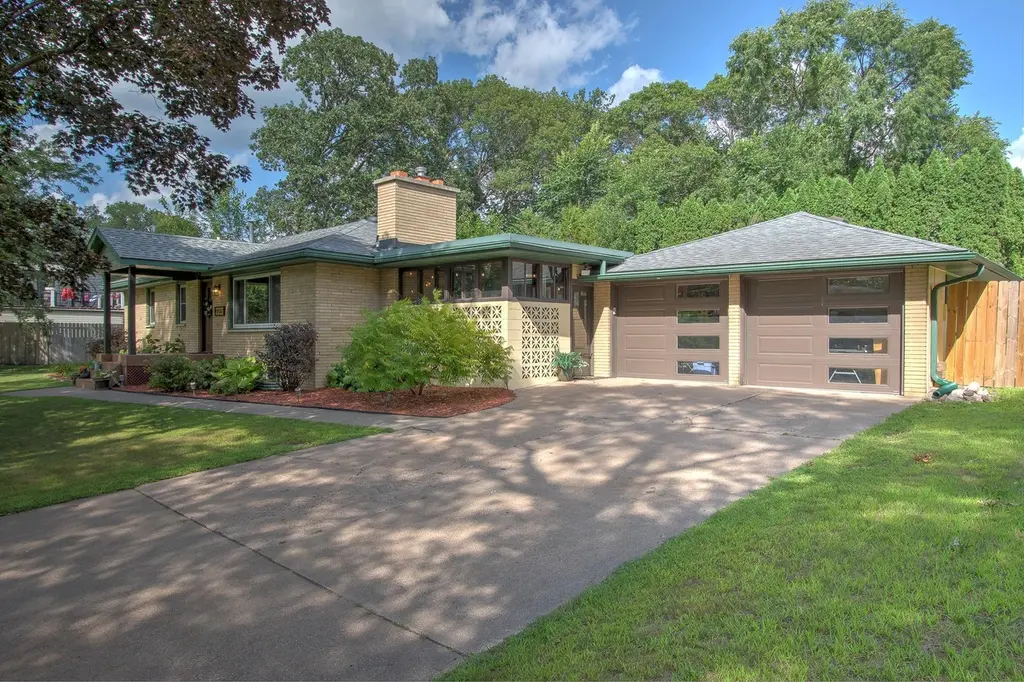
2850 Holly St S · Cambridge, MN
Flood risk 1/10 · Minimal
- FEMA flood zone
- X (unshaded)
- Chance of flooding over 30 yrs
- 0.0%
- Est. flood insurance / yr
- $473 – $860
Fire risk 2/10 · Minimal
- Est. fire insurance / yr
- $888 – $1,650
Heat risk 2/10 · Minimal
- Hot days now (above 97°F)
- 7 days/yr
- Hot days in 30 yrs
- 13 days/yr
Wind risk 1/10 · Minimal
- Chance of severe wind over 30 yrs
- —
Air-quality risk 2/10 · Minimal
- Unhealthy air days now
- 1 days/yr
- Unhealthy air days in 30 yrs
- 1 days/yr
Risk factors via First Street. Map © Google.
Why this score? — see what drove the F grade
The composite is a weighted blend of 9 inputs, each scored 0–100. Each bar is that input's sub-score; the figure is the points it added to the 100-point composite (weight × sub-score).
- ARV discount +7.5/15.0
- Cash flow +4.5/30.0
- Schools +4.5/10.0
- Livability +3.8/5.0
- Rent growth +2.5/5.0
- Condition / age +2.5/5.0
- 1% rule +0.2/10.0
- DSCR +0.0/10.0
- Appreciation +0.0/10.0
$336,000
🖨 Deal sheet (PDF) 📄 Offer letter ✓ Due diligence
Listing remarks MLS
3 BR rambler, nice large newer kitchen, hardwood floors, full basement and fenced back yard. Seller is offering a $3,300 credit to Buyer toward Buyers closing costs.
Key facts
- 0.3 acre lot
- 2 garage spots
- Built 1963
Property features AI
Exterior
- Parking: Attached insulated garage with opener; Concrete garage; 2-car garage (garage dimensions 34x21)
- Utilities: City water connected; City sewer connected; Natural gas; Electric with circuit breakers
- Home design: Residential property; One-level main living (one story); Main-floor primary bedroom
- Construction: Block foundation; Asphalt pitched roof; Foundation dimensions: 43x27 + 17x11; Workshop structure
- Exterior features: Composite decking; Covered front porch; Screened porch; Porch; Patio; Stone exterior accents; Chain link and wood partial fencing; Workshop and storage shed on property; Medium tree coverage; City street frontage with curbs and paved streets
Interior
- Kitchen: Range; Refrigerator; Dishwasher; Microwave; Stainless steel appliances; Water osmosis system; Eat-in kitchen / kitchen-dining area
- Bedrooms: 5 bedrooms total; Main level: Primary bedroom and multiple bedrooms; Lower level: Two bedrooms (including Bedroom 4 and Bedroom 5)
- Flooring: Hardwood floors; Tile floors
- Bathrooms: 2 full bathrooms; Full bath on main floor; Full basement bath
- Heating & cooling: Baseboard heating; Ductless mini-split heating and cooling; Fireplace(s) and wood stove; Zoned heating/cooling
- Interior features: Ceiling fans; Hardwood floors; Natural woodwork; Paneled doors; Tile floors; Kitchen window; Main floor primary bedroom; 3 bedrooms on one level
- Laundry & utility: Washer and dryer included; Lower level laundry room; Gas water heater
Neighborhood map
What this means for you Summary
Snapshot
- This is a 3-bed/1.0-bath single-family listed at $336k.
Deal economics
- At list price, monthly cash flow is $-872 ($-10k/yr) — negative.
- To cash-flow at today's rent, offer at most $182k (45.9% below list).
- To meet the 1% rule (rent ≥ 1% of price), the offer needs to be $176k (47.5% below list).
- Recommended offer: $176k (47.5% below list) — sets the bar for 1% rule.
Location & tenants
- Location reads 75/100 on livability (#180 in MN, #3,872 nationally) — a middle-class / working-renter tenant base. Strengths: housing A+, health & safety A+, crime A; Watch: amenities F, commute F.
- Cambridge-Isanti Public School District (town): math 47% / reading 55% proficiency, ranked #96 of 301 in MN (top 32%) — acceptable for families but not a draw, mixed tenant base, ~2y average lease.
- Zoned schools: Cambridge Intermediate School (math 62% / reading 55%, grade B-, #251 of 857 statewide, top 30%, 503 students, 40% FRL); Cambridge Middle School (math 43% / reading 62%, grade C+, #59 of 258 statewide, top 24%, 605 students, 36% FRL); Cambridge-Isanti High School (math 37% / reading 60%, grade D, #156 of 471 statewide, top 33%, 1,605 students, 36% FRL).
- Market conditions: 193 active listings in the ZIP; 2 comparable units currently listed for rent nearby; 191 units permitted in Isanti County in 2024 (28 in 5+ unit buildings).
Forward outlook
- Local home prices are declining (-3.0%/yr); year-one equity from $2k of loan paydown is wiped out by about $10k of value loss. Plan a longer hold.
- Isanti County population projected to shrink 9% by 2050 — rents likely to lag national; underwrite the cash flow, not the appreciation.
Negotiation context
- Only 4 days on market — expect competitive offers; lowballing is unlikely to land.
- 3 sale attempts since 28y ago; this cycle's ask is 187% above the opening price — seller raised mid-cycle; expect resistance to lowballs.
- Current owner paid $110k; list at $336k implies a 205% gain — meaningful room to come down on a strong offer.
Questions for the listing agent
- What do current leases actually rent for vs. the listed asking? Can we see a recent rent roll and the last 12 months of T-12 income?
- Built in 1963 — when were the roof, HVAC, electrical panel, plumbing, and water heater last replaced?
- Is there a deadline driving the sale (1031 exchange, divorce, estate, relocation)? That informs how much negotiation room exists.
- The area grade is low — what's the realistic commute time and amenity access for the typical tenant pool here? Any planned neighborhood developments (good or bad) we should know about?
- What's the average days-on-market for RENTAL listings here right now (not sales)? A rising rental-DOM trend means longer vacancies and softer asking-rent achievability than the comps imply.
- What's the recent tenant-quality profile in this submarket — average credit score on applications, eviction rate, late-payment / NSF rate, and stable-employment percentage? A property-management company in the area should have these aggregated.
- How much new for-sale + rental construction is in the pipeline within 1–3 miles? Heavy new supply typically softens prices + rents 12–24 months out; constrained supply supports both.
Investment metrics
- 1% rule
- 0.52% ✗
- Cap rate
- 3.18%
- Cash-on-cash
- -11.13%
- DSCR
- 0.50
- GRM
- 15.9
CMA / ARV
No comps found within radius.
Projected returns pro-forma
-3.0% appreciation · 3.0% rent growth · sell at horizon
- IRR
- -36.6%
- Equity multiple
- -0.17×
- Total profit
- $-110,021
- Equity at exit
- $50,099
- IRR
- -51.6%
- Equity multiple
- -0.78×
- Total profit
- $-167,389
- Equity at exit
- $29,051
Cash invested: $94,080 (down + closing). Projections, not guarantees.
Landlord ↔ Tenant lean methodology
- Overall (STATE)
- 46 Balanced
- State Minnesota
- 46 Balanced · D+2
- County
- — inherits STATE
- City
- — inherits STATE
ZIP-level market 55008
- Home prices YoY
- -8.9%
- Active inventory
- 193
- Price-to-rent
- 15.9×
Monthly cashflow live
- Estimated rent
- $1,763 medium interval (Pro) →
- Mortgage (P&I)
- −$1,762
- Tax from tax record
- −$363 /mo · $4,360/yr
- Insurance
- −$140
- HOA
- −$0
- Vacancy / Maint / Mgmt
- −$370
- Net cashflow
- $-872
Break-even live
Sensitivity live
| Price | -10% $-682 | -5% $-777 | +0% $-872 | +5% $-968 | +10% $-1,063 |
|---|---|---|---|---|---|
| Rent | -10% $-1,012 | -5% $-942 | +0% $-872 | +5% $-803 | +10% $-733 |
| Rate | -1.0pp $-703 | -0.5pp $-787 | base $-872 | +0.5pp $-960 | +1.0pp $-1,048 |
UW: 25.0% down · 7.5% · 30yr · 1.5% tax · 5.0% vac · 8.0% maint · 8.0% mgmt
Financing live
Cash to close
- Down payment
- $84,000
- Closing costs
- $10,080
- Reserves months
- —
- Total cash needed
- —
Loan-product check · same deal, 3 products live
Conventional
25% down · 7.5% · 30yr
- Down + closing
- —
- Monthly P&I
- —
- Monthly cashflow
- —
- DSCR
- —
- Eligible?
- —
Personal DTI + credit; lowest rate.
DSCR
20% down · 8.5% · 30yr
- Down + closing
- —
- Monthly P&I
- —
- Monthly cashflow
- —
- DSCR
- —
- Eligible?
- —
No personal income docs; deal must DSCR.
Hard money
10% down · 12.0% · 12mo
- Down + closing
- —
- Monthly P&I
- —
- Monthly cashflow
- —
- DSCR
- —
- Eligible?
- —
Short-term bridge; refi at stabilization.
Rent comps 2 comps
| Address | Beds | Baths | Sqft | Rent | $/sqft | DOM | Units | Dist |
|---|---|---|---|---|---|---|---|---|
| 355 Horseshoe Dr Cambridge, MN | 2.0 | 1.0 | 950 | $1,495 | $1.57 | 45d | 1 | 0.78mi |
| 656 Joes Lake Rd SE Cambridge, MN | 3.0 | 2.0 | 1700 | $2,200 | $1.29 | 4d | 1 | 1.26mi |
Listing history 6 events
-
2026-06-15status $336,000 Pending 4 DOM
-
2026-06-13status $336,000 Active 4 DOM
-
2026-06-09days on market $336,000 Coming Soon 4 DOM
-
2026-06-08days on market $336,000 Coming Soon 3 DOM
-
2026-06-07remarks 699-char remark
-
2026-06-07$336,000 Coming Soon 2 DOM
ⓘ Source: listings_history table (triggers on properties + properties_extension) + one-shot
backfill from property_details.listing_events for pre-trigger history.
Tax reassessment forecast MN · Partial reset (capped growth)
- Current annual tax
- $4,360 · $363/mo
- Projected year-2 tax
- $4,360 · $363/mo
- Expected delta
- $0/yr ($0/mo · 0.0%)
ⓘ Screening estimate from a state-policy table — verify with the county assessor before closing.
Climate risk First Street
- Flood 1/10 Low FEMA zone X (unshaded) · 0% chance over 30 yrs
- Wildfire 2/10 Low
- Heat 2/10 Low 7 d/yr ≥97°F today · 13 d/yr by 30 yrs out
- Wind 1/10 Low
- Air quality 2/10 Low 1 unhealthy d/yr today · 1 by 30 yrs out
Nearby sold comps map
Loading sold comps map…
Walkable amenities ~0.75 mi
Loading nearby amenities…
Taxation est. · year 1
- Rental income
- $21,158
- − Mortgage interest
- −$18,821
- − Property taxes
- −$4,360
- − Insurance
- −$1,680
- − Repairs & maintenance
- −$1,693
- − Management
- −$1,693
- − Depreciation
- −$9,775
- Taxable loss
- −$16,863
- Est. tax savings @ 24.0%
- +$4,047
- After-tax cash flow
- $-6,422/yr
For passive investors: Depreciation is non-cash, so a rental often shows a tax loss while cash-flowing — sheltering income. Rental losses are passive: they offset passive income freely, and up to $25,000/yr can offset ordinary (W-2) income if you actively participate and your MAGI is under $100k (phasing out to $0 by $150k); unused losses carry forward. On sale, claimed depreciation is recaptured at up to 25%, and gains may owe capital-gains tax (a 1031 exchange can defer both). Figures are a year-1 estimate at your 24.0% rate — not tax advice; consult a CPA.
Schools (NCES district)
- District
- Cambridge-Isanti Public School District
- NCES district ID
- 2707410
- Math proficiency
- 47% ▼ -12.00%
- Reading proficiency
- 55% ▼ -7.00%
- Median HH income
- $61,340
- Composite
- 44.67/100
- National rank
- #2764
- State rank
- #96 of 301 in MN
Livability — Cambridge
- Score
- 75/100
- State rank
- #180
- US rank
- #3872
Category grades
Schools grade is shown separately in the Schools card above.
Census & demographics
- Census place
- Cambridge, MN
- Population (ZIP)
- 16,091
Population outlook (Isanti County) Hauer SSP2
- Today (2025)
- 39,507 people
- By 2030
- 39,545 · +0.1%
- By 2040
- 38,556 · -2.4%
- By 2050
- 35,837 · -9.3%
- By 2075
- 27,423 · -30.6%
- By 2100
- 18,928 · -52.1%
Race, ethnicity, and origin ACS 2023
- Neighborhood character
- Predominantly White (92%)
- Race & ethnicity
- White 92% Asian 3% Two or more races 2% Black 2% Hispanic / Latino 1%
- Common ancestry
- Portuguese 15% Romanian 3% Lithuanian 3%
- Foreign-born
- 4% · Canada, China
- Languages at home
- 96% English-only · Other Asian/Pacific 2% Spanish 1% Other Indo-European 1%
Political lean MEDSL · Isanti
- 2024 margin
- Solid R (+41.2) · D 28.6% · R 69.8% · Other 1.6%
- 2008→2024 swing
- -25.9pp toward R · 2008: -15.3pp · 2024: -41.2pp
- All cycles
- 2024: R+41.2 2020: R+38.6 2016: R+38.2 2012: R+18.1 2008: R+15.3
Not yet ingested
- Civics
- —
Market trends
- HPI YoY
- ▼ -31.49%
- Current HPI
- 321.7619
- Rent YoY
- —
- Metro
- —
- State GDP YoY
- ▲ 2.41%
- F500 in state
- 34
Industry mix (Fortune 500 HQ in MN)
| Industry | F500 HQs | Revenue |
|---|---|---|
| Healthcare | 2 | $407B |
|
||
| Retail | 2 | $150B |
|
||
| Consumer Goods | 2 | $32B |
|
||
| Industrial Machinery | 2 | $6B |
|
||
| Agriculture | 1 | $40B |
|
||
| Healthcare / Medical Devices | 1 | $32B |
|
||
Price history
+205.7% since first listed12 events — show timeline
- 2026-06-05 Coming Soon $336,000 NORTHSTARMLS as Distributed by MLS Grid
- 2008-04-04 Sold (MLS) $110,000 NORTHSTARMLS as Distributed by MLS Grid
- 2008-03-06 Listing Removed — NORTHSTARMLS as Distributed by MLS Grid
- 2007-09-17 Listed $117,000 NORTHSTARMLS as Distributed by MLS Grid
- 2007-07-13 Listing Removed — NORTHSTARMLS as Distributed by MLS Grid
- 2007-03-08 Listed $177,000 NORTHSTARMLS as Distributed by MLS Grid
- 2005-07-11 Sold (Public Records) $205,000 Public Records
- 2003-02-01 Sold (Public Records) $146,552 Public Records
- 1998-07-30 Sold (Public Records) $107,000 Public Records
- 1998-07-30 Sold (MLS) $107,000 NORTHSTARMLS as Distributed by MLS Grid
- 1998-07-01 Listing Removed — NORTHSTARMLS as Distributed by MLS Grid
- 1998-03-23 Listed $109,900 NORTHSTARMLS as Distributed by MLS Grid
Property tax history
+6.0%/yrLatest (2025): $4,360 · +30.8% YoY. Source: county tax records.
Cash-flow waterfall
monthlySold comps — $/sqft
last 12 mo · ≤1 miLoading sold comps…