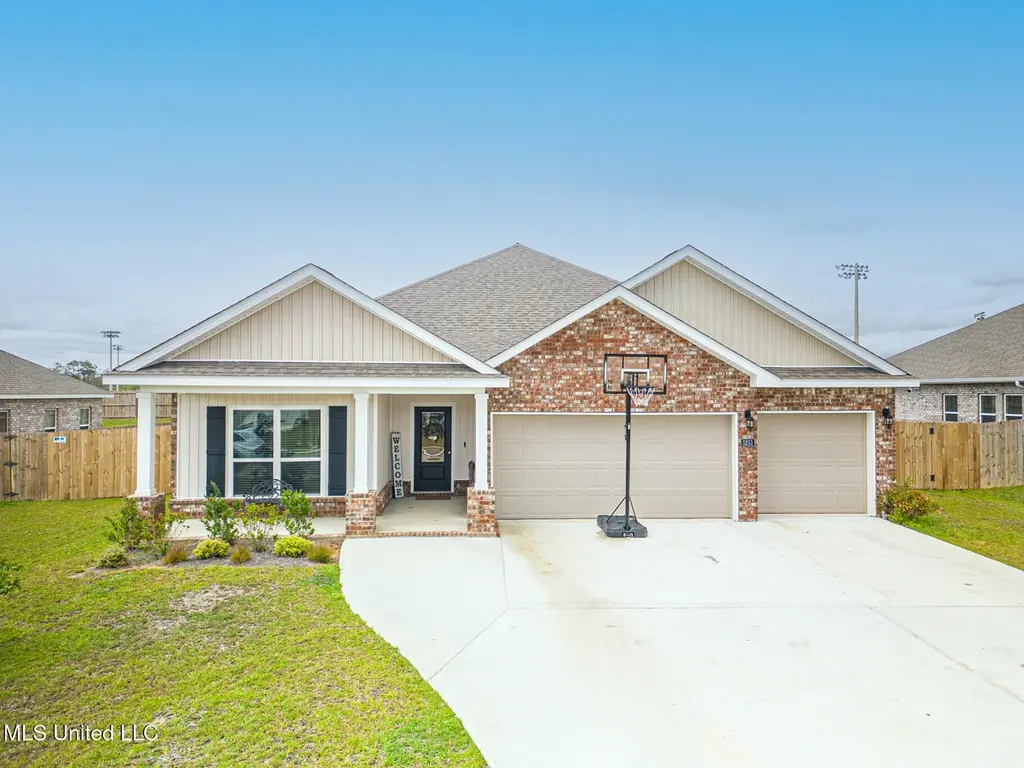
5251 Fairbury Way · D'Iberville, MS
Flood risk 1/10 · Minimal
- FEMA flood zone
- X (unshaded)
- Chance of flooding over 30 yrs
- 0.0%
- Est. flood insurance / yr
- $507 – $1,088
Fire risk 6/10 · Moderate
- Est. fire insurance / yr
- $1,241 – $2,305
Heat risk 9/10 · Severe
- Hot days now (above 107°F)
- 7 days/yr
- Hot days in 30 yrs
- 21 days/yr
Wind risk 9/10 · Severe
- Chance of severe wind over 30 yrs
- 99.0%
Air-quality risk 2/10 · Minimal
- Unhealthy air days now
- 1 days/yr
- Unhealthy air days in 30 yrs
- 2 days/yr
Risk factors via First Street. Map © Google.
Why this score? — see what drove the D grade
The composite is a weighted blend of 9 inputs, each scored 0–100. Each bar is that input's sub-score; the figure is the points it added to the 100-point composite (weight × sub-score).
- ARV discount +13.9/15.0
- Cash flow +9.5/30.0
- Schools +4.2/10.0
- DSCR +2.7/10.0
- Rent growth +2.5/5.0
- Livability +2.5/5.0
- Condition / age +2.5/5.0
- 1% rule +2.2/10.0
- Appreciation +0.0/10.0
$345,000
🖨 Deal sheet (PDF) 📄 Offer letter ✓ Due diligence
Listing remarks MLS
This 4BD/3BA home with an open-concept living area, is ready for your family! Open kitchen with island, soft-close cabinets, granite countertops, and a farmhouse sink. The primary suite has a large soaking tub, separate shower, and walk-in closet. Split floor plan. Smart Home system. 3-car garage. Covered back patio. Close to the interstate, shopping, entertainment, and military bases.
Key facts
- Soft-close cabinets
- Primary suite
- Farmhouse sink
Tags
Neighborhood map
What this means for you Summary
Snapshot
- This is a 4-bed/2.0-bath single-family listed at $345k.
Deal economics
- At list price, monthly cash flow is $-239 ($-3k/yr) — negative.
- To cash-flow at today's rent, offer at most $303k (12.2% below list).
- To meet the 1% rule (rent ≥ 1% of price), the offer needs to be $250k (27.5% below list).
- Recommended offer: $250k (27.5% below list) — sets the bar for 1% rule.
Location & tenants
- Location reads: area grade D — affects rentability + tenant quality, not the cash-flow math above.
- Harrison County School District (rural): math 52% / reading 46% proficiency, ranked #14 of 130 in MS (top 11%) — families likely to look elsewhere, expect single-tenant / working-renter base with shorter leases; 62% free/reduced lunch — lower-income household profile, screen leases tightly.
- Market conditions: 89 active listings in the ZIP; 4 comparable units currently listed for rent nearby; rentals lingering (median 46d on market — plan ~5-8 weeks vacancy on turnover, expect pricing pressure); 75% of comp listings sitting > 30 days — soft ceiling on asking rent; 2,194 units permitted in Harrison County in 2024 (0 in 5+ unit buildings).
Forward outlook
- Local home prices are declining (-3.0%/yr); year-one equity from $2k of loan paydown is wiped out by about $10k of value loss. Plan a longer hold.
- Harrison County population projected at +27% by 2050 — long-run rental-demand tailwind backs the buy-and-hold thesis.
Negotiation context
- It's been on market 69 days — a 6% lower offer ($324k) is reasonable based on typical stale-listing flexibility.
- 6 sale attempts since 4y ago with the ask held roughly flat each time — persistent listings suggest the price (not the market) is what's stuck; bring a comps-based counter.
Risks & watch-outs
- Climate carrying-cost: severe wind risk, 99% chance of damaging wind over 30y; major wildfire risk; extreme-heat days projected 7→21/yr by 2055 (HVAC capex compounding) — expect insurance premiums to compound above CPI over the hold.
Questions for the listing agent
- What do current leases actually rent for vs. the listed asking? Can we see a recent rent roll and the last 12 months of T-12 income?
- It's been on market 69 days. Have you received any prior offers? Is the seller open to a 28% concession, seller financing, or rate buy-down credit?
- What does the HOA fee cover, when was the last increase, and are there any pending special assessments or reserve-fund shortfalls?
- Why hasn't it sold? Are there any deal-killer items the seller is aware of (foundation, flood, title, zoning, code violations)?
- Is there a deadline driving the sale (1031 exchange, divorce, estate, relocation)? That informs how much negotiation room exists.
- The area grade is low — what's the realistic commute time and amenity access for the typical tenant pool here? Any planned neighborhood developments (good or bad) we should know about?
- What's the average days-on-market for RENTAL listings here right now (not sales)? A rising rental-DOM trend means longer vacancies and softer asking-rent achievability than the comps imply.
- What's the recent tenant-quality profile in this submarket — average credit score on applications, eviction rate, late-payment / NSF rate, and stable-employment percentage? A property-management company in the area should have these aggregated.
- How much new for-sale + rental construction is in the pipeline within 1–3 miles? Heavy new supply typically softens prices + rents 12–24 months out; constrained supply supports both.
Investment metrics
- 1% rule
- 0.72% ✗
- Cap rate
- 5.46%
- Cash-on-cash
- -2.97%
- DSCR
- 0.87
- GRM
- 11.5
CMA / ARV
- ARV (median comp)
- $402,644
- List price
- $345,000
- Delta
- -14.32%
- Verdict
- UNDERPRICED
- Comps
- 20 within 1.0 mi
Show comp detail 12 sales within ~0.75 mi
| Address | Dist | Beds/Ba | Sqft | Sold | Price | $/sf | Match |
|---|---|---|---|---|---|---|---|
| 5251 Fairbury Way | 0.00mi | 4/3.0 | 2,304 (-3%) | 0mo | $345,000 | $150 | 90 |
| 5046 Fairbury Way | 0.12mi | 4/2.5 | 2,469 (+4%) | 0mo | $300,000 | $122 | 86 |
| 5113 Fairbury Way | 0.03mi | 4/2.5 | 2,235 (-6%) | 2mo | $291,500 | $130 | 84 |
| 4925 Winsor Cv | 0.41mi | 4/2.0 | 2,269 (-5%) | 1mo | $294,000 | $130 | 72 |
| 15210 Windmill Ridge Pkwy | 0.15mi | 4/2.0 | 2,100 (-12%) | 3mo | $319,500 | $152 | 70 |
| 15224 Windmill Ridge Pkwy | 0.12mi | 4/2.0 | 2,091 (-12%) | 6mo | $312,500 | $149 | 68 |
| 15109 Windmill Ridge Pkwy | 0.35mi | 4/2.5 | 2,304 (-3%) | 10mo | $368,095 | $160 | 68 |
| 15234 Haversham Pl | 0.54mi | 4/3.0 | 2,422 (+2%) | 1mo | $262,500 | $108 | 68 |
| 5267 Fairbury Way | 0.29mi | 4/2.0 | 2,115 (-11%) | 3mo | $332,500 | $157 | 66 |
| 15101 Windmill Ridge Pkwy | 0.37mi | 4/3.0 | 2,486 (+4%) | 10mo | $397,295 | $160 | 64 |
| 15171 Haversham Pl | 0.49mi | 4/2.0 | 2,547 (+7%) | 8mo | $295,000 | $116 | 59 |
| 4950 Windmill Ave | 0.66mi | 4/2.5 | 2,227 (-7%) | 5mo | $235,000 | $106 | 52 |
Match score weights: distance 35% · size 25% · config 20% · recency 20%. Top-matched comps best support the ARV.
Projected returns pro-forma
-3.0% appreciation · 3.0% rent growth · sell at horizon
- IRR
- -21.3%
- Equity multiple
- 0.26×
- Total profit
- $-71,191
- Equity at exit
- $51,441
- IRR
- -14.9%
- Equity multiple
- 0.15×
- Total profit
- $-81,862
- Equity at exit
- $29,829
Cash invested: $96,600 (down + closing). Projections, not guarantees.
Landlord ↔ Tenant lean methodology
- Overall (STATE)
- 90 Strongly Landlord-Friendly
- State Mississippi
- 90 Strongly Landlord-Friendly · R+11
- County
- — inherits STATE
- City
- — inherits STATE
ZIP-level market 39540
- Home prices YoY
- -30.9%
- Active inventory
- 89
- Price-to-rent
- 11.5×
Monthly cashflow live
- Estimated rent
- $2,500 medium interval (Pro) →
- Mortgage (P&I)
- −$1,809
- Tax from tax record
- −$229 /mo · $2,746/yr
- Insurance
- −$144
- HOA
- −$32
- Vacancy / Maint / Mgmt
- −$525
- Net cashflow
- $-239
Break-even live
Sensitivity live
| Price | -10% $-44 | -5% $-141 | +0% $-239 | +5% $-337 | +10% $-434 |
|---|---|---|---|---|---|
| Rent | -10% $-436 | -5% $-338 | +0% $-239 | +5% $-140 | +10% $-41 |
| Rate | -1.0pp $-65 | -0.5pp $-151 | base $-239 | +0.5pp $-328 | +1.0pp $-419 |
UW: 25.0% down · 7.5% · 30yr · 1.5% tax · 5.0% vac · 8.0% maint · 8.0% mgmt
Financing live
Cash to close
- Down payment
- $86,250
- Closing costs
- $10,350
- Reserves months
- —
- Total cash needed
- —
Loan-product check · same deal, 3 products live
Conventional
25% down · 7.5% · 30yr
- Down + closing
- —
- Monthly P&I
- —
- Monthly cashflow
- —
- DSCR
- —
- Eligible?
- —
Personal DTI + credit; lowest rate.
DSCR
20% down · 8.5% · 30yr
- Down + closing
- —
- Monthly P&I
- —
- Monthly cashflow
- —
- DSCR
- —
- Eligible?
- —
No personal income docs; deal must DSCR.
Hard money
10% down · 12.0% · 12mo
- Down + closing
- —
- Monthly P&I
- —
- Monthly cashflow
- —
- DSCR
- —
- Eligible?
- —
Short-term bridge; refi at stabilization.
Rent comps 4 comps
| Address | Beds | Baths | Sqft | Rent | $/sqft | DOM | Units | Dist |
|---|---|---|---|---|---|---|---|---|
| 5126 Fairbury Way Diberville, MS | 4.0 | 2.5 | 2329 | $2,500 | $1.07 | 45d | 1 | 0.06mi |
| 15200 Windmill Ridge Pkwy Diberville, MS | 4.0 | 2.0 | 2091 | $2,600 | $1.24 | 45d | 1 | 0.15mi |
| 17813 Kelso Dr D'Iberville, MS | 4.0 | 2.0 | 1835 | $2,300 | $1.25 | 45d | 1 | 0.49mi |
| 5723 Overland Dr Biloxi, MS | 3.0 | 2.0 | 1736 | $2,249 | $1.30 | 23d | 1 | 0.67mi |
HOA detail
- Monthly dues
- $32 · $384/yr
Listing history 22 events
-
2026-05-06status Pending 388-char remark
Show marketing remark (388 chars)
This 4BD/3BA home with an open-concept living area, is ready for your family! Open kitchen with island, soft-close cabinets, granite countertops, and a farmhouse sink. The primary suite has a large soaking tub, separate shower, and walk-in closet. Split floor plan. Smart Home system. 3-car garage. Covered back patio. Close to the interstate, shopping, entertainment, and military bases.
-
2026-02-26$345,000 Active 388-char remark
Show marketing remark (388 chars)
This 4BD/3BA home with an open-concept living area, is ready for your family! Open kitchen with island, soft-close cabinets, granite countertops, and a farmhouse sink. The primary suite has a large soaking tub, separate shower, and walk-in closet. Split floor plan. Smart Home system. 3-car garage. Covered back patio. Close to the interstate, shopping, entertainment, and military bases.
-
2025-11-12historical
-
2025-07-30price $340,000
-
2025-05-19price $347,000
-
2025-03-15price $348,000
-
2025-02-15price $349,000
-
2025-02-11price $352,000
-
2025-01-10price $354,400
-
2024-11-13$354,900 Active
-
2024-09-09historical
-
2024-07-30price $369,900
-
2024-06-21status Active
-
2024-04-16status Pending
-
2024-04-14$374,900 Active
-
2023-07-28soldstatus Closed
-
2023-06-19status Pending
-
2023-06-15price $367,900
-
2023-06-03price $362,800
-
2023-05-30status Active
-
2023-05-13status Pending
-
2022-11-12$362,900 Active
ⓘ Source: listings_history table (triggers on properties + properties_extension) + one-shot
backfill from property_details.listing_events for pre-trigger history.
Tax reassessment forecast MS · Resets to sale price
- Current annual tax
- $2,746 · $229/mo
- Projected year-2 tax
- $2,746 · $229/mo
- Expected delta
- $0/yr ($0/mo · 0.0%)
ⓘ Screening estimate from a state-policy table — verify with the county assessor before closing.
Climate risk First Street
- Flood 1/10 Low FEMA zone X (unshaded) · 0% chance over 30 yrs
- Wildfire 6/10 Major
- Heat 9/10 Extreme 7 d/yr ≥107°F today · 21 d/yr by 30 yrs out
- Wind 9/10 Extreme 99% chance of damaging wind over 30 yrs
- Air quality 2/10 Low 1 unhealthy d/yr today · 2 by 30 yrs out
Nearby sold comps map
Loading sold comps map…
Walkable amenities ~0.75 mi
Loading nearby amenities…
Taxation est. · year 1
- Rental income
- $29,997
- − Mortgage interest
- −$19,325
- − Property taxes
- −$2,746
- − Insurance
- −$1,725
- − Repairs & maintenance
- −$2,400
- − Management
- −$2,400
- − HOA
- −$384
- − Depreciation
- −$10,036
- Taxable loss
- −$9,019
- Est. tax savings @ 24.0%
- +$2,165
- After-tax cash flow
- $-703/yr
For passive investors: Depreciation is non-cash, so a rental often shows a tax loss while cash-flowing — sheltering income. Rental losses are passive: they offset passive income freely, and up to $25,000/yr can offset ordinary (W-2) income if you actively participate and your MAGI is under $100k (phasing out to $0 by $150k); unused losses carry forward. On sale, claimed depreciation is recaptured at up to 25%, and gains may owe capital-gains tax (a 1031 exchange can defer both). Figures are a year-1 estimate at your 24.0% rate — not tax advice; consult a CPA.
Schools (NCES district)
- District
- Harrison County School District
- NCES district ID
- 2801770
- Math proficiency
- 52% ▼ -4.00%
- Reading proficiency
- 46% ▼ -4.00%
- Median HH income
- $46,504
- Composite
- 41.66/100
- National rank
- #3419
- State rank
- #14 of 130 in MS
Livability — D'Iberville
No livability data for this city. (Only ~50 U.S. cities are tracked.)
Census & demographics
- Census place
- D'Iberville, MS
- Population (ZIP)
- 13,033
Population outlook (Harrison County) Hauer SSP2
- Today (2025)
- 228,444 people
- By 2030
- 241,942 · +5.9%
- By 2040
- 267,531 · +17.1%
- By 2050
- 291,062 · +27.4%
- By 2075
- 346,711 · +51.8%
- By 2100
- 378,165 · +65.5%
Race, ethnicity, and origin ACS 2023
- Neighborhood character
- Diverse neighborhood (Simpson 0.60)
- Race & ethnicity
- White 60% Black 18% Asian 10% Two or more races 9% Hispanic / Latino 9%
- Hispanic origin (detail)
- Common ancestry
- Romanian 5% Slovak 4% Lithuanian 3%
- Foreign-born
- 12% · Canada, Vietnam, South Korea
- Languages at home
- 85% English-only · Spanish 6% Vietnamese 6% Other Asian/Pacific 1%
Political lean MEDSL · Harrison
- 2024 margin
- Strong R (+28.9) · D 35.0% · R 63.9% · Other 1.1%
- 2008→2024 swing
- -2.9pp toward R · 2008: -26.0pp · 2024: -28.9pp
- All cycles
- 2024: R+28.9 2020: R+25.2 2016: R+30.7 2012: R+26.6 2008: R+26.0
Not yet ingested
- Civics
- —
Market trends
- HPI YoY
- ▼ -83.70%
- Current HPI
- 187.2895
- Rent YoY
- —
- Metro
- —
- State GDP YoY
- —
- F500 in state
- 0
Price history
-4.9% since first listed22 events — show timeline
- 2026-05-06 Pending — MLSU
- 2026-02-26 Listed $345,000 MLSU
- 2025-11-12 Listing Removed — MLSU
- 2025-07-30 Price Changed $340,000 MLSU
- 2025-05-19 Price Changed $347,000 MLSU
- 2025-03-15 Price Changed $348,000 MLSU
- 2025-02-15 Price Changed $349,000 MLSU
- 2025-02-11 Price Changed $352,000 MLSU
- 2025-01-10 Price Changed $354,400 MLSU
- 2024-11-13 Listed $354,900 MLSU
- 2024-09-09 Listing Removed — MLSU
- 2024-07-30 Price Changed $369,900 MLSU
- 2024-06-21 Relisted — MLSU
- 2024-04-16 Pending — MLSU
- 2024-04-14 Listed $374,900 MLSU
- 2023-07-28 Sold (MLS) — MLSU
- 2023-06-19 Pending — MLSU
- 2023-06-15 Price Changed $367,900 MLSU
- 2023-06-03 Price Changed $362,800 MLSU
- 2023-05-30 Relisted — MLSU
- 2023-05-13 Pending — MLSU
- 2022-11-12 Listed $362,900 MLSU
Property tax history
+183.1%/yrLatest (2025): $2,746 · +5.1% YoY. Source: county tax records.
Cash-flow waterfall
monthlySold comps — $/sqft
last 12 mo · ≤1 miLoading sold comps…