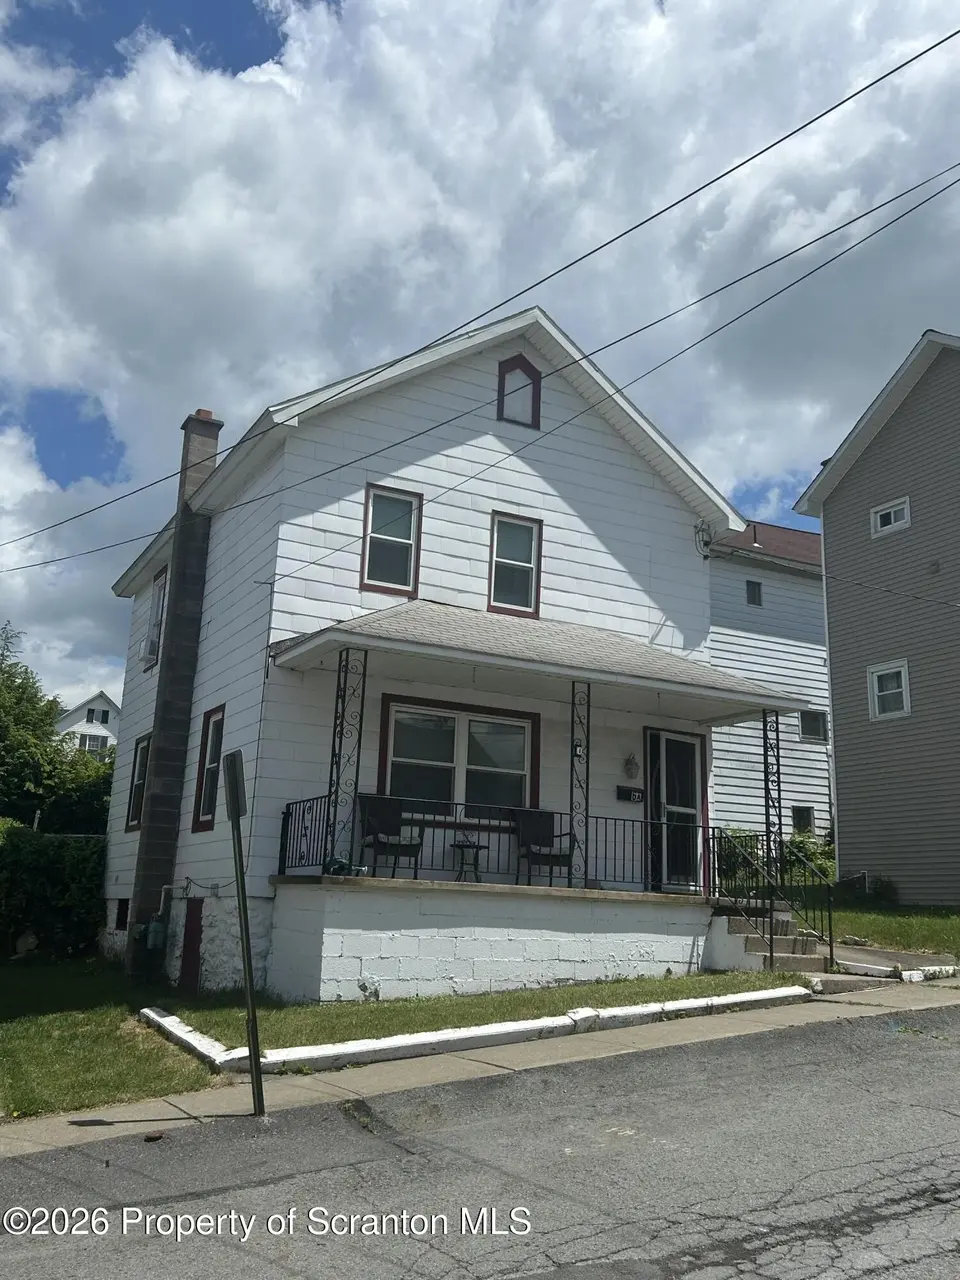
6A Cherry Ave · Carbondale, PA
Flood risk 1/10 · Minimal
- FEMA flood zone
- X (unshaded)
- Chance of flooding over 30 yrs
- 0.0%
- Est. flood insurance / yr
- $473 – $860
Fire risk 3/10 · Minor
- Est. fire insurance / yr
- $511 – $949
Heat risk 3/10 · Minor
- Hot days now (above 90°F)
- 8 days/yr
- Hot days in 30 yrs
- 18 days/yr
Wind risk 2/10 · Minimal
- Chance of severe wind over 30 yrs
- 4.0%
Air-quality risk 2/10 · Minimal
- Unhealthy air days now
- 1 days/yr
- Unhealthy air days in 30 yrs
- 1 days/yr
Risk factors via First Street. Map © Google.
Why this score? — see what drove the B- grade
The composite is a weighted blend of 9 inputs, each scored 0–100. Each bar is that input's sub-score; the figure is the points it added to the 100-point composite (weight × sub-score).
- Cash flow +30.0/30.0
- 1% rule +10.0/10.0
- DSCR +10.0/10.0
- ARV discount +7.4/15.0
- Livability +3.6/5.0
- Rent growth +2.5/5.0
- Condition / age +2.2/5.0
- Schools +2.0/10.0
- Appreciation +0.0/10.0
$79,400
🖨 Deal sheet (PDF) 📄 Offer letter ✓ Due diligence
Listing remarks
A little TLC is all that is needed to make this a charming home. Fireplace in living room adds charm and warm to this home. Small yard.
Key facts
- 1,742 sq ft lot
- Built 1940
- Listed 5 days
Property features AI
Exterior
- Parking: On-street parking
- Utilities: Public water; Public sewer; Electricity connected with circuit breakers; Natural gas connected
- Home design: Single family residence; Residential property; Built circa 1940 (estimated)
- Construction: Shingle siding; Composition roof; Stone foundation
- Exterior features: Private yard; Back yard; Paved city street frontage (approx. 30' frontage, 30 x 60 lot dimensions)
Interior
- Kitchen: Gas oven; Refrigerator; Freezer
- Bedrooms: 3 bedrooms (Bedroom 1: 11 x 10; Bedroom 2: 12 x 11; Bedroom 3: 12 x 12)
- Flooring: Carpet; Laminate
- Bathrooms: 1 full bathroom (6 x 10)
- Heating & cooling: Natural gas heating; Window air conditioning units
- Interior features: Ceiling fans; Eat-in kitchen; Pull-down attic stairs with storage; Block basement with sump pump
- Laundry & utility: Washer; Dryer
Neighborhood map
What this means for you Summary
Snapshot
- This is a 3-bed/1.0-bath single-family listed at $79k. Condition is rated fair.
Deal economics
- At list price, monthly cash flow is $477 ($6k/yr) — positive.
- The deal already cash-flows at list — no discount required.
- Meets the 1% rule at list price ($1k rent vs $79k).
- Cap rate 13.5% vs local median 4.7% in Carbondale — top-decile yield for the area; either an underpriced asset or a hidden risk that comps aren't pricing in. Stress-test before assuming the spread holds.
Location & tenants
- Location reads 72/100 on livability (#648 in PA) — a middle-class / working-renter tenant base. Strengths: crime A+, cost of living A+, housing A+; Watch: amenities D+, employment D, commute F.
- Carbondale Area SD (suburban): math 15% / reading 33% proficiency, ranked #480 of 539 in PA (top 89%) — low school quality limits family demand, transient renter base, plan for 1-2y turnover.
- Zoned schools: Carbondale El Sch (math 9% / reading 28%, grade F, #1,289 of 1,518 statewide, top 85%, 773 students, 46% FRL); Carbondale Area Jshs (math 23% / reading 42%, grade F, #330 of 437 statewide, top 76%, 778 students, 46% FRL).
- Market conditions: 111 active listings in the ZIP; 9 comparable units currently listed for rent nearby; rentals at typical pace (median 15d on market — plan ~3-4 weeks tenant-placement turnaround); 251 units permitted in Lackawanna County in 2024 (0 in 5+ unit buildings).
Forward outlook
- Local home prices are declining (-3.0%/yr); year-one equity from $549 of loan paydown is wiped out by about $2k of value loss. Plan a longer hold.
- Lackawanna County population projected to shrink 4% by 2050 — rents likely to lag national; underwrite the cash flow, not the appreciation.
- At projected returns (-3.0% appreciation + 3.0% rent growth), your $22k cash investment doubles in ~5 years — after that, you're playing with house money.
Negotiation context
- Only 5 days on market — expect competitive offers; lowballing is unlikely to land.
Risks & watch-outs
- Watch-outs: built in 1940 — expect roof / HVAC / electrical / plumbing capex.
Questions for the listing agent
- Have any recent inspections been done? Can we get a copy of the seller's disclosures and any deferred-maintenance estimates?
- Built in 1940 — when were the roof, HVAC, electrical panel, plumbing, and water heater last replaced?
- Is there a deadline driving the sale (1031 exchange, divorce, estate, relocation)? That informs how much negotiation room exists.
- Schools are D-rated, which usually means shorter tenancies and higher turnover. Who's the typical renter profile here, and what's been the actual vacancy rate?
- What's the average days-on-market for RENTAL listings here right now (not sales)? A rising rental-DOM trend means longer vacancies and softer asking-rent achievability than the comps imply.
- What's the recent tenant-quality profile in this submarket — average credit score on applications, eviction rate, late-payment / NSF rate, and stable-employment percentage? A property-management company in the area should have these aggregated.
- How much new for-sale + rental construction is in the pipeline within 1–3 miles? Heavy new supply typically softens prices + rents 12–24 months out; constrained supply supports both.
Investment metrics
- 1% rule
- 1.63% ✓
- Cap rate
- 13.50%
- Cash-on-cash
- 25.73%
- DSCR
- 2.14
- GRM
- 5.1
CMA / ARV
- ARV (on-the-fly)
- $79,200
- Comps found
- 2
Show comp detail 2 sales within ~0.75 mi
| Address | Dist | Beds/Ba | Sqft | Sold | Price | $/sf | Match |
|---|---|---|---|---|---|---|---|
| 28 Rock St | 0.48mi | 2/1.0 (-1) | 870 (-1%) | 9mo | $73,500 | $84 | 63 |
| 63 8th Ave | 0.73mi | 2/2.0 (-1) | 1,003 (+14%) | 21mo | $90,000 | $90 | 16 |
Match score weights: distance 35% · size 25% · config 20% · recency 20%. Top-matched comps best support the ARV.
Projected returns pro-forma
-3.0% appreciation · 3.0% rent growth · sell at horizon
- IRR
- 19.4%
- Equity multiple
- 1.79×
- Total profit
- $17,517
- Equity at exit
- $11,839
- IRR
- 27.7%
- Equity multiple
- 3.45×
- Total profit
- $54,432
- Equity at exit
- $6,865
Cash invested: $22,232 (down + closing). Projections, not guarantees.
Landlord ↔ Tenant lean methodology
- Overall (STATE)
- 62 Landlord-Friendly
- State Pennsylvania
- 62 Landlord-Friendly · EVEN
- County
- — inherits STATE
- City
- — inherits STATE
ZIP-level market 18407
- Home prices YoY
- -29.8%
- Active inventory
- 111
- Price-to-rent
- 5.1×
Monthly cashflow live
- Estimated rent
- $1,298 high interval (Pro) →
- Mortgage (P&I)
- −$416
- Tax est. 1.5%
- −$99 /mo · $1,191/yr
- Insurance
- −$33
- HOA
- −$0
- Vacancy / Maint / Mgmt
- −$273
- Net cashflow
- $477
Break-even live
Sensitivity live
| Price | -10% $532 | -5% $504 | +0% $477 | +5% $449 | +10% $422 |
|---|---|---|---|---|---|
| Rent | -10% $374 | -5% $425 | +0% $477 | +5% $528 | +10% $579 |
| Rate | -1.0pp $517 | -0.5pp $497 | base $477 | +0.5pp $456 | +1.0pp $435 |
UW: 25.0% down · 7.5% · 30yr · 1.5% tax · 5.0% vac · 8.0% maint · 8.0% mgmt
Financing live
Cash to close
- Down payment
- $19,850
- Closing costs
- $2,382
- Reserves months
- —
- Total cash needed
- —
Loan-product check · same deal, 3 products live
Conventional
25% down · 7.5% · 30yr
- Down + closing
- —
- Monthly P&I
- —
- Monthly cashflow
- —
- DSCR
- —
- Eligible?
- —
Personal DTI + credit; lowest rate.
DSCR
20% down · 8.5% · 30yr
- Down + closing
- —
- Monthly P&I
- —
- Monthly cashflow
- —
- DSCR
- —
- Eligible?
- —
No personal income docs; deal must DSCR.
Hard money
10% down · 12.0% · 12mo
- Down + closing
- —
- Monthly P&I
- —
- Monthly cashflow
- —
- DSCR
- —
- Eligible?
- —
Short-term bridge; refi at stabilization.
Rent comps 9 comps
| Address | Beds | Baths | Sqft | Rent | $/sqft | DOM | Units | Dist |
|---|---|---|---|---|---|---|---|---|
| 85 Belmont St Carbondale, PA | 2.0 | 1.0 | 1000 | $1,200 | $1.20 | 15d | 1 | 0.06mi |
| 83 Spring St Carbondale, PA | 2.0 | 1.0 | 1015 | $1,650 | $1.63 | 45d | 1 | 0.48mi |
| 109 Salem Ave Unit 1Fl Carbondale, PA | 2.0 | 1.0 | 960 | $1,300 | $1.35 | 15d | 1 | 0.50mi |
| 37 Green St Carbondale, PA | 3.0 | 1.0 | 707 | $1,375 | $1.94 | 15d | 1 | 0.55mi |
| 4 Apple Ave Apt 4 Carbondale, PA | 2.0 | 1.0 | 850 | $1,114 | $1.31 | 22d | 1 | 0.59mi |
| 418 N Main St Unit 1B Simpson, PA | 2.0 | 1.0 | 1050 | $1,175 | $1.12 | 45d | 1 | 0.84mi |
| 18 Parish Ct Carbondale, PA | 2.0 | 1.0 | 1050 | $1,300 | $1.24 | 15d | 1 | 0.91mi |
| 35 Rittenhouse St Unit 1st floor Carbondale, PA | 2.0 | 1.0 | 800 | $900 | $1.12 | 45d | 1 | 0.94mi |
| 540 N Main St Simpson, PA | 2.0 | 1.0 | 639 | $1,200 | $1.88 | 15d | 1 | 1.00mi |
Listing history 5 events
-
2026-06-14statusdays on market $79,400 Pending 5 DOM
-
2026-06-13days on market $79,400 Active 4 DOM
-
2026-06-10days on market $79,400 Active 2 DOM
-
2026-06-09remarks 135-char remark
-
2026-06-09$79,400 Active 1 DOM
ⓘ Source: listings_history table (triggers on properties + properties_extension) + one-shot
backfill from property_details.listing_events for pre-trigger history.
Climate risk First Street
- Flood 1/10 Low FEMA zone X (unshaded) · 0% chance over 30 yrs
- Wildfire 3/10 Moderate
- Heat 3/10 Moderate 8 d/yr ≥90°F today · 18 d/yr by 30 yrs out
- Wind 2/10 Low 4% chance of damaging wind over 30 yrs
- Air quality 2/10 Low 1 unhealthy d/yr today · 1 by 30 yrs out
Nearby sold comps map
Loading sold comps map…
Walkable amenities ~0.75 mi
Loading nearby amenities…
Taxation est. · year 1
- Rental income
- $15,577
- − Mortgage interest
- −$4,448
- − Property taxes
- −$1,191
- − Insurance
- −$397
- − Repairs & maintenance
- −$1,246
- − Management
- −$1,246
- − Depreciation
- −$2,310
- Taxable income
- $4,739
- Est. tax owed @ 24.0%
- −$1,137
- After-tax cash flow
- $4,584/yr
For passive investors: Depreciation is non-cash, so a rental often shows a tax loss while cash-flowing — sheltering income. Rental losses are passive: they offset passive income freely, and up to $25,000/yr can offset ordinary (W-2) income if you actively participate and your MAGI is under $100k (phasing out to $0 by $150k); unused losses carry forward. On sale, claimed depreciation is recaptured at up to 25%, and gains may owe capital-gains tax (a 1031 exchange can defer both). Figures are a year-1 estimate at your 24.0% rate — not tax advice; consult a CPA.
Condition & rehab AI · 12 photos
This home requires moderate renovations to improve its condition and increase its value. Focus on cleaning, painting, and updating the kitchen and bathrooms.
Repairs flagged
- Minor kitchen countertops — Cluttered and could use cleaning
- Minor bathroom fixtures — Not visible, but likely outdated
- Minor exterior siding — Some discoloration
Value-add opportunities
- Both paint interior walls — Fresh paint enhances curb appeal and interior aesthetics
- Both replace kitchen countertops — New countertops improve functionality and appearance
- Both update bathroom fixtures — Modern fixtures increase appeal and functionality
Renovation cost estimate screening
| Repair item | Severity | Est. cost |
|---|---|---|
| kitchen countertops · Cluttered and could use cleaning | Minor | $500–3,000 |
| bathroom fixtures · Not visible, but likely outdated | Minor | $500–3,000 |
| exterior siding · Some discoloration | Minor | $500–3,000 |
| Total estimated repair cost · 3 items | $1,500–9,000 |
Value-add ROI direction
- Both paint interior walls — Fresh paint enhances curb appeal and interior aesthetics ↑
- Both replace kitchen countertops — New countertops improve functionality and appearance ↑
- Both update bathroom fixtures — Modern fixtures increase appeal and functionality ↑
ⓘ Cost ranges are severity-bucket heuristics (US national rule-of-thumb). Get contractor quotes + a written scope before underwriting a rehab budget.
Schools (NCES district)
- District
- Carbondale Area SD
- NCES district ID
- 4204980
- Math proficiency
- 15% ▼ -14.00%
- Reading proficiency
- 33% ▼ -23.00%
- Median HH income
- $35,070
- Composite
- 19.73/100
- National rank
- #8714
- State rank
- #480 of 539 in PA
Livability — Carbondale
- Score
- 72/100
- State rank
- #648
- US rank
- #6298
Category grades
Schools grade is shown separately in the Schools card above.
Census & demographics
- Census place
- Carbondale, PA
- County
- Lackawanna County · 134,448 people
- City population
- 14,445
- Metro
- Scranton--Wilkes-Barre, PA
- Population (ZIP)
- 14,445
- Household income
- $59,652
- Rent vs Own
- Severe rent burden
- 430.0
Population outlook (Lackawanna County) Hauer SSP2
- Today (2025)
- 210,652 people
- By 2030
- 208,623 · -1.0%
- By 2040
- 203,980 · -3.2%
- By 2050
- 201,069 · -4.5%
- By 2075
- 205,026 · -2.7%
- By 2100
- 210,851 · +0.1%
Race, ethnicity, and origin ACS 2023
- Neighborhood character
- Predominantly White (85%)
- Race & ethnicity
- White 85% Hispanic / Latino 9% Two or more races 6% Black 1% Asian 1%
- Hispanic origin (detail)
- Mexican 2% Puerto Rican 5%
- Common ancestry
- Romanian 11% Scotch-Irish 3% Subsaharan African 1%
- Foreign-born
- 2% · Canada, Vietnam
- Languages at home
- 95% English-only · Spanish 3% Other Indo-European 1% Russian/Polish/Slavic 1%
Political lean MEDSL · Lackawanna
- 2024 margin
- Toss-up / Even · D 51.0% · R 48.3%
- 2008→2024 swing
- -23.2pp toward R · 2008: 26.0pp · 2024: 2.8pp
- All cycles
- 2024: D+2.8 2020: D+8.4 2016: D+3.4 2012: D+27.4 2008: D+26.0
Not yet ingested
- Civics
- —
Market trends
- HPI YoY
- ▼ -59.46%
- Current HPI
- 140.1227
- Rent YoY
- —
- Metro
- Scranton--Wilkes-Barre, PA
- State GDP YoY
- ▲ 1.68%
- F500 in state
- 34
Industry mix (Fortune 500 HQ in PA)
| Industry | F500 HQs | Revenue |
|---|---|---|
| Healthcare | 2 | $309B |
|
||
| Insurance | 2 | $27B |
|
||
| Telecommunications / Media | 1 | $124B |
|
||
| Industrial Distribution | 1 | $22B |
|
||
| Financial Services | 1 | $20B |
|
||
| Chemicals / Materials | 1 | $18B |
|
||
Price history
1 event — show timeline
- 2026-06-07 Listed $79,400 GSBR as distributed by MLS GRID
Cash-flow waterfall
monthlySold comps — $/sqft
last 12 mo · ≤1 miLoading sold comps…