245 Seminole · Quitman, TX
Flood risk 1/10 · Minimal
- FEMA flood zone
- X (unshaded)
- Chance of flooding over 30 yrs
- 0.0%
- Est. flood insurance / yr
- $507 – $1,088
Fire risk 4/10 · Minor
- Est. fire insurance / yr
- $1,222 – $2,270
Heat risk 7/10 · Major
- Hot days now (above 111°F)
- 7 days/yr
- Hot days in 30 yrs
- 25 days/yr
Wind risk 6/10 · Moderate
- Chance of severe wind over 30 yrs
- 27.0%
Air-quality risk 2/10 · Minimal
- Unhealthy air days now
- 0 days/yr
- Unhealthy air days in 30 yrs
- 1 days/yr
Risk factors via First Street. Map © Google.
Why this score? — see what drove the B+ grade
The composite is a weighted blend of 9 inputs, each scored 0–100. Each bar is that input's sub-score; the figure is the points it added to the 100-point composite (weight × sub-score).
- Cash flow +30.0/30.0
- ARV discount +15.0/15.0
- DSCR +10.0/10.0
- 1% rule +9.8/10.0
- Livability +3.8/5.0
- Schools +3.5/10.0
- Rent growth +2.5/5.0
- Condition / age +2.5/5.0
- Appreciation +0.0/10.0
$99,500
🖨 Deal sheet 📄 Offer letter ✓ Due diligence
Listing remarks
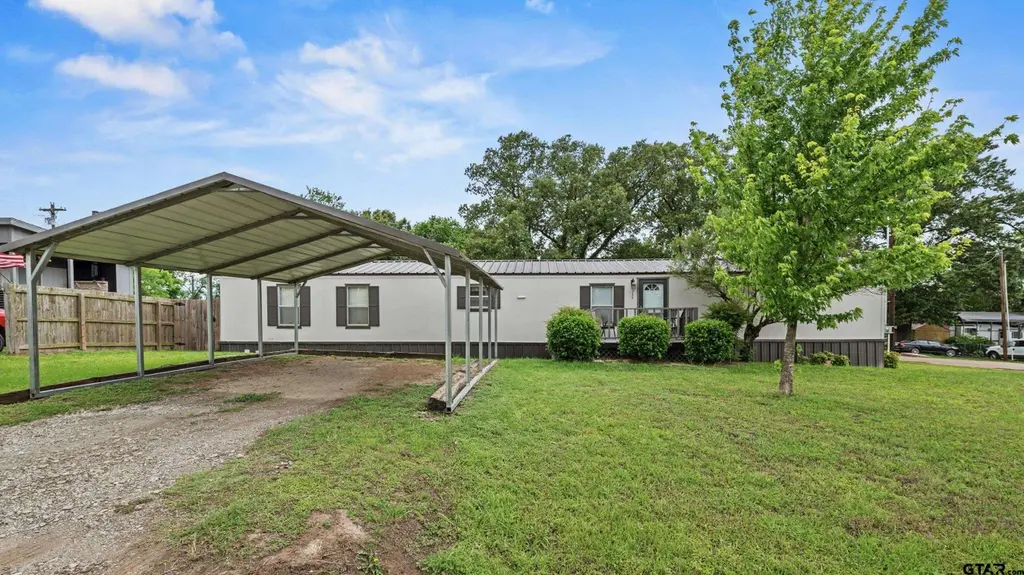
FULLY FURNISHED! Welcome to 245 Seminole in the gated Holiday Village community on beautiful Lake Fork! This well maintained 3 bedroom, 2 bathroom home offers comfortable living with a spacious open concept layout, large living area, and a split bedroom floor plan for added privacy. The kitchen features ample cabinet space, an island, and an easy flow into the dining and living areas, making it perfect for everyday living or weekend lake getaways. The oversized primary suite offers plenty of space along with a large ensuite bathroom featuring a soaking tub, separate shower, and generous storage. Recent updates and major improvements provide peace of mind, including a metal roof, exterior pa
Key facts
- Soaking tub
- Ample cabinet space
- Separate shower
Tags
Property features AI
Finance
- HOA & community: Monthly HOA fee of $52; Gated community; Community pool
Exterior
- Home design: Single-story; Manufactured (mobile) home; Residential property
- Construction: Metal roof
- Exterior features: Patio; Wood fencing
Interior
- Kitchen: Dishwasher; Electric oven; Electric range
- Bathrooms: 2 full bathrooms
- Heating & cooling: Central heating (electric); Central air conditioning
- Interior features: Walk-in closet(s)
Neighborhood map
What this means for you Summary
Snapshot
- This is a 3-bed/2.0-bath single-family listed at $100k.
Deal economics
- At list price, monthly cash flow is $473 ($6k/yr) — positive.
- The deal already cash-flows at list — no discount required.
- Meets the 1% rule at list price ($1k rent vs $100k).
- Recommended offer: $97k (3.0% below list) — sets the bar for market timing.
- Cap rate 12.0% vs local median 4.2% in Quitman — top-decile yield for the area; either an underpriced asset or a hidden risk that comps aren't pricing in. Stress-test before assuming the spread holds.
Location & tenants
- Location reads 76/100 on livability (#106 in TX, #3,504 nationally) — a middle-class / working-renter tenant base. Strengths: cost of living A+, housing A+, health & safety A+; Watch: employment C-, amenities F, commute F.
- Quitman ISD (town): math 36% / reading 47% proficiency, ranked #381 of 826 in TX (top 46%) — families likely to look elsewhere, expect single-tenant / working-renter base with shorter leases.
- Zoned schools: Quitman El (math 40% / reading 43%, grade F, #1,437 of 4,322 statewide, top 34%, 581 students, 64% FRL); Quitman J H (math 38% / reading 44%, grade F, #613 of 1,662 statewide, top 38%, 270 students, 58% FRL); Quitman H S (math 22% / reading 62%, grade F, #730 of 1,632 statewide, top 47%, 365 students, 53% FRL).
- Market conditions: 200 active listings in the ZIP; 72 units permitted in Wood County in 2024 (29 in 5+ unit buildings).
Forward outlook
- Local home prices are declining (-3.0%/yr); year-one equity from $688 of loan paydown is wiped out by about $3k of value loss. Plan a longer hold.
- Wood County population projected at +12% by 2050 — modest demand growth; plan on rents tracking national, not racing it.
- At projected returns (-3.0% appreciation + 3.0% rent growth), your $28k cash investment doubles in ~6 years — after that, you're playing with house money.
Negotiation context
- It's been on market 49 days — a 3% lower offer ($97k) is reasonable based on typical stale-listing flexibility.
- 3 sale attempts with the ask held roughly flat each time — persistent listings suggest the price (not the market) is what's stuck; bring a comps-based counter.
- Current owner paid $20k; list at $100k implies a 398% gain — meaningful room to come down on a strong offer.
Risks & watch-outs
- Climate carrying-cost: major wind risk, 27% chance of damaging wind over 30y; extreme-heat days projected 7→25/yr by 2055 (HVAC capex compounding) — expect insurance premiums to compound above CPI over the hold.
Questions for the listing agent
- It's been on market 49 days. Have you received any prior offers? Is the seller open to a 3% concession, seller financing, or rate buy-down credit?
- What does the HOA fee cover, when was the last increase, and are there any pending special assessments or reserve-fund shortfalls?
- Is there a deadline driving the sale (1031 exchange, divorce, estate, relocation)? That informs how much negotiation room exists.
- What's the average days-on-market for RENTAL listings here right now (not sales)? A rising rental-DOM trend means longer vacancies and softer asking-rent achievability than the comps imply.
- What's the recent tenant-quality profile in this submarket — average credit score on applications, eviction rate, late-payment / NSF rate, and stable-employment percentage? A property-management company in the area should have these aggregated.
- How much new for-sale + rental construction is in the pipeline within 1–3 miles? Heavy new supply typically softens prices + rents 12–24 months out; constrained supply supports both.
Investment metrics
- 1% rule
- 1.48% ✓
- Cap rate
- 12.00%
- Cash-on-cash
- 20.39%
- DSCR
- 1.91
- GRM
- 5.6
CMA / ARV
- ARV (median comp)
- $146,641
- List price
- $99,500
- Delta
- -32.15%
- Verdict
- UNDERPRICED
- Comps
- 5 within 1.0 mi
Show comp detail 8 sales within ~0.75 mi
| Address | Dist | Beds/Ba | Sqft | Sold | Price | $/sf | Match |
|---|---|---|---|---|---|---|---|
| 399 Cheyenne | 0.11mi | 3/2.0 | 1,120 (-8%) | 14mo | $89,900 | $80 | 70 |
| 269 Apache | 0.20mi | 2/2.0 (-1) | 1,326 (+9%) | 2mo | $200,000 | $151 | 69 |
| 167 Shawnee | 0.53mi | 3/2.0 | 1,232 (+1%) | 8mo | $269,900 | $219 | 67 |
| 342 Whitedove | 0.31mi | 3/2.0 | 1,248 (+3%) | 18mo | $50,000 | $40 | 66 |
| 141 County Road 1215 | 0.56mi | 2/1.0 (-1) | 1,200 (-1%) | 1mo | $170,000 | $142 | 62 |
| 434 Geronimo | 0.36mi | 2/2.0 (-1) | 1,368 (+12%) | 2mo | $120,000 | $88 | 56 |
| 408 Whitefoot | 0.35mi | 2/2.0 (-1) | 1,350 (+11%) | 6mo | $244,900 | $181 | 56 |
| 179 Wichita | 0.68mi | 2/2.0 (-1) | 1,100 (-10%) | 10mo | $275,000 | $250 | 39 |
Match score weights: distance 35% · size 25% · config 20% · recency 20%. Top-matched comps best support the ARV.
Projected returns pro-forma
-3.0% appreciation · 3.0% rent growth · sell at horizon
- IRR
- 12.7%
- Equity multiple
- 1.50×
- Total profit
- $14,055
- Equity at exit
- $14,836
- IRR
- 21.6%
- Equity multiple
- 2.84×
- Total profit
- $51,167
- Equity at exit
- $8,603
Cash invested: $27,860 (down + closing). Projections, not guarantees.
Landlord ↔ Tenant lean methodology
- Overall (STATE)
- 87 Strongly Landlord-Friendly
- State Texas
- 87 Strongly Landlord-Friendly · R+5
- County
- — inherits STATE
- City
- — inherits STATE
ZIP-level market 75783
- Home prices YoY
- -9.6%
- Active inventory
- 200
- Price-to-rent
- 5.6×
Monthly cashflow live
- Estimated rent
- $1,475 medium interval (Pro) →
- Mortgage (P&I)
- −$522
- Tax from tax record
- −$77 /mo · $919/yr
- Insurance
- −$41
- HOA
- −$52
- Vacancy / Maint / Mgmt
- −$310
- Net cashflow
- $473
Break-even live
UW: 25.0% down · 7.5% · 30yr · 1.5% tax · 5.0% vac · 8.0% maint · 8.0% mgmt
Financing live
Cash to close
- Down payment
- $24,875
- Closing costs
- $2,985
- Reserves months
- —
- Total cash needed
- —
Loan-product check · same deal, 3 products live
Conventional
25% down · 7.5% · 30yr
- Down + closing
- —
- Monthly P&I
- —
- Monthly cashflow
- —
- DSCR
- —
- Eligible?
- —
Personal DTI + credit; lowest rate.
DSCR
20% down · 8.5% · 30yr
- Down + closing
- —
- Monthly P&I
- —
- Monthly cashflow
- —
- DSCR
- —
- Eligible?
- —
No personal income docs; deal must DSCR.
Hard money
10% down · 12.0% · 12mo
- Down + closing
- —
- Monthly P&I
- —
- Monthly cashflow
- —
- DSCR
- —
- Eligible?
- —
Short-term bridge; refi at stabilization.
HOA detail
- Monthly dues
- $52 · $624/yr
- Likely covers
- security
Listing history 19 events
-
2026-06-16status $99,500 Pending 49 DOM
-
2026-06-15days on market $99,500 Active 49 DOM
-
2026-06-15days on market $99,500 Active 48 DOM
-
2026-06-13days on market $99,500 Active 47 DOM
-
2026-06-12days on market $99,500 Active 46 DOM
-
2026-06-09days on market $99,500 Active 43 DOM
-
2026-06-08days on market $99,500 Active 42 DOM
-
2026-06-08days on market $99,500 Active 41 DOM
-
2026-06-07days on market $99,500 Active 40 DOM
-
2026-06-03days on market $99,500 Active 37 DOM
-
2026-06-02days on market $99,500 Active 36 DOM
-
2026-06-01days on market $99,500 Active 35 DOM
-
2026-05-31days on market $99,500 Active 34 DOM
-
2026-04-26$99,500 Active 1263-char remark
-
2026-03-26price $110,000
-
2026-03-12$120,000 Active
-
2012-01-03soldstatus $20,000
-
2008-04-09soldstatus
-
2006-09-28soldstatus
ⓘ Source: listings_history table (triggers on properties + properties_extension) + one-shot
backfill from property_details.listing_events for pre-trigger history.
Tax reassessment forecast TX · Resets to sale price
- Current annual tax
- $919 · $77/mo
- Projected year-2 tax
- $1,821 · $152/mo
- Expected delta
- +$902/yr (+$75/mo · 98.1%)
ⓘ Screening estimate from a state-policy table — verify with the county assessor before closing.
Climate risk First Street
- Flood 1/10 Low FEMA zone X (unshaded) · 0% chance over 30 yrs
- Wildfire 4/10 Moderate
- Heat 7/10 Severe 7 d/yr ≥111°F today · 25 d/yr by 30 yrs out
- Wind 6/10 Major 27% chance of damaging wind over 30 yrs
- Air quality 2/10 Low 0 unhealthy d/yr today · 1 by 30 yrs out
Nearby sold comps map
Loading sold comps map…
Walkable amenities ~0.75 mi
Loading nearby amenities…
Taxation est. · year 1
- Rental income
- $17,700
- − Mortgage interest
- −$5,574
- − Property taxes
- −$919
- − Insurance
- −$498
- − Repairs & maintenance
- −$1,416
- − Management
- −$1,416
- − HOA
- −$624
- − Depreciation
- −$2,895
- Taxable income
- $4,360
- Est. tax owed @ 24.0%
- −$1,046
- After-tax cash flow
- $4,635/yr
For passive investors: Depreciation is non-cash, so a rental often shows a tax loss while cash-flowing — sheltering income. Rental losses are passive: they offset passive income freely, and up to $25,000/yr can offset ordinary (W-2) income if you actively participate and your MAGI is under $100k (phasing out to $0 by $150k); unused losses carry forward. On sale, claimed depreciation is recaptured at up to 25%, and gains may owe capital-gains tax (a 1031 exchange can defer both). Figures are a year-1 estimate at your 24.0% rate — not tax advice; consult a CPA.
Schools (NCES district)
- District
- Quitman ISD
- NCES district ID
- 4836300
- Math proficiency
- 36% ▼ -15.00%
- Reading proficiency
- 47% ▼ -4.00%
- Median HH income
- $42,081
- Composite
- 34.94/100
- National rank
- #5063
- State rank
- #381 of 826 in TX
Livability — Quitman
- Score
- 76/100
- State rank
- #106
- US rank
- #3504
Category grades
Schools grade is shown separately in the Schools card above.
Census & demographics
- Population (ZIP)
- 8,011
Population outlook (Wood County) Hauer SSP2
- Today (2025)
- 46,480 people
- By 2030
- 47,796 · +2.8%
- By 2040
- 50,142 · +7.9%
- By 2050
- 52,122 · +12.1%
- By 2075
- 57,033 · +22.7%
- By 2100
- 56,418 · +21.4%
Race, ethnicity, and origin ACS 2023
- Neighborhood character
- Predominantly White (81%)
- Race & ethnicity
- White 81% Hispanic / Latino 13% Two or more races 9% Black 2%
- Hispanic origin (detail)
- Mexican 12%
- Common ancestry
- Italian 3% Slovak 3% Portuguese 1%
- Foreign-born
- 2% · Canada
- Languages at home
- 92% English-only · Spanish 8%
Political lean MEDSL · Wood
- 2024 margin
- Solid R (+69.7) · D 14.8% · R 84.6%
- 2008→2024 swing
- -15.5pp toward R · 2008: -54.2pp · 2024: -69.7pp
- All cycles
- 2024: R+69.7 2020: R+68.2 2016: R+70.0 2012: R+64.2 2008: R+54.2
Not yet ingested
- Civics
- —
Market trends
- HPI YoY
- ▼ -24.83%
- Current HPI
- 234.4883
- Rent YoY
- —
- Metro
- —
- State GDP YoY
- ▲ 3.95%
- F500 in state
- 110
Industry mix (Fortune 500 HQ in TX)
| Industry | F500 HQs | Revenue |
|---|---|---|
| Energy | 16 | $1,198B |
|
||
| Technology | 5 | $198B |
|
||
| Engineering / Construction | 4 | $72B |
|
||
| Energy Services | 3 | $60B |
|
||
| Utilities | 3 | $41B |
|
||
| Healthcare | 2 | $330B |
|
||
Price history
+397.5% since first listed9 events — show timeline
- 2026-06-15 Pending — GTAR
- 2026-05-23 Relisted — GTAR
- 2026-05-20 Pending — GTAR
- 2026-04-26 Listed $99,500 GTAR
- 2026-03-26 Price Changed $110,000 NTREIS
- 2026-03-12 Listed $120,000 NTREIS
- 2012-01-03 Sold (Public Records) $20,000 Public Records
- 2008-04-09 Sold (Public Records) — Public Records
- 2006-09-28 Sold (Public Records) — Public Records
Property tax history
+10.8%/yrLatest (2025): $919 · +47.4% YoY. Source: county tax records.
Cash-flow waterfall
monthlySold comps — $/sqft
last 12 mo · ≤1 miLoading sold comps…