 🏗️ New Construction
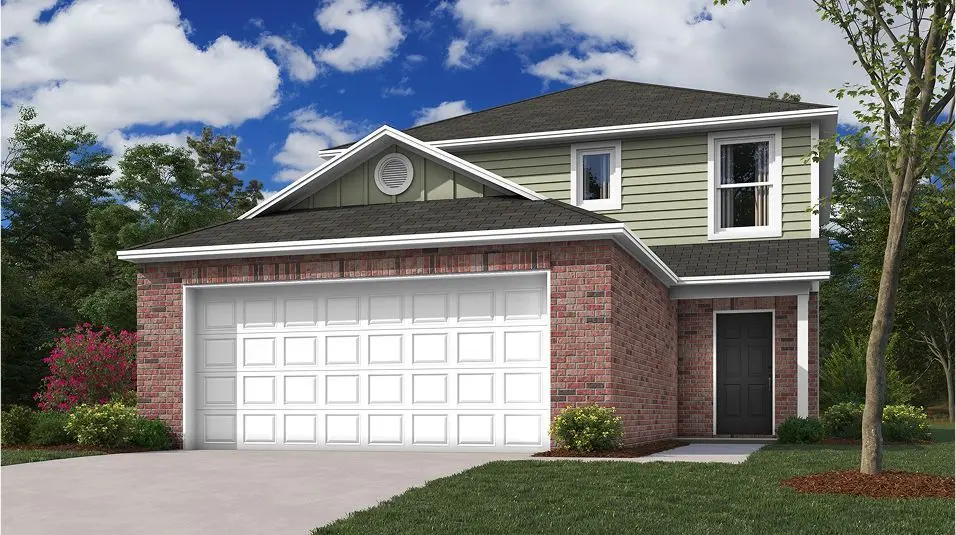
RC Holland Plan · Conroe, TX
Flood risk No data
- FEMA flood zone
- —
- Chance of flooding over 30 yrs
- —
- Est. flood insurance / yr
- —
Fire risk No data
- Est. fire insurance / yr
- —
Heat risk No data
- Hot days now (above threshold)
- —
- Hot days in 30 yrs
- —
Wind risk No data
- Chance of severe wind over 30 yrs
- —
Air-quality risk No data
- Unhealthy air days now
- —
- Unhealthy air days in 30 yrs
- —
Risk factors via First Street. Map © Google.
Why this score? — see what drove the D grade
The composite is a weighted blend of 9 inputs, each scored 0–100. Each bar is that input's sub-score; the figure is the points it added to the 100-point composite (weight × sub-score).
- Cash flow +12.0/30.0
- ARV discount +7.5/15.0
- Schools +5.1/10.0
- Condition / age +5.0/5.0
- Livability +3.7/5.0
- DSCR +3.5/10.0
- 1% rule +3.4/10.0
- Rent growth +2.6/5.0
- Appreciation +0.0/10.0
$234,990
🖨 Deal sheet (PDF) 📄 Offer letter ✓ Due diligence
Listing remarks MLS
This new home presents two floors designed for seamless living and comfort. At the heart of the first floor is a welcoming family room with direct access to a multifunctional kitchen, dining area and a covered rear patio. All three bedrooms are tucked upstairs for maximum privacy and center around a versatile loft for additional living space. The owner's suite is a tranquil retreat with an attached bathroom and walk-in closet.
Key facts
- Covered rear patio
- Attached bathroom
- Walk-in closet
Tags
Neighborhood map
What this means for you Summary
Snapshot
- This is a 3-bed/2.5-bath single-family listed at $235k. Condition is rated excellent.
Deal economics
- At list price, monthly cash flow is $-58 ($-701/yr) — negative.
- To cash-flow at today's rent, offer at most $234k (0.4% below list).
- To meet the 1% rule (rent ≥ 1% of price), the offer needs to be $205k (12.9% below list).
- Recommended offer: $205k (12.9% below list) — sets the bar for 1% rule.
- Cap rate 6.0% vs local median 3.1% in Conroe — top-decile yield for the area; either an underpriced asset or a hidden risk that comps aren't pricing in. Stress-test before assuming the spread holds.
Location & tenants
- Location reads 74/100 on livability (#169 in TX, #4,447 nationally) — a middle-class / working-renter tenant base. Strengths: cost of living A+, housing A+, amenities B; Watch: commute F, health & safety F.
- Conroe ISD (other): math 57% / reading 57% proficiency, ranked #69 of 826 in TX (top 8%) — acceptable for families but not a draw, mixed tenant base, ~2y average lease.
- Zoned schools: Stewart El (math 71% / reading 60%, grade B+, #234 of 4,322 statewide, top 6%, 815 students, 11% FRL); Peet J H (math 45% / reading 50%, grade C-, #408 of 1,662 statewide, top 25%, 1,289 students, 58% FRL); Conroe H S (math 32% / reading 51%, grade F, #767 of 1,632 statewide, top 47%, 4,915 students, 61% FRL).
- Market conditions: Rents flat; 2300 active listings in the ZIP; 9 comparable units currently listed for rent nearby; rentals at typical pace (median 23d on market — plan ~3-4 weeks tenant-placement turnaround); high-income renter base; 13,259 units permitted in Montgomery County in 2024 (1,402 in 5+ unit buildings).
Forward outlook
- Local home prices are declining (-3.0%/yr); year-one equity from $2k of loan paydown is wiped out by about $7k of value loss. Plan a longer hold.
- Montgomery County population projected at +65% by 2050 — long-run rental-demand tailwind backs the buy-and-hold thesis.
Negotiation context
- It's been on market 381 days — a 12% lower offer ($207k) is reasonable based on typical stale-listing flexibility.
Questions for the listing agent
- What do current leases actually rent for vs. the listed asking? Can we see a recent rent roll and the last 12 months of T-12 income?
- It's been on market 381 days. Have you received any prior offers? Is the seller open to a 13% concession, seller financing, or rate buy-down credit?
- Why hasn't it sold? Are there any deal-killer items the seller is aware of (foundation, flood, title, zoning, code violations)?
- Is there a deadline driving the sale (1031 exchange, divorce, estate, relocation)? That informs how much negotiation room exists.
- Schools are D-rated, which usually means shorter tenancies and higher turnover. Who's the typical renter profile here, and what's been the actual vacancy rate?
- The area grade is low — what's the realistic commute time and amenity access for the typical tenant pool here? Any planned neighborhood developments (good or bad) we should know about?
- What's the average days-on-market for RENTAL listings here right now (not sales)? A rising rental-DOM trend means longer vacancies and softer asking-rent achievability than the comps imply.
- What's the recent tenant-quality profile in this submarket — average credit score on applications, eviction rate, late-payment / NSF rate, and stable-employment percentage? A property-management company in the area should have these aggregated.
- How much new for-sale + rental construction is in the pipeline within 1–3 miles? Heavy new supply typically softens prices + rents 12–24 months out; constrained supply supports both.
Investment metrics
- 1% rule
- 0.84% ✗
- Cap rate
- 6.00%
- Cash-on-cash
- -1.03%
- DSCR
- 0.95
- GRM
- 9.9
CMA / ARV
- ARV (median comp)
- $242,417
- List price
- $234,990
- Delta
- -3.06%
- Verdict
- FAIR
- Comps
- 20 within 1.0 mi
Show comp detail 12 sales within ~0.75 mi
| Address | Dist | Beds/Ba | Sqft | Sold | Price | $/sf | Match |
|---|---|---|---|---|---|---|---|
| 819 Faison Ct | 0.03mi | 3/2.5 | 1,694 (+8%) | 2mo | $220,000 | $130 | 84 |
| 14809 Archer Ct | 0.05mi | 3/2.0 | 1,418 (-10%) | 1mo | $249,990 | $176 | 79 |
| 738 Amesbury Rd | 0.09mi | 3/2.0 | 1,412 (-10%) | 1mo | $276,040 | $195 | 77 |
| 734 Amesbury Rd | 0.09mi | 3/2.0 | 1,401 (-11%) | 2mo | $271,040 | $193 | 75 |
| 15119 Willowwater Dr | 0.42mi | 4/2.0 (+1) | 1,582 (+1%) | 1mo | $247,990 | $157 | 71 |
| 571 Dalloway St | 0.22mi | 3/2.0 | 1,418 (-10%) | 2mo | $241,990 | $171 | 70 |
| 514 Dalloway St | 0.20mi | 3/2.0 | 1,396 (-11%) | 1mo | $229,500 | $164 | 70 |
| 15032 Ronan Dr | 0.34mi | 3/2.0 | 1,412 (-10%) | 2mo | $271,040 | $192 | 64 |
| 15049 Ronan Dr | 0.33mi | 3/2.0 | 1,401 (-11%) | 1mo | $269,040 | $192 | 64 |
| 668 Craven St | 0.38mi | 3/2.0 | 1,401 (-11%) | 2mo | $269,040 | $192 | 61 |
| 15203 Abella Dr | 0.45mi | 3/2.0 | 1,418 (-10%) | 1mo | $243,990 | $172 | 60 |
| 15107 Willowwater Dr | 0.43mi | 3/2.0 | 1,409 (-10%) | 2mo | $235,990 | $167 | 60 |
Match score weights: distance 35% · size 25% · config 20% · recency 20%. Top-matched comps best support the ARV.
Projected returns pro-forma
-3.0% appreciation · 0.4% rent growth · sell at horizon
- IRR
- -20.9%
- Equity multiple
- 0.29×
- Total profit
- $-48,191
- Equity at exit
- $36,145
- IRR
- -21.7%
- Equity multiple
- 0.01×
- Total profit
- $-66,958
- Equity at exit
- $20,960
Cash invested: $67,877 (down + closing). Projections, not guarantees.
Landlord ↔ Tenant lean methodology
- Overall (STATE)
- 87 Strongly Landlord-Friendly
- State Texas
- 87 Strongly Landlord-Friendly · R+5
- County
- — inherits STATE
- City
- — inherits STATE
ZIP-level market 77316
- Home prices YoY
- -10.7%
- Rents YoY
- 0.4%
- Active inventory
- 2300
- Price-to-rent
- 9.6×
Monthly cashflow live
- Estimated rent
- $2,047 high interval (Pro) →
- Mortgage (P&I)
- −$1,271
- Tax est. 1.5%
- −$303 /mo · $3,636/yr
- Insurance
- −$101
- HOA
- −$0
- Vacancy / Maint / Mgmt
- −$430
- Net cashflow
- $-58
Break-even live
Sensitivity live
| Price | -10% $109 | -5% $25 | +0% $-58 | +5% $-142 | +10% $-226 |
|---|---|---|---|---|---|
| Rent | -10% $-220 | -5% $-139 | +0% $-58 | +5% $22 | +10% $103 |
| Rate | -1.0pp $64 | -0.5pp $3 | base $-58 | +0.5pp $-121 | +1.0pp $-185 |
UW: 25.0% down · 7.5% · 30yr · 1.5% tax · 5.0% vac · 8.0% maint · 8.0% mgmt
Financing live
Cash to close
- Down payment
- $60,604
- Closing costs
- $7,273
- Reserves months
- —
- Total cash needed
- —
Loan-product check · same deal, 3 products live
Conventional
25% down · 7.5% · 30yr
- Down + closing
- —
- Monthly P&I
- —
- Monthly cashflow
- —
- DSCR
- —
- Eligible?
- —
Personal DTI + credit; lowest rate.
DSCR
20% down · 8.5% · 30yr
- Down + closing
- —
- Monthly P&I
- —
- Monthly cashflow
- —
- DSCR
- —
- Eligible?
- —
No personal income docs; deal must DSCR.
Hard money
10% down · 12.0% · 12mo
- Down + closing
- —
- Monthly P&I
- —
- Monthly cashflow
- —
- DSCR
- —
- Eligible?
- —
Short-term bridge; refi at stabilization.
Rent comps 9 comps
| Address | Beds | Baths | Sqft | Rent | $/sqft | DOM | Units | Dist |
|---|---|---|---|---|---|---|---|---|
| 583 Firemoon St Montgomery, TX | 3.0 | 2.0 | 1412 | $1,650 | $1.17 | 23d | 1 | 0.19mi |
| 632 Levine Ct Montgomery, TX | 4.0 | 2.5 | 2239 | $2,275 | $1.02 | 9d | 1 | 0.20mi |
| 613 Craven St Montgomery, TX | 3.0 | 2.0 | 1716 | $1,610 | $0.94 | 46d | 1 | 0.47mi |
| 15231 Abella Dr Montgomery, TX | 3.0 | 2.0 | 1922 | $1,760 | $0.92 | 23d | 1 | 0.49mi |
| 15242 Abella Dr Montgomery, TX | 4.0 | 2.5 | 1881 | $1,780 | $0.95 | 6d | 1 | 0.51mi |
| 15310 Abella Dr Montgomery, TX | 3.0 | 2.0 | 1412 | $1,720 | $1.22 | 4d | 1 | 0.51mi |
| 425 McCaleb Rd Montgomery, TX | 1.0–3.0 | 1.0–2.0 | 922 | $1,677 | $1.82 | 0d | 16 | 0.66mi |
| 702 Crystal River Rd Montgomery, TX | 4.0 | 2.5 | 1820 | $4,000 | $2.20 | 46d | 1 | 1.06mi |
| 2283 McCaleb Rd Montgomery, TX | 4.0 | 2.0 | 1412 | $2,050 | $1.45 | 46d | 1 | 1.33mi |
Listing history 15 events
-
2026-06-21days on market $234,990 Active 381 DOM
-
2026-06-18days on market $234,990 Active 378 DOM
-
2026-06-17days on market $234,990 Active 377 DOM
-
2026-06-16days on market $234,990 Active 376 DOM
-
2026-06-15days on market $234,990 Active 375 DOM
-
2026-06-13days on market $234,990 Active 373 DOM
-
2026-06-09days on market $234,990 Active 369 DOM
-
2026-06-08days on market $234,990 Active 368 DOM
-
2026-06-07days on market $234,990 Active 367 DOM
-
2026-06-04days on market $234,990 Active 364 DOM
-
2026-06-03days on market $234,990 Active 363 DOM
-
2026-06-02days on market $234,990 Active 362 DOM
-
2026-06-01days on market $234,990 Active 361 DOM
-
2026-05-31days on market $234,990 Active 360 DOM
-
2025-06-05$234,990 Active 430-char remark
Show marketing remark (430 chars)
This new home presents two floors designed for seamless living and comfort. At the heart of the first floor is a welcoming family room with direct access to a multifunctional kitchen, dining area and a covered rear patio. All three bedrooms are tucked upstairs for maximum privacy and center around a versatile loft for additional living space. The owner's suite is a tranquil retreat with an attached bathroom and walk-in closet.
ⓘ Source: listings_history table (triggers on properties + properties_extension) + one-shot
backfill from property_details.listing_events for pre-trigger history.
Nearby sold comps map
Loading sold comps map…
Walkable amenities ~0.75 mi
Loading nearby amenities…
Taxation est. · year 1
- Rental income
- $24,560
- − Mortgage interest
- −$13,579
- − Property taxes
- −$3,636
- − Insurance
- −$1,212
- − Repairs & maintenance
- −$1,965
- − Management
- −$1,965
- − Depreciation
- −$7,052
- Taxable loss
- −$4,849
- Est. tax savings @ 24.0%
- +$1,164
- After-tax cash flow
- $463/yr
For passive investors: Depreciation is non-cash, so a rental often shows a tax loss while cash-flowing — sheltering income. Rental losses are passive: they offset passive income freely, and up to $25,000/yr can offset ordinary (W-2) income if you actively participate and your MAGI is under $100k (phasing out to $0 by $150k); unused losses carry forward. On sale, claimed depreciation is recaptured at up to 25%, and gains may owe capital-gains tax (a 1031 exchange can defer both). Figures are a year-1 estimate at your 24.0% rate — not tax advice; consult a CPA.
Condition & rehab AI · 3 photos
This single-family home is in excellent condition with no visible repairs or maintenance needed. It offers a good investment opportunity with potential for minor updates to enhance its resale and rental value.
Value-add opportunities
- Both Painting — Fresh paint can enhance curb appeal and interior aesthetics
- Both Landscaping — Enhances curb appeal and can increase property value
- Both Interior updates — Fresh paint and minor updates can improve the home's appeal
Renovation cost estimate screening
Value-add ROI direction
- Both Painting — Fresh paint can enhance curb appeal and interior aesthetics ↑
- Both Landscaping — Enhances curb appeal and can increase property value ↑
- Both Interior updates — Fresh paint and minor updates can improve the home's appeal ↑
ⓘ Cost ranges are severity-bucket heuristics (US national rule-of-thumb). Get contractor quotes + a written scope before underwriting a rehab budget.
Schools (NCES district)
- District
- Conroe ISD
- NCES district ID
- 4815000
- Math proficiency
- 57% ▼ -6.00%
- Reading proficiency
- 57% ▼ -1.00%
- Median HH income
- $71,541
- Composite
- 50.65/100
- National rank
- #1833
- State rank
- #69 of 826 in TX
Livability — Conroe
- Score
- 74/100
- State rank
- #169
- US rank
- #4447
Category grades
Schools grade is shown separately in the Schools card above.
Census & demographics
- Census place
- Conroe, TX
- County
- Montgomery County · 663,713 people
- City population
- 205,417
- Metro
- Houston-The Woodlands-Sugar Land, TX
- Population (ZIP)
- 34,694
- Household income
- $124,055
- Rent vs Own
- Severe rent burden
- 273.0
Population outlook (Montgomery County) Hauer SSP2
- Today (2025)
- 713,896 people
- By 2030
- 805,263 · +12.8%
- By 2040
- 992,708 · +39.1%
- By 2050
- 1,179,590 · +65.2%
- By 2075
- 1,628,084 · +128.1%
- By 2100
- 1,937,880 · +171.5%
Race, ethnicity, and origin ACS 2023
- Neighborhood character
- Predominantly White (80%)
- Race & ethnicity
- White 80% Hispanic / Latino 14% Two or more races 11% Black 1% Asian 1%
- Hispanic origin (detail)
- Mexican 9%
- Common ancestry
- Lithuanian 6% Slovak 3% Romanian 3%
- Foreign-born
- 6% · Canada
- Languages at home
- 90% English-only · Spanish 8%
Political lean MEDSL · Montgomery
- 2024 margin
- Solid R (+45.5) · D 26.8% · R 72.3%
- 2008→2024 swing
- +7.2pp toward D · 2008: -52.7pp · 2024: -45.5pp
- All cycles
- 2024: R+45.5 2020: R+43.8 2016: R+51.4 2012: R+60.7 2008: R+52.7
Not yet ingested
- Civics
- —
Market trends
- HPI YoY
- ▼ -31.44%
- Current HPI
- 262.6973
- Rent YoY
- ▲ 0.40%
- Metro
- Houston-The Woodlands-Sugar Land, TX
- State GDP YoY
- ▲ 3.95%
- F500 in state
- 110
Industry mix (Fortune 500 HQ in TX)
| Industry | F500 HQs | Revenue |
|---|---|---|
| Energy | 16 | $1,198B |
|
||
| Technology | 5 | $198B |
|
||
| Engineering / Construction | 4 | $72B |
|
||
| Energy Services | 3 | $60B |
|
||
| Utilities | 3 | $41B |
|
||
| Healthcare | 2 | $330B |
|
||
Price history
1 event — show timeline
- 2025-06-05 Listed $234,990 Zillow
Cash-flow waterfall
monthlySold comps — $/sqft
last 12 mo · ≤1 miLoading sold comps…