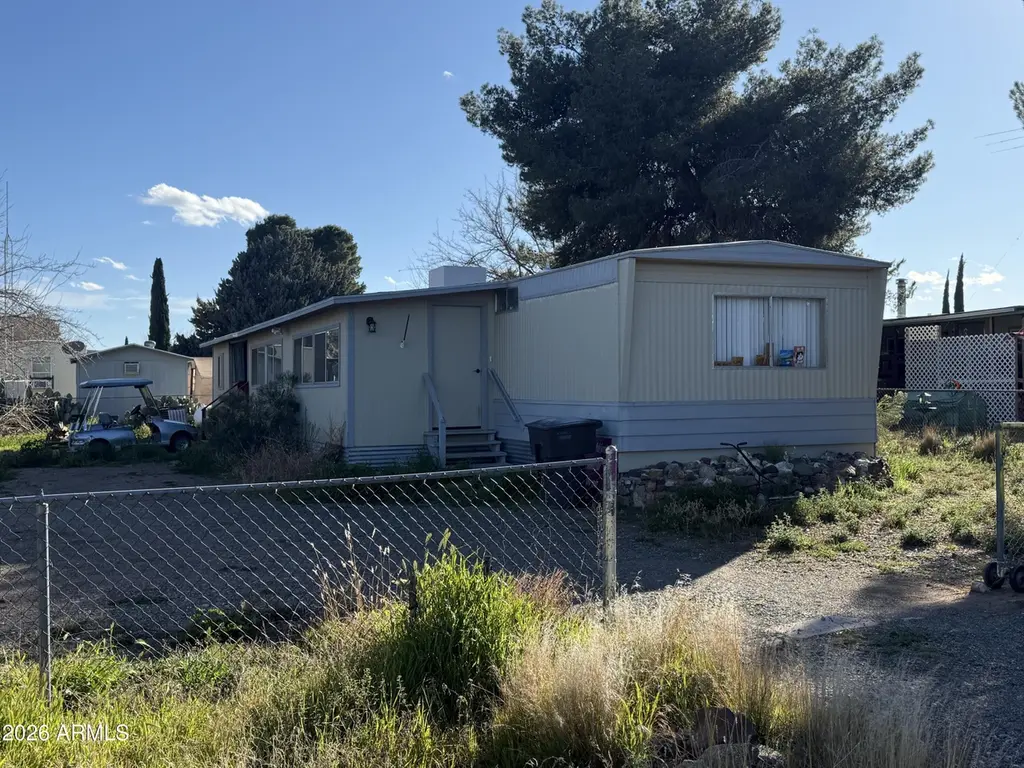
20581 E Prickly Pear Dr · Cordes Lakes, AZ
Flood risk 1/10 · Minimal
- FEMA flood zone
- X (unshaded)
- Chance of flooding over 30 yrs
- 0.0%
- Est. flood insurance / yr
- $507 – $1,088
Fire risk 6/10 · Moderate
- Est. fire insurance / yr
- $610 – $1,132
Heat risk 6/10 · Moderate
- Hot days now (above 101°F)
- 6 days/yr
- Hot days in 30 yrs
- 15 days/yr
Wind risk 1/10 · Minimal
- Chance of severe wind over 30 yrs
- —
Air-quality risk 2/10 · Minimal
- Unhealthy air days now
- 1 days/yr
- Unhealthy air days in 30 yrs
- 1 days/yr
Risk factors via First Street. Map © Google.
Why this score? — see what drove the C+ grade
The composite is a weighted blend of 9 inputs, each scored 0–100. Each bar is that input's sub-score; the figure is the points it added to the 100-point composite (weight × sub-score).
- Cash flow +20.3/30.0
- Appreciation +10.0/10.0
- ARV discount +9.1/15.0
- DSCR +6.4/10.0
- 1% rule +5.4/10.0
- Livability +3.0/5.0
- Rent growth +2.5/5.0
- Condition / age +2.5/5.0
- Schools +2.0/10.0
$179,000
🖨 Deal sheet 📄 Offer letter ✓ Due diligence
Listing remarks
Here's your chance to get your own getaway outside of Phoenix! Move North to Mayer and get your partially remodeled home situated on a 8,802 fenced lot!! Welcome Home to your little piece of Heaven! Located in the Cordes Lakes subdivision of Mayer, AZ, this property offers a spacious desert retreat with notable mountain views! This North/South facing property has no HOA with lots of room for your RV's, campers, or boats. This 1,257 square foot home has dual pane windows throughout, a newer roof, and more! Come North, escape the 115 degree heat and enjoy the cooler temperatures at 3700 elevation! Did I mention that there is no HOA? What are you waiting for? Here is your invitation to finally
Key facts
- 8,802 sq ft lot
- Built 1979
- Listed 56 days
Property features AI
Finance
- Other:
- Financial info: Non-assumable financing
- HOA & community: No association fees
Exterior
- Parking:
- Security:
- Utilities: Propane; Private water company; Septic tank (septic connected)
- Home design: Manufactured/mobile home; Fee simple ownership; Asphalt road access
- Construction: Board & batten siding with wood frame construction; Composition roof
- Exterior features: Shed(s); Grass front yard; Grass back yard; County-maintained road access
Interior
- Kitchen: Eat-in kitchen
- Bedrooms: Up to 3 bedrooms
- Flooring: Carpet; Laminate
- Bathrooms: 2 full bathrooms
- Heating & cooling: Electric heating; Window/wall cooling units
- Interior features: Eat-in kitchen; No interior steps; Master bedroom with 3/4 bath; Dual-pane windows; Storage
- Laundry & utility: Inside laundry
Neighborhood map
What this means for you Summary
Snapshot
- This is a 3-bed/2.0-bath manufactured listed at $179k.
Deal economics
- At list price, monthly cash flow is $229 ($3k/yr) — positive.
- The deal already cash-flows at list — no discount required.
- Meets the 1% rule at list price ($2k rent vs $179k).
- Recommended offer: $174k (3.0% below list) — sets the bar for market timing.
- Cap rate 7.8% vs local median 5.1% in Cordes Lakes — top-decile yield for the area; either an underpriced asset or a hidden risk that comps aren't pricing in. Stress-test before assuming the spread holds.
Location & tenants
- Location reads 60/100 on livability (#181 in AZ) — a middle-class / working-renter tenant base. Strengths: cost of living A+, housing A+, crime A-; Watch: amenities F, commute F, employment F.
- Mayer Unified School District (4473) (rural): math 23% / reading 26% proficiency, ranked #165 of 249 in AZ (top 66%) — low school quality limits family demand, transient renter base, plan for 1-2y turnover; 80% free/reduced lunch — lower-income household profile, screen leases tightly.
- Zoned schools: Mayer Elementary School (math 26% / reading 32%, grade F, #570 of 1,109 statewide, top 52%, 373 students, 93% FRL); Mayer High School (math 5% / reading 5%, grade F, #364 of 381 statewide, top 100%, 200 students, 66% FRL) — zoned schools at 79% FRL track the district average.
- Market conditions: 242 active listings in the ZIP; 2,062 units permitted in Yavapai County in 2024 (98 in 5+ unit buildings).
Forward outlook
- In year one you build about $19k of equity ($1k loan paydown + $18k appreciation (10.0% local appreciation)).
- Yavapai County population projected at +10% by 2050 — modest demand growth; plan on rents tracking national, not racing it.
- At projected returns (10.0% appreciation + 3.0% rent growth), your $50k cash investment doubles in ~3 years — after that, you're playing with house money.
- By year 2, paydown + projected appreciation supports a ~$31k cash-out refi (75% LTV) — recoverable capital for the next deal without selling this one.
Negotiation context
- It's been on market 56 days — a 3% lower offer ($174k) is reasonable based on typical stale-listing flexibility.
- Current owner paid $130k; 38% above their basis — modest negotiation headroom, anchor on the comps not their cost.
Risks & watch-outs
- Climate carrying-cost: major wildfire risk; extreme-heat days projected 6→15/yr by 2055 (HVAC capex compounding) — expect insurance premiums to compound above CPI over the hold.
Questions for the listing agent
- It's been on market 56 days. Have you received any prior offers? Is the seller open to a 3% concession, seller financing, or rate buy-down credit?
- Built in 1979 — when were the roof, HVAC, electrical panel, plumbing, and water heater last replaced?
- Is there a deadline driving the sale (1031 exchange, divorce, estate, relocation)? That informs how much negotiation room exists.
- Schools are F-rated, which usually means shorter tenancies and higher turnover. Who's the typical renter profile here, and what's been the actual vacancy rate?
- What's the average days-on-market for RENTAL listings here right now (not sales)? A rising rental-DOM trend means longer vacancies and softer asking-rent achievability than the comps imply.
- What's the recent tenant-quality profile in this submarket — average credit score on applications, eviction rate, late-payment / NSF rate, and stable-employment percentage? A property-management company in the area should have these aggregated.
- How much new for-sale + rental construction is in the pipeline within 1–3 miles? Heavy new supply typically softens prices + rents 12–24 months out; constrained supply supports both.
Investment metrics
- 1% rule
- 1.04% ✓
- Cap rate
- 7.83%
- Cash-on-cash
- 5.49%
- DSCR
- 1.24
- GRM
- 8.0
CMA / ARV
- ARV (on-the-fly)
- $185,724
- Comps found
- 12
Show comp detail 12 sales within ~0.75 mi
| Address | Dist | Beds/Ba | Sqft | Sold | Price | $/sf | Match |
|---|---|---|---|---|---|---|---|
| 20583 E Conestoga Dr | 0.15mi | 3/2.0 | 973 (+5%) | 10mo | $225,000 | $231 | 76 |
| 20659 E Sierra Dr | 0.09mi | 2/2.0 (-1) | 930 (+1%) | 17mo | $205,000 | $220 | 76 |
| 15455 S Cholla Cir | 0.12mi | 3/2.0 | 981 (+6%) | 17mo | $203,000 | $207 | 70 |
| 20570 E Larry Ln | 0.29mi | 3/2.0 | 967 (+5%) | 12mo | $85,000 | $88 | 69 |
| 15339 S Rolling Ridge Dr | 0.48mi | 3/2.0 | 887 (-4%) | 4mo | $150,000 | $169 | 68 |
| 16071 S Yavapai Dr | 0.64mi | 3/2.0 | 925 (+0%) | 5mo | $52,000 | $56 | 66 |
| 20555 E Park View Ln | 0.24mi | 2/2.0 (-1) | 840 (-9%) | 5mo | $168,900 | $201 | 64 |
| 16070 S Indian Bend Dr | 0.56mi | 2/2.0 (-1) | 898 (-3%) | 7mo | $150,000 | $167 | 59 |
| 16062 S Indian Bend Dr | 0.54mi | 2/2.0 (-1) | 925 (+0%) | 14mo | $206,000 | $223 | 58 |
| 20715 E Larry Ln | 0.36mi | 2/1.5 (-1) | 840 (-9%) | 12mo | $130,000 | $155 | 51 |
| 16029 S Apache Dr | 0.57mi | 3/2.0 | 1,061 (+15%) | 11mo | $230,000 | $217 | 39 |
| 16128 S Papago Dr | 0.69mi | 2/1.0 (-1) | 785 (-15%) | 4mo | $83,000 | $106 | 30 |
Match score weights: distance 35% · size 25% · config 20% · recency 20%. Top-matched comps best support the ARV.
Projected returns pro-forma
10.0% appreciation · 3.0% rent growth · sell at horizon
- IRR
- 28.3%
- Equity multiple
- 3.24×
- Total profit
- $112,113
- Equity at exit
- $161,257
- IRR
- 24.6%
- Equity multiple
- 7.36×
- Total profit
- $318,731
- Equity at exit
- $347,758
Cash invested: $50,120 (down + closing). Projections, not guarantees.
Landlord ↔ Tenant lean methodology
- Overall (STATE)
- 87 Strongly Landlord-Friendly
- State Arizona
- 87 Strongly Landlord-Friendly · R+3
- County
- — inherits STATE
- City
- — inherits STATE
ZIP-level market 86333
- Home prices YoY
- 17.3%
- Active inventory
- 242
- Price-to-rent
- 8.0×
Monthly cashflow live
- Estimated rent
- $1,856 medium interval (Pro) →
- Mortgage (P&I)
- −$939
- Tax est. 1.5%
- −$224 /mo · $2,685/yr
- Insurance
- −$75
- HOA
- −$0
- Vacancy / Maint / Mgmt
- −$390
- Net cashflow
- $229
Break-even live
UW: 25.0% down · 7.5% · 30yr · 1.5% tax · 5.0% vac · 8.0% maint · 8.0% mgmt
Financing live
Cash to close
- Down payment
- $44,750
- Closing costs
- $5,370
- Reserves months
- —
- Total cash needed
- —
Loan-product check · same deal, 3 products live
Conventional
25% down · 7.5% · 30yr
- Down + closing
- —
- Monthly P&I
- —
- Monthly cashflow
- —
- DSCR
- —
- Eligible?
- —
Personal DTI + credit; lowest rate.
DSCR
20% down · 8.5% · 30yr
- Down + closing
- —
- Monthly P&I
- —
- Monthly cashflow
- —
- DSCR
- —
- Eligible?
- —
No personal income docs; deal must DSCR.
Hard money
10% down · 12.0% · 12mo
- Down + closing
- —
- Monthly P&I
- —
- Monthly cashflow
- —
- DSCR
- —
- Eligible?
- —
Short-term bridge; refi at stabilization.
Listing history 18 events
-
2026-06-18days on market $179,000 Active 56 DOM
-
2026-06-17days on market $179,000 Active 55 DOM
-
2026-06-16days on market $179,000 Active 54 DOM
-
2026-06-15days on market $179,000 Active 53 DOM
-
2026-06-14days on market $179,000 Active 51 DOM
-
2026-06-13days on market $179,000 Active 50 DOM
-
2026-06-10days on market $179,000 Active 48 DOM
-
2026-06-09days on market $179,000 Active 47 DOM
-
2026-06-08days on market $179,000 Active 46 DOM
-
2026-06-07days on market $179,000 Active 45 DOM
-
2026-06-03days on market $179,000 Active 41 DOM
-
2026-06-02days on market $179,000 Active 40 DOM
-
2026-06-01days on market $179,000 Active 39 DOM
-
2026-05-31days on market $179,000 Active 38 DOM
-
2026-05-30days on market $179,000 Active 37 DOM
-
2026-04-23$179,000 Active
-
2021-12-23soldstatus $130,000
-
1998-03-18soldstatus $39,000
ⓘ Source: listings_history table (triggers on properties + properties_extension) + one-shot
backfill from property_details.listing_events for pre-trigger history.
Climate risk First Street
- Flood 1/10 Low FEMA zone X (unshaded) · 0% chance over 30 yrs
- Wildfire 6/10 Major
- Heat 6/10 Major 6 d/yr ≥101°F today · 15 d/yr by 30 yrs out
- Wind 1/10 Low
- Air quality 2/10 Low 1 unhealthy d/yr today · 1 by 30 yrs out
Nearby sold comps map
Loading sold comps map…
Walkable amenities ~0.75 mi
Loading nearby amenities…
Taxation est. · year 1
- Rental income
- $22,272
- − Mortgage interest
- −$10,027
- − Property taxes
- −$2,685
- − Insurance
- −$895
- − Repairs & maintenance
- −$1,782
- − Management
- −$1,782
- − Depreciation
- −$5,207
- Taxable loss
- −$106
- Est. tax savings @ 24.0%
- +$25
- After-tax cash flow
- $2,776/yr
For passive investors: Depreciation is non-cash, so a rental often shows a tax loss while cash-flowing — sheltering income. Rental losses are passive: they offset passive income freely, and up to $25,000/yr can offset ordinary (W-2) income if you actively participate and your MAGI is under $100k (phasing out to $0 by $150k); unused losses carry forward. On sale, claimed depreciation is recaptured at up to 25%, and gains may owe capital-gains tax (a 1031 exchange can defer both). Figures are a year-1 estimate at your 24.0% rate — not tax advice; consult a CPA.
Schools (NCES district)
- District
- Mayer Unified School District (4473)
- NCES district ID
- 0404820
- Math proficiency
- 23% ▼ -11.00%
- Reading proficiency
- 26% ▼ -13.00%
- Median HH income
- $35,108
- Composite
- 20.22/100
- National rank
- #8627
- State rank
- #165 of 249 in AZ
Livability — Cordes Lakes
- Score
- 60/100
- State rank
- #181
- US rank
- #19144
Category grades
Schools grade is shown separately in the Schools card above.
Census & demographics
- Census place
- Cordes Lakes, AZ
- Population (ZIP)
- 6,425
Population outlook (Yavapai County) Hauer SSP2
- Today (2025)
- 241,389 people
- By 2030
- 249,523 · +3.4%
- By 2040
- 259,966 · +7.7%
- By 2050
- 264,736 · +9.7%
- By 2075
- 269,334 · +11.6%
- By 2100
- 256,505 · +6.3%
Race, ethnicity, and origin ACS 2023
- Neighborhood character
- Predominantly White (77%)
- Race & ethnicity
- White 77% Two or more races 15% Hispanic / Latino 14%
- Hispanic origin (detail)
- Mexican 11% Puerto Rican 1%
- Common ancestry
- Lithuanian 6% Iranian 3% Romanian 3%
- Foreign-born
- 5% · Canada
- Languages at home
- 93% English-only · Spanish 6% Russian/Polish/Slavic 1%
Political lean MEDSL · Yavapai
- 2024 margin
- Solid R (+33.9) · D 32.6% · R 66.5%
- 2008→2024 swing
- -9.5pp toward R · 2008: -24.4pp · 2024: -33.9pp
- All cycles
- 2024: R+33.9 2020: R+29.3 2016: R+31.4 2012: R+30.7 2008: R+24.4
Not yet ingested
- Civics
- —
Market trends
- HPI YoY
- ▲ 55.51%
- Current HPI
- 376.0374
- Rent YoY
- —
- Metro
- —
- State GDP YoY
- ▲ 4.54%
- F500 in state
- 20
Industry mix (Fortune 500 HQ in AZ)
| Industry | F500 HQs | Revenue |
|---|---|---|
| Technology | 2 | $13B |
|
||
| Mining / Metals | 1 | $23B |
|
||
| Environmental Services | 1 | $16B |
|
||
| Metals / Steel | 1 | $14B |
|
||
| Technology Distribution | 1 | $9B |
|
||
| Homebuilding | 1 | $8B |
|
||
Price history
+359.0% since first listed3 events — show timeline
- 2026-04-23 Listed $179,000 ARMLS
- 2021-12-23 Sold (Public Records) $130,000 Public Records
- 1998-03-18 Sold (Public Records) $39,000 Public Records
Property tax history
+1.2%/yrLatest (2025): $312 · +6.7% YoY. Source: county tax records.
Cash-flow waterfall
monthlySold comps — $/sqft
last 12 mo · ≤1 miLoading sold comps…