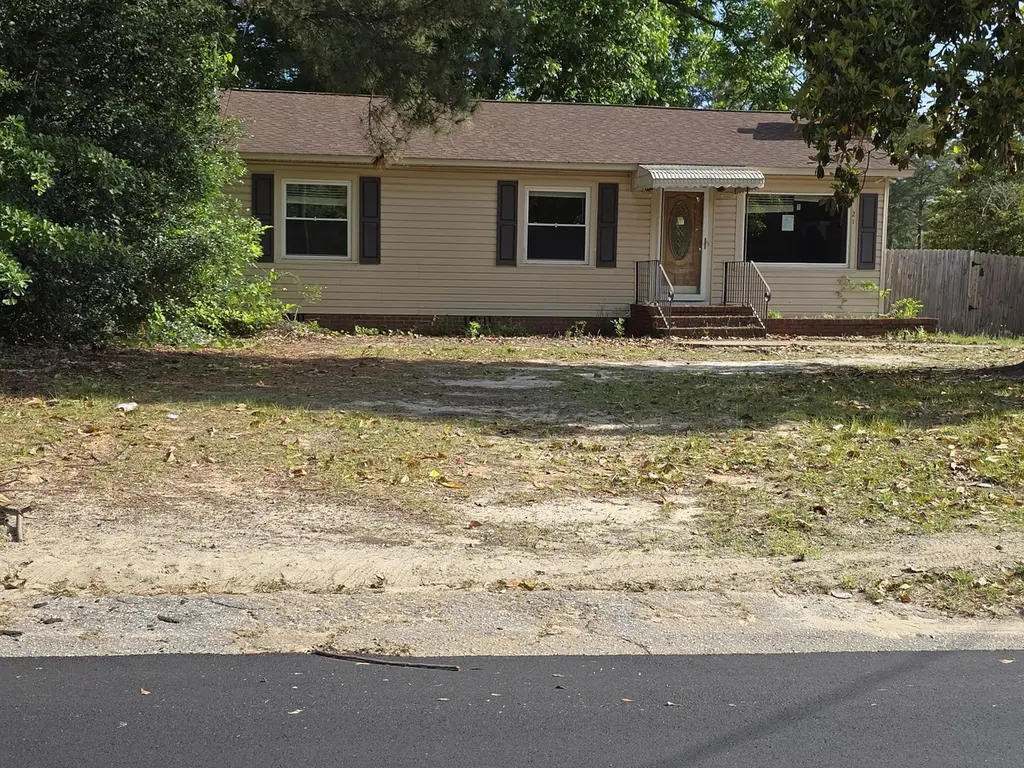
21 Vernon Dr · South Sumter, SC
Flood risk 1/10 · Minimal
- FEMA flood zone
- X (unshaded)
- Chance of flooding over 30 yrs
- 0.0%
- Est. flood insurance / yr
- $507 – $1,088
Fire risk 5/10 · Moderate
- Est. fire insurance / yr
- $783 – $1,453
Heat risk 7/10 · Major
- Hot days now (above 108°F)
- 7 days/yr
- Hot days in 30 yrs
- 16 days/yr
Wind risk 8/10 · Major
- Chance of severe wind over 30 yrs
- 80.0%
Air-quality risk 2/10 · Minimal
- Unhealthy air days now
- 2 days/yr
- Unhealthy air days in 30 yrs
- 2 days/yr
Risk factors via First Street. Map © Google.
Why this score? — see what drove the F grade
The composite is a weighted blend of 9 inputs, each scored 0–100. Each bar is that input's sub-score; the figure is the points it added to the 100-point composite (weight × sub-score).
- Cash flow +12.3/30.0
- DSCR +3.6/10.0
- 1% rule +3.1/10.0
- Rent growth +3.1/5.0
- Livability +2.8/5.0
- Condition / age +2.5/5.0
- Schools +1.9/10.0
- ARV discount +0.0/15.0
- Appreciation +0.0/10.0
$167,000
🖨 Deal sheet (PDF) 📄 Offer letter ✓ Due diligence
Listing remarks MLS
This newly renovated family home is nestled off of a quiet road and makes for a great starter home! Home has a new roof, new windows, freshly painted interior, laminate hardwood floors, eat-in kitchen. Home also has a bonus room that can serve as an extra bedroom or a family room. Home has a large spacious fenced in backyard, a carport and a big workshop building! MUST SEE TO APPRECIATE!!!!
Key facts
- Close to school
- Fenced yard
- Carport
Tags
Property features AI
Exterior
- Parking: 2 total parking spaces; Detached carport (2 carport spaces)
- Security: Smoke detector(s)
- Utilities: Public water; Public sewer; Electricity available; Cable available; Water available
- Home design: Single family residence; One level (single story); House
- Construction: Asbestos and aluminum siding exterior materials; Shingle (asphalt) roof; Crawl space foundation; Built with other construction materials
- Exterior features: Patio/porch (other); Privacy wood fencing; Shed(s)
Interior
- Kitchen: Range; Refrigerator; Exhaust fan
- Bedrooms: Total of 8 rooms (bedrooms included)
- Flooring: Vinyl; Other
- Bathrooms: 3 full bathrooms
- Heating & cooling: Heat pump for heating and cooling
- Interior features: Eat-in kitchen; Blinds; Fireplace with gas log
- Laundry & utility: Washer hookup; Electric dryer hookup; Dryer; Washer
Neighborhood map
What this means for you Summary
Snapshot
- This is a 2-bed/3.0-bath single-family listed at $167k.
Deal economics
- At list price, monthly cash flow is $-32 ($-380/yr) — negative.
- To cash-flow at today's rent, offer at most $161k (3.4% below list).
- To meet the 1% rule (rent ≥ 1% of price), the offer needs to be $134k (19.5% below list).
- Recommended offer: $134k (19.5% below list) — sets the bar for 1% rule.
Location & tenants
- Location reads 55/100 on livability (#313 in SC) — a working-class tenant base; expect higher turnover. Strengths: cost of living A+, housing A+, crime B; Watch: amenities F, commute F, employment F.
- Sumter 01 (urban): math 18% / reading 28% proficiency, ranked #64 of 80 in SC (top 80%) — low school quality limits family demand, transient renter base, plan for 1-2y turnover; 64% free/reduced lunch — lower-income household profile, screen leases tightly.
- Zoned schools: Kingsbury Elementary (math 22% / reading 22%, grade F, #475 of 597 statewide, top 81%, 612 students, 100% FRL); Bates Middle (math 9% / reading 21%, grade F, #202 of 229 statewide, top 89%, 569 students, 100% FRL); Sumter High School (math 22% / reading 67%, grade F, #166 of 196 statewide, top 87%, 2,289 students, 100% FRL) — zoned schools average 100% FRL vs 64% district-wide (36 pts higher); higher-poverty schools than district average — tighter screening recommended.
- Market conditions: Rents rising (+2.5%/yr); 376 active listings in the ZIP; 386 units permitted in Sumter County in 2024 (0 in 5+ unit buildings).
- This rent runs 32% of the median local income ($51k/yr) — at the standard rent-burdened threshold; future hikes will face affordability resistance.
Forward outlook
- Local home prices are declining (-3.0%/yr); year-one equity from $1k of loan paydown is wiped out by about $5k of value loss. Plan a longer hold.
- Sumter County population projected at -14% by 2050 — secular population decline; favor cash flow + early exit over multi-decade hold.
Negotiation context
- It's been on market 19 days — a 2% lower offer ($164k) is reasonable based on typical stale-listing flexibility.
- 3 sale attempts since 9y ago with the ask held roughly flat each time — persistent listings suggest the price (not the market) is what's stuck; bring a comps-based counter.
- Current owner paid $90k; list at $167k implies a 87% gain — meaningful room to come down on a strong offer.
Risks & watch-outs
- Watch-outs: built in 1956 — expect roof / HVAC / electrical / plumbing capex.
- Climate carrying-cost: severe wind risk, 80% chance of damaging wind over 30y; moderate wildfire risk; extreme-heat days projected 7→16/yr by 2055 (HVAC capex compounding) — expect insurance premiums to compound above CPI over the hold.
Questions for the listing agent
- What do current leases actually rent for vs. the listed asking? Can we see a recent rent roll and the last 12 months of T-12 income?
- Built in 1956 — when were the roof, HVAC, electrical panel, plumbing, and water heater last replaced?
- Is there a deadline driving the sale (1031 exchange, divorce, estate, relocation)? That informs how much negotiation room exists.
- Schools are F-rated, which usually means shorter tenancies and higher turnover. Who's the typical renter profile here, and what's been the actual vacancy rate?
- The area grade is low — what's the realistic commute time and amenity access for the typical tenant pool here? Any planned neighborhood developments (good or bad) we should know about?
- What's the average days-on-market for RENTAL listings here right now (not sales)? A rising rental-DOM trend means longer vacancies and softer asking-rent achievability than the comps imply.
- What's the recent tenant-quality profile in this submarket — average credit score on applications, eviction rate, late-payment / NSF rate, and stable-employment percentage? A property-management company in the area should have these aggregated.
- How much new for-sale + rental construction is in the pipeline within 1–3 miles? Heavy new supply typically softens prices + rents 12–24 months out; constrained supply supports both.
Investment metrics
- 1% rule
- 0.81% ✗
- Cap rate
- 6.07%
- Cash-on-cash
- -0.81%
- DSCR
- 0.96
- GRM
- 10.3
CMA / ARV
- ARV (on-the-fly)
- $138,460
- Comps found
- 2
Show comp detail 2 sales within ~0.75 mi
| Address | Dist | Beds/Ba | Sqft | Sold | Price | $/sf | Match |
|---|---|---|---|---|---|---|---|
| 1234 Ivey St | 0.30mi | 3/1.5 (+1) | 1,721 (+14%) | 1mo | $159,000 | $92 | 51 |
| 110 Vernon Dr | 0.12mi | 3/1.0 (+1) | 1,360 (-10%) | 23mo | $28,000 | $21 | 46 |
Match score weights: distance 35% · size 25% · config 20% · recency 20%. Top-matched comps best support the ARV.
Projected returns pro-forma
-3.0% appreciation · 2.55% rent growth · sell at horizon
- IRR
- -18.1%
- Equity multiple
- 0.36×
- Total profit
- $-29,701
- Equity at exit
- $24,900
- IRR
- -11.3%
- Equity multiple
- 0.34×
- Total profit
- $-30,993
- Equity at exit
- $14,439
Cash invested: $46,760 (down + closing). Projections, not guarantees.
Landlord ↔ Tenant lean methodology
- Overall (STATE)
- 90 Strongly Landlord-Friendly
- State South Carolina
- 90 Strongly Landlord-Friendly · R+6
- County
- — inherits STATE
- City
- — inherits STATE
ZIP-level market 29150
- Rents YoY
- 2.5%
- Active inventory
- 376
- Price-to-rent
- 10.3×
Monthly cashflow live
- Estimated rent
- $1,345 medium interval (Pro) →
- Mortgage (P&I)
- −$876
- Tax from tax record
- −$149 /mo · $1,785/yr
- Insurance
- −$70
- HOA
- −$0
- Vacancy / Maint / Mgmt
- −$282
- Net cashflow
- $-32
Break-even live
Sensitivity live
| Price | -10% $63 | -5% $16 | +0% $-32 | +5% $-79 | +10% $-126 |
|---|---|---|---|---|---|
| Rent | -10% $-138 | -5% $-85 | +0% $-32 | +5% $21 | +10% $75 |
| Rate | -1.0pp $52 | -0.5pp $11 | base $-32 | +0.5pp $-75 | +1.0pp $-119 |
UW: 25.0% down · 7.5% · 30yr · 1.5% tax · 5.0% vac · 8.0% maint · 8.0% mgmt
Financing live
Cash to close
- Down payment
- $41,750
- Closing costs
- $5,010
- Reserves months
- —
- Total cash needed
- —
Loan-product check · same deal, 3 products live
Conventional
25% down · 7.5% · 30yr
- Down + closing
- —
- Monthly P&I
- —
- Monthly cashflow
- —
- DSCR
- —
- Eligible?
- —
Personal DTI + credit; lowest rate.
DSCR
20% down · 8.5% · 30yr
- Down + closing
- —
- Monthly P&I
- —
- Monthly cashflow
- —
- DSCR
- —
- Eligible?
- —
No personal income docs; deal must DSCR.
Hard money
10% down · 12.0% · 12mo
- Down + closing
- —
- Monthly P&I
- —
- Monthly cashflow
- —
- DSCR
- —
- Eligible?
- —
Short-term bridge; refi at stabilization.
Listing history 14 events
-
2026-06-19days on market $167,000 Active 19 DOM
-
2026-06-18days on market $167,000 Active 18 DOM
-
2026-06-17days on market $167,000 Active 17 DOM
-
2026-06-16days on market $167,000 Active 16 DOM
-
2026-06-15days on market $167,000 Active 15 DOM
-
2026-06-14days on market $167,000 Active 13 DOM
-
2026-06-13days on market $167,000 Active 12 DOM
-
2026-06-10days on market $167,000 Active 10 DOM
-
2026-06-09days on market $167,000 Active 9 DOM
-
2026-06-08days on market $167,000 Active 8 DOM
-
2026-06-07days on market $167,000 Active 7 DOM
-
2026-06-02days on market $167,000 Active 2 DOM
-
2026-05-31remarks 421-char remark
-
2026-05-31$167,000 Active 1 DOM
ⓘ Source: listings_history table (triggers on properties + properties_extension) + one-shot
backfill from property_details.listing_events for pre-trigger history.
Tax reassessment forecast SC · Resets to sale price
- Current annual tax
- $1,785 · $149/mo
- Projected year-2 tax
- $1,785 · $149/mo
- Expected delta
- $0/yr ($0/mo · 0.0%)
ⓘ Screening estimate from a state-policy table — verify with the county assessor before closing.
Climate risk First Street
- Flood 1/10 Low FEMA zone X (unshaded) · 0% chance over 30 yrs
- Wildfire 5/10 Major
- Heat 7/10 Severe 7 d/yr ≥108°F today · 16 d/yr by 30 yrs out
- Wind 8/10 Severe 80% chance of damaging wind over 30 yrs
- Air quality 2/10 Low 2 unhealthy d/yr today · 2 by 30 yrs out
Nearby sold comps map
Loading sold comps map…
Walkable amenities ~0.75 mi
Loading nearby amenities…
Taxation est. · year 1
- Rental income
- $16,138
- − Mortgage interest
- −$9,355
- − Property taxes
- −$1,785
- − Insurance
- −$835
- − Repairs & maintenance
- −$1,291
- − Management
- −$1,291
- − Depreciation
- −$4,858
- Taxable loss
- −$3,277
- Est. tax savings @ 24.0%
- +$786
- After-tax cash flow
- $406/yr
For passive investors: Depreciation is non-cash, so a rental often shows a tax loss while cash-flowing — sheltering income. Rental losses are passive: they offset passive income freely, and up to $25,000/yr can offset ordinary (W-2) income if you actively participate and your MAGI is under $100k (phasing out to $0 by $150k); unused losses carry forward. On sale, claimed depreciation is recaptured at up to 25%, and gains may owe capital-gains tax (a 1031 exchange can defer both). Figures are a year-1 estimate at your 24.0% rate — not tax advice; consult a CPA.
Schools (NCES district)
- District
- Sumter 01
- NCES district ID
- 4503902
- Math proficiency
- 18% ▼ -13.00%
- Reading proficiency
- 28% ▼ -6.00%
- Median HH income
- $40,423
- Composite
- 19.45/100
- National rank
- #8775
- State rank
- #64 of 80 in SC
Livability — South Sumter
- Score
- 55/100
- State rank
- #313
- US rank
- #23603
Category grades
Schools grade is shown separately in the Schools card above.
Census & demographics
- Census place
- South Sumter, SC
- County
- Sumter County · 76,912 people
- Metro
- Sumter, SC
- Population (ZIP)
- 38,538
- Household income
- $50,965
- Rent vs Own
- Severe rent burden
- 1136.0
Population outlook (Sumter County) Hauer SSP2
- Today (2025)
- 104,585 people
- By 2030
- 102,282 · -2.2%
- By 2040
- 96,258 · -8.0%
- By 2050
- 89,592 · -14.3%
- By 2075
- 74,715 · -28.6%
- By 2100
- 60,235 · -42.4%
Race, ethnicity, and origin ACS 2023
- Neighborhood character
- Diverse neighborhood (Simpson 0.60)
- Race & ethnicity
- Black 50% White 39% Hispanic / Latino 5% Two or more races 4% Asian 2%
- Hispanic origin (detail)
- Mexican 3% Puerto Rican 1%
- Common ancestry
- Slovak 2% Lithuanian 1% Italian 1%
- Foreign-born
- 4% · Canada, China, Vietnam
- Languages at home
- 93% English-only · Spanish 4% Other Indo-European 1% German/W. Germanic 1%
Political lean MEDSL · Sumter
- 2024 margin
- Toss-up / Even · D 51.9% · R 47.0% · Other 1.2%
- 2008→2024 swing
- -10.6pp toward R · 2008: 15.4pp · 2024: 4.9pp
- All cycles
- 2024: D+4.9 2020: D+13.0 2016: D+12.0 2012: D+17.5 2008: D+15.4
Not yet ingested
- Civics
- —
Market trends
- HPI YoY
- ▼ -100.16%
- Current HPI
- 129.032
- Rent YoY
- ▲ 2.55%
- Metro
- Sumter, SC
- State GDP YoY
- ▲ 4.51%
- F500 in state
- 2
Industry mix (Fortune 500 HQ in SC)
| Industry | F500 HQs | Revenue |
|---|---|---|
| Packaging | 1 | $7B |
|
||
Price history
+793.0% since first listed6 events — show timeline
- 2026-05-29 Listed $167,000 SBOR
- 2018-12-13 Sold (Public Records) $89,500 Public Records
- 2018-12-10 Sold (MLS) $89,500 SBOR
- 2018-07-14 Listed $89,500 SBOR
- 2018-02-12 Sold (MLS) $17,500 SBOR
- 2017-12-11 Listed $18,700 SBOR
Property tax history
+3.8%/yrLatest (2025): $1,785 · +1.0% YoY. Source: county tax records.
Cash-flow waterfall
monthlySold comps — $/sqft
last 12 mo · ≤1 miLoading sold comps…