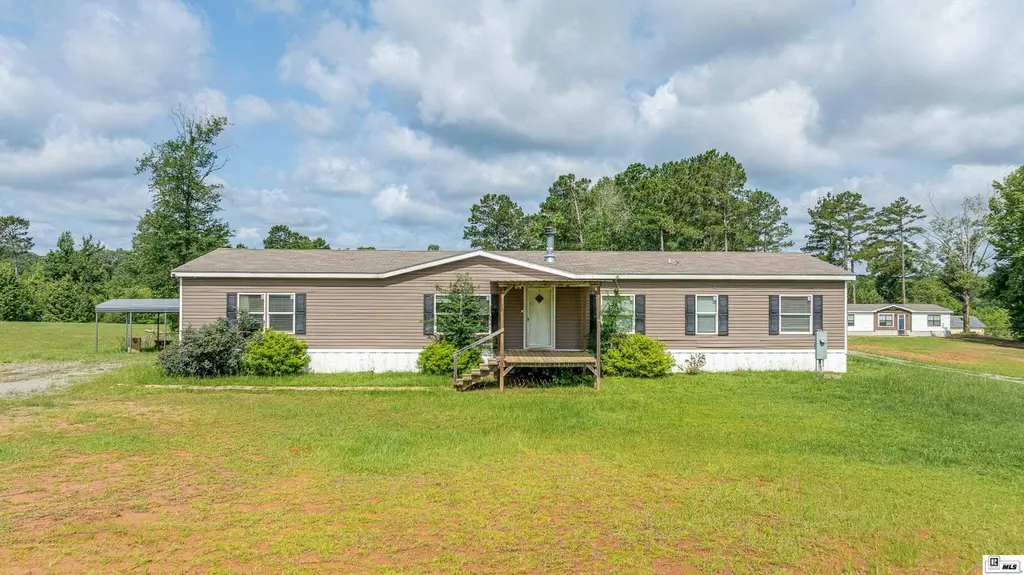
193 Showhorse Ln · Calhoun, LA
Flood risk No data
- FEMA flood zone
- —
- Chance of flooding over 30 yrs
- —
- Est. flood insurance / yr
- —
Fire risk No data
- Est. fire insurance / yr
- —
Heat risk No data
- Hot days now (above threshold)
- —
- Hot days in 30 yrs
- —
Wind risk No data
- Chance of severe wind over 30 yrs
- —
Air-quality risk No data
- Unhealthy air days now
- —
- Unhealthy air days in 30 yrs
- —
Risk factors via First Street. Map © Google.
Why this score? — see what drove the F grade
The composite is a weighted blend of 9 inputs, each scored 0–100. Each bar is that input's sub-score; the figure is the points it added to the 100-point composite (weight × sub-score).
- Cash flow +12.8/30.0
- DSCR +3.8/10.0
- Livability +3.8/5.0
- Schools +3.2/10.0
- 1% rule +2.8/10.0
- ARV discount +2.5/15.0
- Rent growth +2.5/5.0
- Condition / age +2.5/5.0
- Appreciation +0.0/10.0
$219,900
🖨 Deal sheet 📄 Offer letter ✓ Due diligence
Listing remarks
Welcome to your private country retreat! Nestled on 4.98 beautiful acres, this spacious 4 bedroom, 2 bath home offers comfort and charm. Step inside to an inviting open floor plan featuring a cozy wood-burning fireplace, creating the perfect gathering space for family and friends. The large kitchen is a standout feature, boasting a custom-built oversized island, abundant cabinet storage, and plenty of room for entertaining or everyday living. The spacious primary suite includes a luxurious master bathroom with a relaxing soaker tub, separate shower, and ample space to unwind. Outside, the possibilities are endless. Livestock is welcome, and the property is already equipped for your animals
Key facts
- Open floor plan
- Seven horse stalls
- 4.98 acre lot
Tags
Property features AI
Finance
- Other: Approximately 4.98 acres; Unimproved road surface and frontage
- HOA & community: No association amenities
Exterior
- Parking: Open parking with gravel surface
- Utilities: Public water; Septic tank; Natural gas not available
- Home design: Manufactured home (residential); One level, entry level 1; Facing/entry orientation not specified
- Construction: Vinyl siding; Asphalt roof; Pillar/post/pier foundation; Built year not specified
- Exterior features: Covered patio/porch; Wire fencing; Landscaped, cleared, irregular lot; Barn(s) and outbuilding(s)
Interior
- Kitchen: Dishwasher; Range hood; Electric range; Electric water heater
- Bedrooms: 4 main-level bedrooms
- Bathrooms: 2 full bathrooms (both on the main level)
- Heating & cooling: Central electric heating; Central air conditioning; Ceiling fans
- Interior features: Ceiling fans; Double pane windows; Living room fireplace (1)
Neighborhood map
What this means for you Summary
Snapshot
- This is a 4-bed/2.0-bath manufactured listed at $220k.
Deal economics
- At list price, monthly cash flow is $-21 ($-256/yr) — negative.
- To cash-flow at today's rent, offer at most $216k (1.7% below list).
- To meet the 1% rule (rent ≥ 1% of price), the offer needs to be $173k (21.5% below list).
- Recommended offer: $173k (21.5% below list) — sets the bar for 1% rule.
- Cap rate 6.2% vs local median 4.2% in Calhoun — top-decile yield for the area; either an underpriced asset or a hidden risk that comps aren't pricing in. Stress-test before assuming the spread holds.
Location & tenants
- Location reads 75/100 on livability (#22 in LA, #4,072 nationally) — a middle-class / working-renter tenant base. Strengths: employment A+, housing A+, crime A-; Watch: health & safety D, amenities F, commute F.
- Ouachita Parish (suburban): math 31% / reading 45% proficiency, ranked #26 of 98 in LA (top 26%) — families likely to look elsewhere, expect single-tenant / working-renter base with shorter leases.
- Zoned schools: West Ouachita High School (math 36% / reading 47%, grade F, #71 of 265 statewide, top 27%, 1,080 students, 54% FRL) — zoned schools at 54% FRL track the district average.
- Market conditions: 87 active listings in the ZIP; 345 units permitted in Ouachita Parish in 2024 (0 in 5+ unit buildings).
Forward outlook
- Local home prices are declining (-3.0%/yr); year-one equity from $2k of loan paydown is wiped out by about $7k of value loss. Plan a longer hold.
Negotiation context
- Only 8 days on market — expect competitive offers; lowballing is unlikely to land.
- 3 sale attempts since 9y ago with the ask held roughly flat each time — persistent listings suggest the price (not the market) is what's stuck; bring a comps-based counter.
Questions for the listing agent
- What do current leases actually rent for vs. the listed asking? Can we see a recent rent roll and the last 12 months of T-12 income?
- Is there a deadline driving the sale (1031 exchange, divorce, estate, relocation)? That informs how much negotiation room exists.
- Schools are B-rated — typically a magnet for longer-tenancy family renters. What's the average tenant stay here, and is there a school-zone premium baked into asking?
- The area grade is low — what's the realistic commute time and amenity access for the typical tenant pool here? Any planned neighborhood developments (good or bad) we should know about?
- What's the average days-on-market for RENTAL listings here right now (not sales)? A rising rental-DOM trend means longer vacancies and softer asking-rent achievability than the comps imply.
- What's the recent tenant-quality profile in this submarket — average credit score on applications, eviction rate, late-payment / NSF rate, and stable-employment percentage? A property-management company in the area should have these aggregated.
- How much new for-sale + rental construction is in the pipeline within 1–3 miles? Heavy new supply typically softens prices + rents 12–24 months out; constrained supply supports both.
Investment metrics
- 1% rule
- 0.78% ✗
- Cap rate
- 6.18%
- Cash-on-cash
- -0.42%
- DSCR
- 0.98
- GRM
- 10.6
CMA / ARV
- ARV (on-the-fly)
- $197,904
- Comps found
- 1
Show comp detail 1 sale within ~0.75 mi
| Address | Dist | Beds/Ba | Sqft | Sold | Price | $/sf | Match |
|---|---|---|---|---|---|---|---|
| 224 Sarah Ln | 0.25mi | 4/3.0 | 2,301 (+8%) | 18mo | $215,000 | $93 | 56 |
Match score weights: distance 35% · size 25% · config 20% · recency 20%. Top-matched comps best support the ARV.
Projected returns pro-forma
-3.0% appreciation · 3.0% rent growth · sell at horizon
- IRR
- -17.0%
- Equity multiple
- 0.40×
- Total profit
- $-37,050
- Equity at exit
- $32,788
- IRR
- -9.0%
- Equity multiple
- 0.44×
- Total profit
- $-34,246
- Equity at exit
- $19,013
Cash invested: $61,572 (down + closing). Projections, not guarantees.
Landlord ↔ Tenant lean methodology
- Overall (STATE)
- 90 Strongly Landlord-Friendly
- State Louisiana
- 90 Strongly Landlord-Friendly · R+12
- County
- — inherits STATE
- City
- — inherits STATE
ZIP-level market 71225
- Home prices YoY
- -21.2%
- Active inventory
- 87
- Price-to-rent
- 10.6×
Monthly cashflow live
- Estimated rent
- $1,725 medium interval (Pro) →
- Mortgage (P&I)
- −$1,153
- Tax from tax record
- −$140 /mo · $1,675/yr
- Insurance
- −$92
- HOA
- −$0
- Vacancy / Maint / Mgmt
- −$362
- Net cashflow
- $-21
Break-even live
UW: 25.0% down · 7.5% · 30yr · 1.5% tax · 5.0% vac · 8.0% maint · 8.0% mgmt
Financing live
Cash to close
- Down payment
- $54,975
- Closing costs
- $6,597
- Reserves months
- —
- Total cash needed
- —
Loan-product check · same deal, 3 products live
Conventional
25% down · 7.5% · 30yr
- Down + closing
- —
- Monthly P&I
- —
- Monthly cashflow
- —
- DSCR
- —
- Eligible?
- —
Personal DTI + credit; lowest rate.
DSCR
20% down · 8.5% · 30yr
- Down + closing
- —
- Monthly P&I
- —
- Monthly cashflow
- —
- DSCR
- —
- Eligible?
- —
No personal income docs; deal must DSCR.
Hard money
10% down · 12.0% · 12mo
- Down + closing
- —
- Monthly P&I
- —
- Monthly cashflow
- —
- DSCR
- —
- Eligible?
- —
Short-term bridge; refi at stabilization.
Listing history 7 events
-
2026-06-13status $219,900 Pending 8 DOM
-
2026-06-10days on market $219,900 Active 8 DOM
-
2026-06-09days on market $219,900 Active 7 DOM
-
2026-06-08days on market $219,900 Active 6 DOM
-
2026-06-07days on market $219,900 Active 5 DOM
-
2026-06-03remarks 699-char remark
-
2026-06-03$219,900 Active 1 DOM
ⓘ Source: listings_history table (triggers on properties + properties_extension) + one-shot
backfill from property_details.listing_events for pre-trigger history.
Tax reassessment forecast LA · Resets to sale price
- Current annual tax
- $1,675 · $140/mo
- Projected year-2 tax
- $1,675 · $140/mo
- Expected delta
- $0/yr ($0/mo · 0.0%)
ⓘ Screening estimate from a state-policy table — verify with the county assessor before closing.
Nearby sold comps map
Loading sold comps map…
Walkable amenities ~0.75 mi
Loading nearby amenities…
Taxation est. · year 1
- Rental income
- $20,704
- − Mortgage interest
- −$12,318
- − Property taxes
- −$1,675
- − Insurance
- −$1,100
- − Repairs & maintenance
- −$1,656
- − Management
- −$1,656
- − Depreciation
- −$6,397
- Taxable loss
- −$4,098
- Est. tax savings @ 24.0%
- +$983
- After-tax cash flow
- $727/yr
For passive investors: Depreciation is non-cash, so a rental often shows a tax loss while cash-flowing — sheltering income. Rental losses are passive: they offset passive income freely, and up to $25,000/yr can offset ordinary (W-2) income if you actively participate and your MAGI is under $100k (phasing out to $0 by $150k); unused losses carry forward. On sale, claimed depreciation is recaptured at up to 25%, and gains may owe capital-gains tax (a 1031 exchange can defer both). Figures are a year-1 estimate at your 24.0% rate — not tax advice; consult a CPA.
Schools (NCES district)
- District
- Ouachita Parish
- NCES district ID
- 2201200
- Math proficiency
- 31% ▼ -38.00%
- Reading proficiency
- 45% ▼ -31.00%
- Median HH income
- $43,316
- Composite
- 32.14/100
- National rank
- #5791
- State rank
- #26 of 98 in LA
Livability — Calhoun
- Score
- 75/100
- State rank
- #22
- US rank
- #4072
Category grades
Schools grade is shown separately in the Schools card above.
Census & demographics
- Population (ZIP)
- 7,450
Population outlook (Ouachita County) Hauer SSP2
- Today (2025)
- 163,370 people
- By 2030
- 165,520 · +1.3%
- By 2040
- 167,652 · +2.6%
- By 2050
- 166,699 · +2.0%
- By 2075
- 156,348 · -4.3%
- By 2100
- 134,102 · -17.9%
Race, ethnicity, and origin ACS 2023
- Neighborhood character
- Predominantly White (94%)
- Race & ethnicity
- White 94% Hispanic / Latino 4% Two or more races 2% Black 1%
- Common ancestry
- Serbian 4% Lithuanian 2% Slovak 2%
- Languages at home
- 96% English-only · Spanish 3% Other Indo-European 1%
Political lean MEDSL · Ouachita
- 2024 margin
- Strong R (+27.9) · D 35.5% · R 63.3% · Other 1.2%
- 2008→2024 swing
- -2.7pp toward R · 2008: -25.2pp · 2024: -27.9pp
- All cycles
- 2024: R+27.9 2020: R+23.6 2016: R+25.4 2012: R+20.9 2008: R+25.2
Not yet ingested
- Civics
- —
Market trends
- HPI YoY
- ▼ -54.29%
- Current HPI
- 201.8198
- Rent YoY
- —
- Metro
- —
- State GDP YoY
- ▲ 3.29%
- F500 in state
- 10
Industry mix (Fortune 500 HQ in LA)
| Industry | F500 HQs | Revenue |
|---|---|---|
| Telecommunications | 2 | $23B |
|
||
| Utilities | 1 | $12B |
|
||
| Wholesale / Distribution | 1 | $5B |
|
||
| Advertising | 1 | $2B |
|
||
Price history
+266.5% since first listed5 events — show timeline
- 2026-06-01 Listed $219,900 NELABOR
- 2025-12-09 Price Changed $219,000 NELABOR
- 2025-10-14 Price Changed $220,000 NELABOR
- 2025-07-24 Listed $230,000 NELABOR
- 2017-11-03 Listed $60,000 NELABOR
Property tax history
+17.9%/yrLatest (2025): $1,675 · -3.4% YoY. Source: county tax records.
Cash-flow waterfall
monthlySold comps — $/sqft
last 12 mo · ≤1 miLoading sold comps…