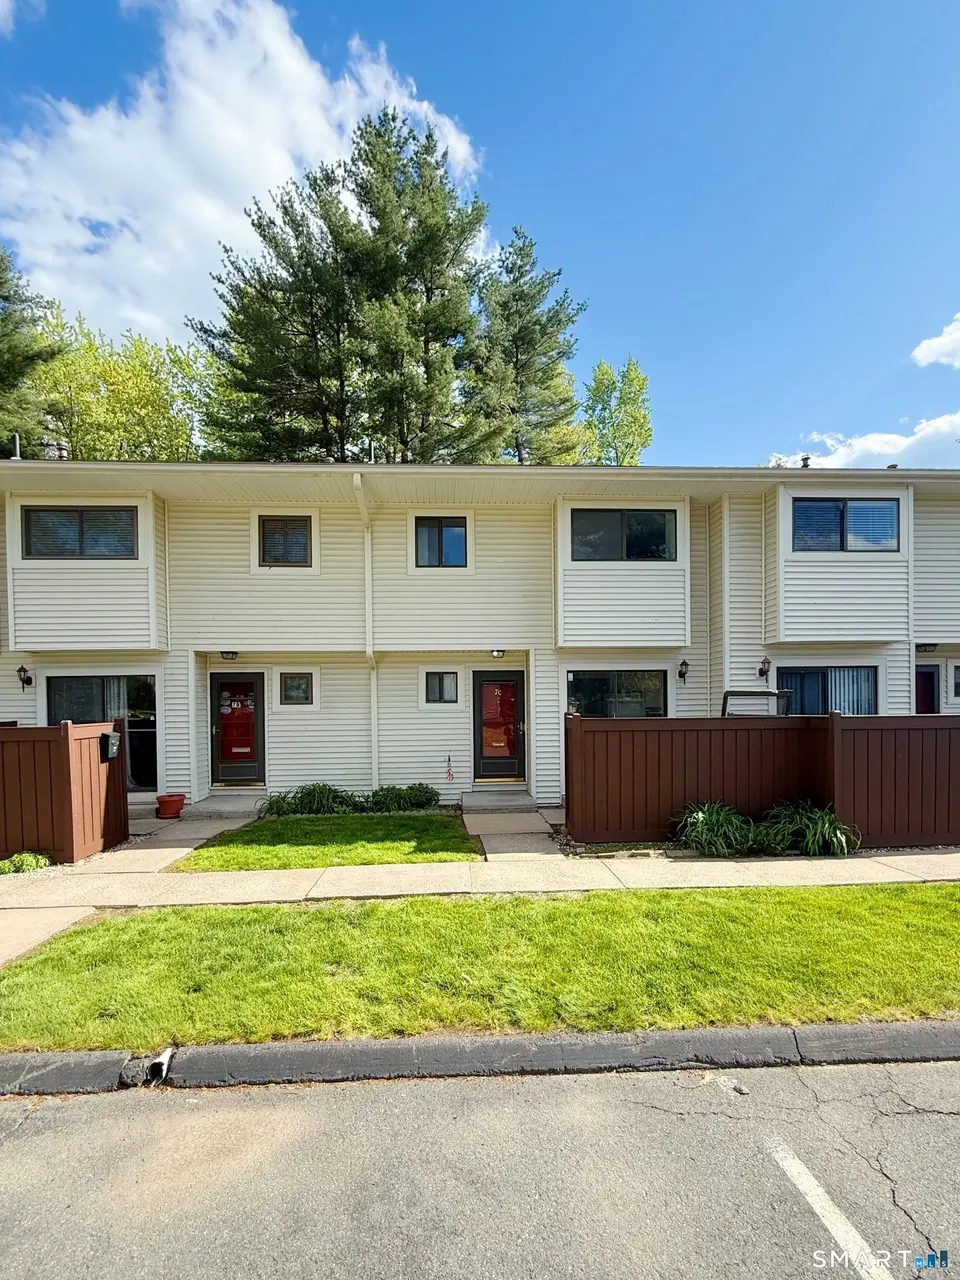
7 Woodland Ave Unit C · West Hartford, CT
Flood risk No data
- FEMA flood zone
- —
- Chance of flooding over 30 yrs
- —
- Est. flood insurance / yr
- —
Fire risk No data
- Est. fire insurance / yr
- —
Heat risk No data
- Hot days now (above threshold)
- —
- Hot days in 30 yrs
- —
Wind risk No data
- Chance of severe wind over 30 yrs
- —
Air-quality risk No data
- Unhealthy air days now
- —
- Unhealthy air days in 30 yrs
- —
Risk factors via First Street. Map © Google.
Why this score? — see what drove the B- grade
The composite is a weighted blend of 9 inputs, each scored 0–100. Each bar is that input's sub-score; the figure is the points it added to the 100-point composite (weight × sub-score).
- Cash flow +27.4/30.0
- 1% rule +10.0/10.0
- DSCR +9.6/10.0
- ARV discount +7.5/15.0
- Livability +4.0/5.0
- Rent growth +3.3/5.0
- Condition / age +2.5/5.0
- Schools +2.2/10.0
- Appreciation +0.0/10.0
$150,000
🖨 Deal sheet 📄 Offer letter ✓ Due diligence
Listing remarks
This 2-bedroom, 1.5-bath condo in desirable Bloomfield Village offers a fantastic opportunity for both investors and first-time buyers ready to add their personal touch. With a spacious layout that includes a large living room and a dedicated dining area, the home provides a solid foundation for comfortable living and future value. The property features a private front patio-perfect and decent sized back porch for relaxing outdoors. Additional highlights include large bedrooms, and plenty of basement storage offering ample space for organization and extra belongings. Residents also enjoy access to a community condo pool, adding to the appeal during warmer months. Ideally situated in a prime
Key facts
- Community condo pool
- Private front patio
- $370 HOA
Tags
Property features AI
Finance
- Other: Professional off-site property management; Pets allowed per condo board rules; Total units in complex: 53
- HOA & community: Monthly HOA fee ($370); HOA covers grounds maintenance, trash pickup, snow removal, water, sewer, property management, pool service; Community pool
Exterior
- Parking: Assigned parking; 2 parking spaces
- Utilities: Public water connected; Public sewer connected
- Home design: Condominium (Condo/Co-Op for sale); Part of Bloomfield Village complex
- Construction: Frame construction
- Exterior features: Vinyl siding; Deck; Patio; Level lot; In-ground swimming pool (community)
Interior
- Kitchen: Cooktop; Microwave; Refrigerator; Freezer; Dishwasher
- Bedrooms: 2 bedrooms
- Bathrooms: 1 full bath; 1 half bath
- Heating & cooling: Hot air heating (natural gas); Central air conditioning
- Interior features: 6 total rooms; Two-level unit; Full basement
- Laundry & utility: Washer/dryer hookups in basement; Hot water: Natural gas
Neighborhood map
What this means for you Summary
Snapshot
- This is a 2-bed/1.5-bath condo listed at $150k.
Deal economics
- At list price, monthly cash flow is $439 ($5k/yr) — positive.
- The deal already cash-flows at list — no discount required.
- Meets the 1% rule at list price ($3k rent vs $150k).
- Cap rate 9.8% vs local median 3.3% in West Hartford — top-decile yield for the area; either an underpriced asset or a hidden risk that comps aren't pricing in. Stress-test before assuming the spread holds.
Location & tenants
- Location reads 79/100 on livability (#27 in CT, #1,989 nationally) — a middle-class / working-renter tenant base. Strengths: schools A+, employment A+, housing A+; Watch: amenities F, cost of living F.
- Bloomfield School District (suburban): math 16% / reading 30% proficiency, ranked #137 of 153 in CT (top 90%) — low school quality limits family demand, transient renter base, plan for 1-2y turnover.
- Market conditions: Rents rising (+3.1%/yr); 64 active listings in the ZIP; 6 comparable units currently listed for rent nearby; rentals lingering (median 44d on market — plan ~5-8 weeks vacancy on turnover, expect pricing pressure); 50% of comp listings sitting > 30 days — soft ceiling on asking rent; solid renter incomes; 1,867 units permitted in Capitol Planning Region in 2024 (1,399 in 5+ unit buildings).
- This rent runs 32% of the median local income ($98k/yr) — at the standard rent-burdened threshold; future hikes will face affordability resistance.
Forward outlook
- Local home prices are declining (-3.0%/yr); year-one equity from $1k of loan paydown is wiped out by about $4k of value loss. Plan a longer hold.
- At projected returns (-3.0% appreciation + 3.1% rent growth), your $42k cash investment doubles in ~9 years — after that, you're playing with house money.
Negotiation context
- Only 2 days on market — expect competitive offers; lowballing is unlikely to land.
- 6 sale attempts since 15y ago with the ask held roughly flat each time — persistent listings suggest the price (not the market) is what's stuck; bring a comps-based counter.
- Current owner paid $63k; list at $150k implies a 138% gain — meaningful room to come down on a strong offer.
Risks & watch-outs
- Watch-outs: property tax is 3.3% of price.
Questions for the listing agent
- Built in 1971 — when were the roof, HVAC, electrical panel, plumbing, and water heater last replaced?
- Property tax is high relative to price — has the assessment been appealed recently, and will the sale trigger a re-assessment?
- What does the HOA fee cover, when was the last increase, and are there any pending special assessments or reserve-fund shortfalls?
- Any open or pending special assessments — roof, HVAC, plumbing, elevator, façade? What's the per-unit balance and payoff schedule, and is the seller paying it off at close or rolling it to the buyer?
- Is there a deadline driving the sale (1031 exchange, divorce, estate, relocation)? That informs how much negotiation room exists.
- Schools are A-rated — typically a magnet for longer-tenancy family renters. What's the average tenant stay here, and is there a school-zone premium baked into asking?
- What's the average days-on-market for RENTAL listings here right now (not sales)? A rising rental-DOM trend means longer vacancies and softer asking-rent achievability than the comps imply.
- What's the recent tenant-quality profile in this submarket — average credit score on applications, eviction rate, late-payment / NSF rate, and stable-employment percentage? A property-management company in the area should have these aggregated.
- How much new apartment / multifamily construction is in the pipeline within 1–3 miles? Heavy new supply (>2% of stock underway) typically softens rents 12–24 months out; light construction supports rent growth.
Investment metrics
- 1% rule
- 1.75% ✓
- Cap rate
- 9.81%
- Cash-on-cash
- 12.55%
- DSCR
- 1.56
- GRM
- 4.8
CMA / ARV
No comps found within radius.
Projected returns pro-forma
-3.0% appreciation · 3.11% rent growth · sell at horizon
- IRR
- 2.7%
- Equity multiple
- 1.10×
- Total profit
- $4,378
- Equity at exit
- $22,365
- IRR
- 12.6%
- Equity multiple
- 2.02×
- Total profit
- $42,700
- Equity at exit
- $12,969
Cash invested: $42,000 (down + closing). Projections, not guarantees.
Landlord ↔ Tenant lean methodology
- Overall (STATE)
- 27 Tenant-Leaning
- State Connecticut
- 27 Tenant-Leaning · D+7
- County
- — inherits STATE
- City
- — inherits STATE
ZIP-level market 06002
- Rents YoY
- 3.1%
- Active inventory
- 64
- Price-to-rent
- 4.8×
Monthly cashflow live
- Estimated rent
- $2,626 high interval (Pro) →
- Mortgage (P&I)
- −$787
- Tax from tax record
- −$416 /mo · $4,990/yr
- Insurance
- −$62
- HOA
- −$370
- Vacancy / Maint / Mgmt
- −$551
- Net cashflow
- $439
Break-even live
UW: 25.0% down · 7.5% · 30yr · 1.5% tax · 5.0% vac · 8.0% maint · 8.0% mgmt
Financing live
Cash to close
- Down payment
- $37,500
- Closing costs
- $4,500
- Reserves months
- —
- Total cash needed
- —
Loan-product check · same deal, 3 products live
Conventional
25% down · 7.5% · 30yr
- Down + closing
- —
- Monthly P&I
- —
- Monthly cashflow
- —
- DSCR
- —
- Eligible?
- —
Personal DTI + credit; lowest rate.
DSCR
20% down · 8.5% · 30yr
- Down + closing
- —
- Monthly P&I
- —
- Monthly cashflow
- —
- DSCR
- —
- Eligible?
- —
No personal income docs; deal must DSCR.
Hard money
10% down · 12.0% · 12mo
- Down + closing
- —
- Monthly P&I
- —
- Monthly cashflow
- —
- DSCR
- —
- Eligible?
- —
Short-term bridge; refi at stabilization.
Rent comps 6 comps
| Address | Beds | Baths | Sqft | Rent | $/sqft | DOM | Units | Dist |
|---|---|---|---|---|---|---|---|---|
| 55 Tunxis Ave Bloomfield, CT | 1.0–3.0 | 1.0–2.0 | 1003 | $2,346 | $2.34 | 43d | 1 | 0.37mi |
| 14 Revere Dr Bloomfield, CT | 2.0 | 1.0 | 980 | $2,088 | $2.13 | 43d | 1 | 0.90mi |
| 65 Jolley Dr Bloomfield, CT | 1.0–3.0 | 1.0–2.0 | 1054 | $3,312 | $3.14 | 43d | 16 | 0.93mi |
| 100 Ryefield Village Dr Bloomfield, CT | 2.0–4.0 | 2.5 | 1692 | $3,639 | $2.15 | 1d | 9 | 1.06mi |
| 95 Filley St Bloomfield, CT | 1.0–2.0 | 1.0–2.0 | 1020 | $2,660 | $2.61 | 1d | 7 | 1.47mi |
| 627 Brighton Park Way Bloomfield, CT | 1.0–2.0 | 1.0–2.0 | 883 | $2,757 | $3.12 | 1d | 10 | 1.49mi |
HOA detail condo
- Monthly dues
- $370 · $4,440/yr
- Likely covers
- pool
- Assessments
- None detected in remarks — confirm with the listing agent.
Listing history 14 events
-
2026-05-14status Under Contract
-
2026-05-10$150,000 Active
-
2016-10-31historical
-
2016-04-02$99,900
-
2015-11-22historical
-
2014-11-25$97,500
-
2014-11-21historical
-
2014-05-21$99,900
-
2014-05-19historical
-
2013-03-19$109,900
-
2012-03-07historical
-
2011-09-15$119,900
-
1998-09-30soldstatus $62,900
-
1989-06-02soldstatus $110,000
ⓘ Source: listings_history table (triggers on properties + properties_extension) + one-shot
backfill from property_details.listing_events for pre-trigger history.
Tax reassessment forecast CT · Partial reset (capped growth)
- Current annual tax
- $4,990 · $416/mo
- Projected year-2 tax
- $4,990 · $416/mo
- Expected delta
- $0/yr ($0/mo · 0.0%)
ⓘ Screening estimate from a state-policy table — verify with the county assessor before closing.
Nearby sold comps map
Loading sold comps map…
Walkable amenities ~0.75 mi
Loading nearby amenities…
Taxation est. · year 1
- Rental income
- $31,509
- − Mortgage interest
- −$8,402
- − Property taxes
- −$4,990
- − Insurance
- −$750
- − Repairs & maintenance
- −$2,521
- − Management
- −$2,521
- − HOA
- −$4,440
- − Depreciation
- −$4,364
- Taxable income
- $3,522
- Est. tax owed @ 24.0%
- −$845
- After-tax cash flow
- $4,428/yr
For passive investors: Depreciation is non-cash, so a rental often shows a tax loss while cash-flowing — sheltering income. Rental losses are passive: they offset passive income freely, and up to $25,000/yr can offset ordinary (W-2) income if you actively participate and your MAGI is under $100k (phasing out to $0 by $150k); unused losses carry forward. On sale, claimed depreciation is recaptured at up to 25%, and gains may owe capital-gains tax (a 1031 exchange can defer both). Figures are a year-1 estimate at your 24.0% rate — not tax advice; consult a CPA.
Schools (NCES district)
- District
- Bloomfield School District
- NCES district ID
- 0900330
- Math proficiency
- 16% ▼ -13.00%
- Reading proficiency
- 30% ▼ -12.00%
- Median HH income
- $71,180
- Composite
- 22.37/100
- National rank
- #8120
- State rank
- #137 of 153 in CT
Livability — West Hartford
- Score
- 79/100
- State rank
- #27
- US rank
- #1989
Category grades
Schools grade is shown separately in the Schools card above.
Census & demographics
- County
- Hartford County · 754,208 people
- City population
- 63,441
- Metro
- Hartford-East Hartford-Middletown, CT
- Population (ZIP)
- 21,865
- Household income
- $98,162
- Rent vs Own
- Severe rent burden
- 692.0
Population outlook (Capitol County) Hauer SSP2
- By 2040
- 1,063,519
Race, ethnicity, and origin ACS 2023
- Neighborhood character
- Diverse neighborhood (Simpson 0.61)
- Race & ethnicity
- Black 54% White 30% Hispanic / Latino 8% Two or more races 6% Asian 4%
- Hispanic origin (detail)
- Puerto Rican 4%
- Common ancestry
- Romanian 2% Lithuanian 2% Scotch-Irish 2%
- Foreign-born
- 25% · Canada, Vietnam, China
- Languages at home
- 82% English-only · Spanish 6% Other Indo-European 2% French/Haitian/Cajun 2%
Political lean MEDSL · Capitol
- 2024 margin
- Strong D (+21.9) · D 60.1% · R 38.2% · Other 1.7%
- All cycles
- 2024: D+21.9
Not yet ingested
- Civics
- —
Market trends
- HPI YoY
- ▼ -175.76%
- Current HPI
- 198.4604
- Rent YoY
- ▲ 3.11%
- Metro
- Hartford-East Hartford-Middletown, CT
- State GDP YoY
- ▲ 1.06%
- F500 in state
- 38
Industry mix (Fortune 500 HQ in CT)
| Industry | F500 HQs | Revenue |
|---|---|---|
| Industrial Machinery | 4 | $38B |
|
||
| Insurance | 3 | $71B |
|
||
| Financial Services | 2 | $25B |
|
||
| Transportation / Logistics | 2 | $18B |
|
||
| Healthcare | 1 | $247B |
|
||
| Telecommunications | 1 | $55B |
|
||
Price history
+36.4% since first listed14 events — show timeline
- 2026-05-14 Pending — Smart MLS
- 2026-05-10 Listed $150,000 Smart MLS
- 2016-10-31 Listing Removed — Smart MLS
- 2016-04-02 Listed $99,900 Smart MLS
- 2015-11-22 Listing Removed — Smart MLS
- 2014-11-25 Listed $97,500 Smart MLS
- 2014-11-21 Listing Removed — Smart MLS
- 2014-05-21 Listed $99,900 Smart MLS
- 2014-05-19 Listing Removed — Smart MLS
- 2013-03-19 Listed $109,900 Smart MLS
- 2012-03-07 Listing Removed — Smart MLS
- 2011-09-15 Listed $119,900 Smart MLS
- 1998-09-30 Sold (Public Records) $62,900 Public Records
- 1989-06-02 Sold (Public Records) $110,000 Public Records
Property tax history
+3.3%/yrLatest (2025): $4,990 · +58.1% YoY. Source: county tax records.
Cash-flow waterfall
monthlySold comps — $/sqft
last 12 mo · ≤1 miLoading sold comps…