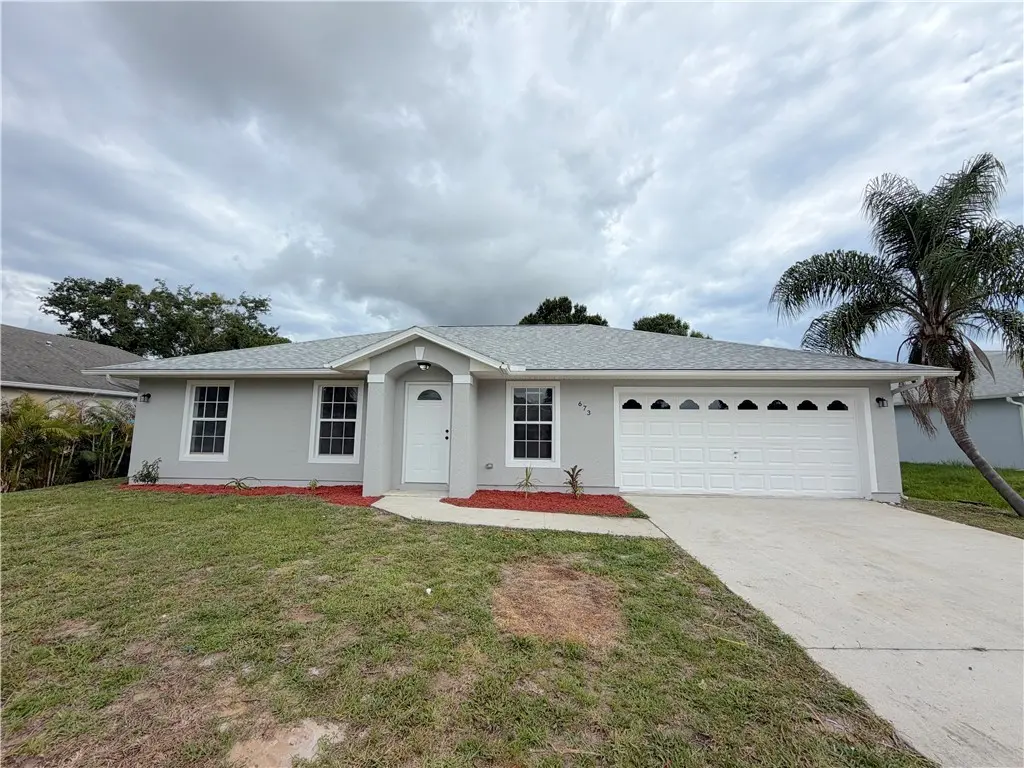
673 Cavern Ter · Sebastian, FL
Flood risk 1/10 · Minimal
- FEMA flood zone
- X (unshaded)
- Chance of flooding over 30 yrs
- 0.0%
- Est. flood insurance / yr
- $507 – $1,088
Fire risk 2/10 · Minimal
- Est. fire insurance / yr
- $947 – $1,759
Heat risk 10/10 · Severe
- Hot days now (above 106°F)
- 7 days/yr
- Hot days in 30 yrs
- 23 days/yr
Wind risk 10/10 · Severe
- Chance of severe wind over 30 yrs
- 99.0%
Air-quality risk 1/10 · Minimal
- Unhealthy air days now
- 0 days/yr
- Unhealthy air days in 30 yrs
- 0 days/yr
Risk factors via First Street. Map © Google.
Why this score? — see what drove the D- grade
The composite is a weighted blend of 9 inputs, each scored 0–100. Each bar is that input's sub-score; the figure is the points it added to the 100-point composite (weight × sub-score).
- Cash flow +11.4/30.0
- ARV discount +5.3/15.0
- Schools +4.2/10.0
- Rent growth +4.1/5.0
- Livability +4.0/5.0
- DSCR +3.3/10.0
- Condition / age +2.5/5.0
- 1% rule +2.3/10.0
- Appreciation +0.0/10.0
$324,900
🖨 Deal sheet 📄 Offer letter ✓ Due diligence
Listing remarks
Professional photos coming soon. .Prime Sebastian location. Close to Riverview park, boat ramp, parks, shopping/dining. This perfectly updated home features 3 beds, 2 baths, split floor plan & 2 car garage. Upgraded kitchen with island, quartz countertops, custom backsplash, crisp white cabinets, pantry, black fixtures & new stainless steel appliances. The primary has a custom remodeled bathroom, walk-in closet & tile shower. Tile plank flooring, fresh paint, baseboards & light fixtures w/ remote-controlled fans add a fresh touch throughout. New drain-field, 2023 roof, 2026 W/ H, 2025 AC. NO HOA
Key facts
- Custom backsplash
- Quartz countertops
- Riverview park
Tags
Neighborhood map
What this means for you Summary
Snapshot
- This is a 3-bed/2.0-bath single-family listed at $325k.
Deal economics
- At list price, monthly cash flow is $-111 ($-1k/yr) — negative.
- To cash-flow at today's rent, offer at most $305k (6.0% below list).
- To meet the 1% rule (rent ≥ 1% of price), the offer needs to be $236k (27.3% below list).
- Recommended offer: $236k (27.3% below list) — sets the bar for 1% rule.
- Cap rate 5.9% vs local median 4.4% in Sebastian — top-decile yield for the area; either an underpriced asset or a hidden risk that comps aren't pricing in. Stress-test before assuming the spread holds.
Location & tenants
- Location reads 81/100 on livability (#89 in FL, #1,421 nationally) — a professional / high-income tenant draw. Strengths: housing A+, crime A, health & safety A; Watch: schools D+, amenities D-.
- Indian River (other): math 48% / reading 52% proficiency, ranked #35 of 73 in FL (top 48%) — acceptable for families but not a draw, mixed tenant base, ~2y average lease.
- Market conditions: Rents rising fast (+6.2%/yr); 412 active listings in the ZIP; 11 comparable units currently listed for rent nearby; rentals at typical pace (median 21d on market — plan ~3-4 weeks tenant-placement turnaround); 564 units permitted in Indian River County in 2024 (281 in 5+ unit buildings).
- This rent runs 42% of the median local income ($67k/yr) — at the standard rent-burdened threshold; future hikes will face affordability resistance.
Forward outlook
- Local home prices are declining (-3.0%/yr); year-one equity from $2k of loan paydown is wiped out by about $10k of value loss. Plan a longer hold.
- Indian River County population projected at +18% by 2050 — long-run rental-demand tailwind backs the buy-and-hold thesis.
Negotiation context
- Only 1 days on market — expect competitive offers; lowballing is unlikely to land.
Risks & watch-outs
- Climate carrying-cost: severe wind risk, 99% chance of damaging wind over 30y; extreme-heat days projected 7→23/yr by 2055 (HVAC capex compounding) — expect insurance premiums to compound above CPI over the hold.
Questions for the listing agent
- What do current leases actually rent for vs. the listed asking? Can we see a recent rent roll and the last 12 months of T-12 income?
- Is there a deadline driving the sale (1031 exchange, divorce, estate, relocation)? That informs how much negotiation room exists.
- Schools are D-rated, which usually means shorter tenancies and higher turnover. Who's the typical renter profile here, and what's been the actual vacancy rate?
- The area grade is low — what's the realistic commute time and amenity access for the typical tenant pool here? Any planned neighborhood developments (good or bad) we should know about?
- What's the average days-on-market for RENTAL listings here right now (not sales)? A rising rental-DOM trend means longer vacancies and softer asking-rent achievability than the comps imply.
- What's the recent tenant-quality profile in this submarket — average credit score on applications, eviction rate, late-payment / NSF rate, and stable-employment percentage? A property-management company in the area should have these aggregated.
- How much new for-sale + rental construction is in the pipeline within 1–3 miles? Heavy new supply typically softens prices + rents 12–24 months out; constrained supply supports both.
Investment metrics
- 1% rule
- 0.73% ✗
- Cap rate
- 5.88%
- Cash-on-cash
- -1.46%
- DSCR
- 0.93
- GRM
- 11.5
CMA / ARV
- ARV (on-the-fly)
- $309,659
- Comps found
- 12
Show comp detail 12 sales within ~0.75 mi
| Address | Dist | Beds/Ba | Sqft | Sold | Price | $/sf | Match |
|---|---|---|---|---|---|---|---|
| 1562 Schooner Ln | 0.13mi | 3/2.0 | 1,384 (-3%) | 3mo | $340,000 | $246 | 87 |
| 795 Rolling Hill Dr | 0.35mi | 2/2.0 (-1) | 1,440 (+1%) | 0mo | $277,400 | $193 | 77 |
| 1502 Quatrain Ln | 0.16mi | 3/2.0 | 1,549 (+8%) | 3mo | $325,000 | $210 | 76 |
| 1625 Whitmore St | 0.37mi | 2/2.0 (-1) | 1,440 (+1%) | 6mo | $288,000 | $200 | 71 |
| 907 Starflower Ave | 0.57mi | 3/2.0 | 1,472 (+3%) | 3mo | $320,000 | $217 | 66 |
| 1782 Laconia St | 0.31mi | 3/2.0 | 1,592 (+12%) | 2mo | $345,000 | $217 | 65 |
| 561 Carnival Ter | 0.34mi | 3/2.0 | 1,285 (-10%) | 5mo | $327,500 | $255 | 63 |
| 626 Browning Ter | 0.47mi | 2/2.0 (-1) | 1,388 (-3%) | 6mo | $299,990 | $216 | 63 |
| 1362 Seahouse St | 0.69mi | 3/2.0 | 1,481 (+4%) | 2mo | $359,900 | $243 | 60 |
| 491 Carnival Ter | 0.68mi | 3/2.0 | 1,348 (-6%) | 2mo | $357,000 | $265 | 58 |
| 485 Periwinkle Dr | 0.45mi | 3/2.0 | 1,634 (+14%) | 5mo | $429,000 | $263 | 50 |
| 1593 Esterbrook Ln | 0.71mi | 3/2.0 | 1,512 (+6%) | 8mo | $255,000 | $169 | 50 |
Match score weights: distance 35% · size 25% · config 20% · recency 20%. Top-matched comps best support the ARV.
Projected returns pro-forma
-3.0% appreciation · 6.22% rent growth · sell at horizon
- IRR
- -15.6%
- Equity multiple
- 0.43×
- Total profit
- $-51,938
- Equity at exit
- $48,444
- IRR
- -3.0%
- Equity multiple
- 0.78×
- Total profit
- $-20,224
- Equity at exit
- $28,091
Cash invested: $90,972 (down + closing). Projections, not guarantees.
Landlord ↔ Tenant lean methodology
- Overall (STATE)
- 87 Strongly Landlord-Friendly
- State Florida
- 87 Strongly Landlord-Friendly · R+3
- County
- — inherits STATE
- City
- — inherits STATE
ZIP-level market 32958
- Home prices YoY
- -13.1%
- Rents YoY
- 6.2%
- Active inventory
- 412
- Price-to-rent
- 11.5×
Monthly cashflow live
- Estimated rent
- $2,361 high interval (Pro) →
- Mortgage (P&I)
- −$1,704
- Tax from tax record
- −$137 /mo · $1,640/yr
- Insurance
- −$135
- HOA
- −$0
- Vacancy / Maint / Mgmt
- −$496
- Net cashflow
- $-111
Break-even live
UW: 25.0% down · 7.5% · 30yr · 1.5% tax · 5.0% vac · 8.0% maint · 8.0% mgmt
Financing live
Cash to close
- Down payment
- $81,225
- Closing costs
- $9,747
- Reserves months
- —
- Total cash needed
- —
Loan-product check · same deal, 3 products live
Conventional
25% down · 7.5% · 30yr
- Down + closing
- —
- Monthly P&I
- —
- Monthly cashflow
- —
- DSCR
- —
- Eligible?
- —
Personal DTI + credit; lowest rate.
DSCR
20% down · 8.5% · 30yr
- Down + closing
- —
- Monthly P&I
- —
- Monthly cashflow
- —
- DSCR
- —
- Eligible?
- —
No personal income docs; deal must DSCR.
Hard money
10% down · 12.0% · 12mo
- Down + closing
- —
- Monthly P&I
- —
- Monthly cashflow
- —
- DSCR
- —
- Eligible?
- —
Short-term bridge; refi at stabilization.
Rent comps 11 comps
| Address | Beds | Baths | Sqft | Rent | $/sqft | DOM | Units | Dist |
|---|---|---|---|---|---|---|---|---|
| 722 Carnival Ter Sebastian, FL | 3.0 | 2.0 | 1430 | $2,300 | $1.61 | 13d | 1 | 0.15mi |
| 1507 Ocean Cove St Sebastian, FL | 3.0 | 2.0 | 1661 | $2,100 | $1.26 | 13d | 1 | 0.27mi |
| 1565 Glentry Ln Sebastian, FL | 2.0 | 2.0 | 1189 | $2,500 | $2.10 | 13d | 1 | 0.42mi |
| 742 Capon Ter Sebastian, FL | 2.0 | 2.0 | 1080 | $2,000 | $1.85 | 21d | 1 | 0.71mi |
| 1421 Thornhill Ln Sebastian, FL | 3.0 | 2.0 | 1216 | $2,800 | $2.30 | 13d | 1 | 0.97mi |
| 155 Midvale Ter Sebastian, FL | 3.0 | 2.0 | 1853 | $3,000 | $1.62 | 21d | 1 | 1.07mi |
| 117 Acorn Ter Sebastian, FL | 3.0 | 1.0 | 896 | $1,800 | $2.01 | 21d | 1 | 1.11mi |
| 1198 Breezy Way Unit 7A Sebastian, FL | 2.0 | 2.0 | 960 | $1,900 | $1.98 | 21d | 1 | 1.21mi |
| 1110 Barber St Sebastian, FL | 3.0 | 2.0 | 1324 | $2,200 | $1.66 | 13d | 1 | 1.23mi |
| 1836 Barber St Sebastian, FL | 4.0 | 2.0 | 1851 | $2,000 | $1.08 | 21d | 1 | 1.40mi |
| 426 Tulip Dr Sebastian, FL | 2.0 | 2.0 | 1161 | $2,100 | $1.81 | 21d | 1 | 1.45mi |
Listing history 8 events
-
2026-06-18statusdays on market $324,900 Active 1 DOM
-
2026-06-17days on market $324,900 Coming Soon 8 DOM
-
2026-06-16days on market $324,900 Coming Soon 7 DOM
-
2026-06-15days on market $324,900 Coming Soon 6 DOM
-
2026-06-14days on market $324,900 Coming Soon 4 DOM
-
2026-06-13days on market $324,900 Coming Soon 3 DOM
-
2026-06-10remarks 610-char remark
-
2026-06-10$324,900 Coming Soon 1 DOM
ⓘ Source: listings_history table (triggers on properties + properties_extension) + one-shot
backfill from property_details.listing_events for pre-trigger history.
Tax reassessment forecast FL · Resets to sale price
- Current annual tax
- $1,640 · $137/mo
- Projected year-2 tax
- $2,697 · $225/mo
- Expected delta
- +$1,057/yr (+$88/mo · 64.4%)
ⓘ Screening estimate from a state-policy table — verify with the county assessor before closing.
Climate risk First Street
- Flood 1/10 Low FEMA zone X (unshaded) · 0% chance over 30 yrs
- Wildfire 2/10 Low
- Heat 10/10 Extreme 7 d/yr ≥106°F today · 23 d/yr by 30 yrs out
- Wind 10/10 Extreme 99% chance of damaging wind over 30 yrs
- Air quality 1/10 Low 0 unhealthy d/yr today · 0 by 30 yrs out
Nearby sold comps map
Loading sold comps map…
Walkable amenities ~0.75 mi
Loading nearby amenities…
Taxation est. · year 1
- Rental income
- $28,330
- − Mortgage interest
- −$18,199
- − Property taxes
- −$1,640
- − Insurance
- −$1,624
- − Repairs & maintenance
- −$2,266
- − Management
- −$2,266
- − Depreciation
- −$9,452
- Taxable loss
- −$7,118
- Est. tax savings @ 24.0%
- +$1,708
- After-tax cash flow
- $379/yr
For passive investors: Depreciation is non-cash, so a rental often shows a tax loss while cash-flowing — sheltering income. Rental losses are passive: they offset passive income freely, and up to $25,000/yr can offset ordinary (W-2) income if you actively participate and your MAGI is under $100k (phasing out to $0 by $150k); unused losses carry forward. On sale, claimed depreciation is recaptured at up to 25%, and gains may owe capital-gains tax (a 1031 exchange can defer both). Figures are a year-1 estimate at your 24.0% rate — not tax advice; consult a CPA.
Schools (NCES district)
- District
- Indian River
- NCES district ID
- 1200930
- Math proficiency
- 48% ▼ -9.00%
- Reading proficiency
- 52% ▼ -3.00%
- Median HH income
- $46,597
- Composite
- 42.45/100
- National rank
- #3218
- State rank
- #35 of 73 in FL
Livability — Sebastian
- Score
- 81/100
- State rank
- #89
- US rank
- #1421
Category grades
Schools grade is shown separately in the Schools card above.
Census & demographics
- Census place
- Sebastian, FL
- County
- Indian River County · 143,738 people
- City population
- 30,023
- Metro
- Sebastian-Vero Beach, FL
- Population (ZIP)
- 30,023
- Household income
- $66,840
- Rent vs Own
- Severe rent burden
- 646.0
Population outlook (Indian River County) Hauer SSP2
- Today (2025)
- 165,104 people
- By 2030
- 172,869 · +4.7%
- By 2040
- 185,640 · +12.4%
- By 2050
- 194,465 · +17.8%
- By 2075
- 211,115 · +27.9%
- By 2100
- 211,781 · +28.3%
Race, ethnicity, and origin ACS 2023
- Neighborhood character
- Predominantly White (86%)
- Race & ethnicity
- White 86% Hispanic / Latino 9% Two or more races 7% Black 2% Asian 1%
- Hispanic origin (detail)
- Mexican 1% Puerto Rican 2% Cuban 3%
- Common ancestry
- Lithuanian 4% Slovak 4% Romanian 3%
- Foreign-born
- 7% · Canada, Jamaica
- Languages at home
- 91% English-only · Spanish 6% Other Indo-European 1% Russian/Polish/Slavic 1%
Political lean MEDSL · Indian River
- 2024 margin
- Strong R (+27.4) · D 36.0% · R 63.4%
- 2008→2024 swing
- -12.5pp toward R · 2008: -14.8pp · 2024: -27.4pp
- All cycles
- 2024: R+27.4 2020: R+21.6 2016: R+24.5 2012: R+22.3 2008: R+14.8
Not yet ingested
- Civics
- —
Market trends
- HPI YoY
- ▼ -49.85%
- Current HPI
- 330.1691
- Rent YoY
- ▲ 6.22%
- Metro
- Sebastian-Vero Beach, FL
- State GDP YoY
- ▲ 3.28%
- F500 in state
- 36
Industry mix (Fortune 500 HQ in FL)
| Industry | F500 HQs | Revenue |
|---|---|---|
| Industrial Technology | 2 | $29B |
|
||
| Insurance | 2 | $17B |
|
||
| Retail | 1 | $60B |
|
||
| Technology Distribution | 1 | $58B |
|
||
| Homebuilding | 1 | $35B |
|
||
| Technology Manufacturing | 1 | $35B |
|
||
Price history
1 event — show timeline
- 2026-06-09 Coming Soon $324,900 RAIRCMLS
Property tax history
+4.4%/yrLatest (2025): $1,640 · +5.0% YoY. Source: county tax records.
Cash-flow waterfall
monthlySold comps — $/sqft
last 12 mo · ≤1 miLoading sold comps…