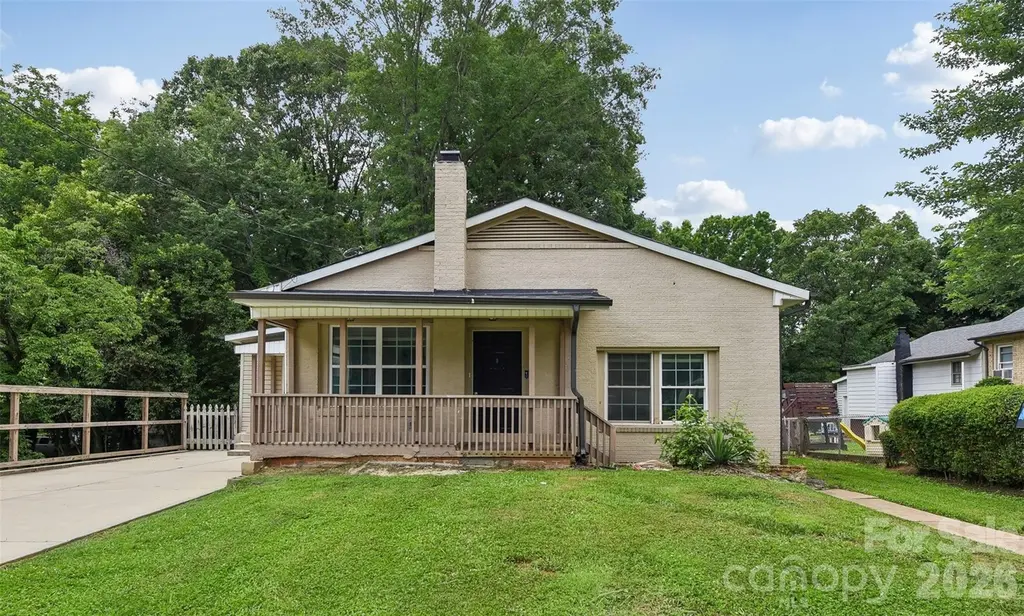
2657 Norman St · Gastonia, NC
Flood risk 1/10 · Minimal
- FEMA flood zone
- X (unshaded)
- Chance of flooding over 30 yrs
- 0.0%
- Est. flood insurance / yr
- $507 – $1,088
Fire risk 3/10 · Minor
- Est. fire insurance / yr
- $906 – $1,684
Heat risk 6/10 · Moderate
- Hot days now (above 104°F)
- 7 days/yr
- Hot days in 30 yrs
- 17 days/yr
Wind risk 5/10 · Moderate
- Chance of severe wind over 30 yrs
- 25.0%
Air-quality risk 3/10 · Minor
- Unhealthy air days now
- 3 days/yr
- Unhealthy air days in 30 yrs
- 3 days/yr
Risk factors via First Street. Map © Google.
Why this score? — see what drove the C+ grade
The composite is a weighted blend of 9 inputs, each scored 0–100. Each bar is that input's sub-score; the figure is the points it added to the 100-point composite (weight × sub-score).
- Cash flow +21.5/30.0
- ARV discount +15.0/15.0
- DSCR +6.9/10.0
- 1% rule +5.8/10.0
- Schools +3.6/10.0
- Rent growth +3.0/5.0
- Livability +3.0/5.0
- Condition / age +2.5/5.0
- Appreciation +0.0/10.0
$175,000
🖨 Deal sheet (PDF) 📄 Offer letter ✓ Due diligence
Listing remarks MLS
Showings start June 17, 2022 but offers welcome anytime. Vintage chic bungalow ranch with a finished bonus room in the basement. Completely renovated 2 years ago so HVAC, HWH, new cabinets and vanities, granite countertops, new floors, new plumbing, new wiring, lighting, ss appliances. Neutral paint, new roof even. Located off of New Hope Rd near Publix, Harris Teeter
Key facts
- Covered front porch
- One-level living
- Unfinished basement
Tags
Property features AI
Finance
- HOA & community: No HOA
Exterior
- Parking: Driveway
- Utilities: City water; Septic system installed
- Home design: Single family residence; Residential property; One level
- Construction: Site-built construction; Vinyl exterior; Crawl space foundation; Built on one level
- Exterior features: Concrete and gravel road access; Private maintained road
Interior
- Kitchen: Dishwasher; Electric range; Microwave; Refrigerator; Electric water heater
- Bedrooms: 3 bedrooms on the main level
- Bathrooms: 2 full bathrooms on the main level
- Heating & cooling: Central heating; Heat pump; Natural gas heating; Central air conditioning; Electric cooling
- Interior features: 7 rooms total; Interior entry basement; Unfinished basement with storage space
- Laundry & utility: Washer hookup; Electric dryer hookup; Laundry located in hall on the main level, inside the home
Neighborhood map
What this means for you Summary
Snapshot
- This is a 3-bed/2.0-bath single-family listed at $175k.
Deal economics
- At list price, monthly cash flow is $262 ($3k/yr) — positive.
- The deal already cash-flows at list — no discount required.
- Meets the 1% rule at list price ($2k rent vs $175k).
- Recommended offer: $172k (1.5% below list) — sets the bar for market timing.
- Cap rate 8.1% vs local median 3.7% in Gastonia — top-decile yield for the area; either an underpriced asset or a hidden risk that comps aren't pricing in. Stress-test before assuming the spread holds.
Location & tenants
- Location reads 59/100 on livability (#528 in NC) — a working-class tenant base; expect higher turnover. Strengths: cost of living A+, housing A+; Watch: employment D, crime F, amenities F.
- Gaston County Schools (suburban): math 44% / reading 42% proficiency, ranked #93 of 178 in NC (top 52%) — families likely to look elsewhere, expect single-tenant / working-renter base with shorter leases.
- Zoned schools: Gardner Park Elementary (math 35% / reading 36%, grade F, #817 of 1,410 statewide, top 58%, 521 students, 99% FRL); Cramerton Middle (math 71% / reading 68%, grade A, #21 of 475 statewide, top 4%, 909 students, 38% FRL); Forestview High (math 72% / reading 59%, grade B, #159 of 535 statewide, top 30%, 1,081 students, 47% FRL) — zoned schools average 62% FRL vs 37% district-wide (25 pts higher); higher-poverty schools than district average — tighter screening recommended.
- Zoned-school proficiency averages 57% at this address vs 43% district-wide (+14 pts) — the actual schools serving this property are materially stronger than the Gaston County Schools average implies; a family-tenant draw the district grade alone would hide.
- Market conditions: Rents rising (+1.9%/yr); 361 active listings in the ZIP; 13 comparable units currently listed for rent nearby; rentals at typical pace (median 23d on market — plan ~3-4 weeks tenant-placement turnaround); solid renter incomes; 2,069 units permitted in Gaston County in 2024 (142 in 5+ unit buildings).
Forward outlook
- Local home prices are declining (-3.0%/yr); year-one equity from $1k of loan paydown is wiped out by about $5k of value loss. Plan a longer hold.
- Gaston County population projected at +12% by 2050 — modest demand growth; plan on rents tracking national, not racing it.
Negotiation context
- It's been on market 16 days — a 2% lower offer ($172k) is reasonable based on typical stale-listing flexibility.
- 6 sale attempts since 5y ago with the ask held roughly flat each time — persistent listings suggest the price (not the market) is what's stuck; bring a comps-based counter.
Risks & watch-outs
- Climate carrying-cost: moderate wind risk, 25% chance of damaging wind over 30y; extreme-heat days projected 7→17/yr by 2055 (HVAC capex compounding) — expect insurance premiums to compound above CPI over the hold.
Questions for the listing agent
- Built in 1964 — when were the roof, HVAC, electrical panel, plumbing, and water heater last replaced?
- Is there a deadline driving the sale (1031 exchange, divorce, estate, relocation)? That informs how much negotiation room exists.
- Schools are D-rated, which usually means shorter tenancies and higher turnover. Who's the typical renter profile here, and what's been the actual vacancy rate?
- Crime grade is F in this area — have there been break-ins, vandalism, or insurance claims at this property in the last 3 years? What carrier currently insures it and at what premium?
- What's the average days-on-market for RENTAL listings here right now (not sales)? A rising rental-DOM trend means longer vacancies and softer asking-rent achievability than the comps imply.
- What's the recent tenant-quality profile in this submarket — average credit score on applications, eviction rate, late-payment / NSF rate, and stable-employment percentage? A property-management company in the area should have these aggregated.
- How much new for-sale + rental construction is in the pipeline within 1–3 miles? Heavy new supply typically softens prices + rents 12–24 months out; constrained supply supports both.
Investment metrics
- 1% rule
- 1.08% ✓
- Cap rate
- 8.09%
- Cash-on-cash
- 6.42%
- DSCR
- 1.29
- GRM
- 7.7
CMA / ARV
- ARV (on-the-fly)
- $337,344
- Comps found
- 12
Show comp detail 12 sales within ~0.75 mi
| Address | Dist | Beds/Ba | Sqft | Sold | Price | $/sf | Match |
|---|---|---|---|---|---|---|---|
| 4330 Cross Ridge Dr | 0.36mi | 3/2.0 | 1,537 (+2%) | 6mo | $359,900 | $234 | 74 |
| 4321 Timberwood Dr | 0.26mi | 3/2.0 | 1,370 (-9%) | 1mo | $349,900 | $255 | 72 |
| 3518 Cramer Creek Dr | 0.26mi | 4/2.0 (+1) | 1,497 (-1%) | 12mo | $350,000 | $234 | 72 |
| 4324 Hickory Hollow Rd | 0.47mi | 3/2.0 | 1,561 (+4%) | 0mo | $245,000 | $157 | 72 |
| 433 Linsbury Ct | 0.42mi | 3/2.0 | 1,531 (+2%) | 12mo | $360,000 | $235 | 68 |
| 4277 Timberwood Dr | 0.33mi | 3/2.0 | 1,373 (-9%) | 6mo | $330,000 | $240 | 65 |
| 4147 Timberwood Dr | 0.51mi | 3/2.0 | 1,470 (-2%) | 12mo | $330,000 | $224 | 63 |
| 3874 Streamside Dr | 0.51mi | 3/2.5 | 1,622 (+8%) | 2mo | $315,000 | $194 | 60 |
| 4325 Donnell Dr | 0.45mi | 3/2.5 | 1,664 (+10%) | 2mo | $353,500 | $212 | 58 |
| 4508 Rillview Ct | 0.46mi | 3/2.0 | 1,688 (+12%) | 4mo | $330,000 | $195 | 56 |
| 318 Linsbury Ct | 0.28mi | 3/2.5 | 1,728 (+15%) | 10mo | $350,000 | $203 | 52 |
| 3808 Pine Cove Dr | 0.62mi | 2/2.0 (-1) | 1,598 (+6%) | 12mo | $340,000 | $213 | 45 |
Match score weights: distance 35% · size 25% · config 20% · recency 20%. Top-matched comps best support the ARV.
Projected returns pro-forma
-3.0% appreciation · 1.94% rent growth · sell at horizon
- IRR
- -7.6%
- Equity multiple
- 0.72×
- Total profit
- $-13,620
- Equity at exit
- $26,093
- IRR
- 0.5%
- Equity multiple
- 1.04×
- Total profit
- $1,778
- Equity at exit
- $15,131
Cash invested: $49,000 (down + closing). Projections, not guarantees.
Landlord ↔ Tenant lean methodology
- Overall (STATE)
- 85 Strongly Landlord-Friendly
- State North Carolina
- 85 Strongly Landlord-Friendly · R+3
- County
- — inherits STATE
- City
- — inherits STATE
ZIP-level market 28056
- Rents YoY
- 1.9%
- Active inventory
- 361
- Price-to-rent
- 7.7×
Monthly cashflow live
- Estimated rent
- $1,897 high interval (Pro) →
- Mortgage (P&I)
- −$918
- Tax from tax record
- −$246 /mo · $2,948/yr
- Insurance
- −$73
- HOA
- −$0
- Vacancy / Maint / Mgmt
- −$398
- Net cashflow
- $262
Break-even live
Sensitivity live
| Price | -10% $361 | -5% $312 | +0% $262 | +5% $213 | +10% $163 |
|---|---|---|---|---|---|
| Rent | -10% $112 | -5% $187 | +0% $262 | +5% $337 | +10% $412 |
| Rate | -1.0pp $350 | -0.5pp $307 | base $262 | +0.5pp $217 | +1.0pp $171 |
UW: 25.0% down · 7.5% · 30yr · 1.5% tax · 5.0% vac · 8.0% maint · 8.0% mgmt
Financing live
Cash to close
- Down payment
- $43,750
- Closing costs
- $5,250
- Reserves months
- —
- Total cash needed
- —
Loan-product check · same deal, 3 products live
Conventional
25% down · 7.5% · 30yr
- Down + closing
- —
- Monthly P&I
- —
- Monthly cashflow
- —
- DSCR
- —
- Eligible?
- —
Personal DTI + credit; lowest rate.
DSCR
20% down · 8.5% · 30yr
- Down + closing
- —
- Monthly P&I
- —
- Monthly cashflow
- —
- DSCR
- —
- Eligible?
- —
No personal income docs; deal must DSCR.
Hard money
10% down · 12.0% · 12mo
- Down + closing
- —
- Monthly P&I
- —
- Monthly cashflow
- —
- DSCR
- —
- Eligible?
- —
Short-term bridge; refi at stabilization.
Rent comps 13 comps
| Address | Beds | Baths | Sqft | Rent | $/sqft | DOM | Units | Dist |
|---|---|---|---|---|---|---|---|---|
| 3589 Catawba Creek Dr Gastonia, NC | 3.0 | 2.5 | 2134 | $2,130 | $1.00 | 20d | 1 | 0.35mi |
| 2129 Rocky Falls Ln Gastonia, NC | 3.0 | 2.5 | 1320 | $1,699 | $1.29 | 22d | 1 | 0.78mi |
| 2524 Arrowhead Cir Gastonia, NC | 2.0 | 2.5 | 1320 | $1,599 | $1.21 | 17d | 1 | 0.80mi |
| 2093 Hoffman Rd Unit 2129 RFL Gastonia, NC | 3.0 | 2.5 | 1320 | $1,699 | $1.29 | 26d | 1 | 0.80mi |
| 2093 Hoffman Rd Unit 2524 AHC Gastonia, NC | 2.0 | 2.5 | 1320 | $1,599 | $1.21 | 17d | 1 | 0.80mi |
| 2093 Hoffman Rd Unit 2061 CCC Gastonia, NC | 2.0 | 2.5 | 1320 | $1,699 | $1.29 | 22d | 1 | 0.80mi |
| 2961 Beaty Rd Gastonia, NC | 3.0 | 2.0 | 1344 | $1,900 | $1.41 | 26d | 1 | 0.88mi |
| 2442 Chartres Dr Gastonia, NC | 1.0–3.0 | 1.5–3.0 | 1097 | $1,625 | $1.48 | 26d | 1 | 1.18mi |
| 3308 Glade Dr Gastonia, NC | 3.0–4.0 | 2.5 | 1948 | $2,070 | $1.06 | 0d | 4 | 1.18mi |
| 2046 Aragon Ln Gastonia, NC | 3.0 | 2.5 | 1448 | $1,739 | $1.20 | 4d | 1 | 1.22mi |
| 5028 Newport Landing Way Gastonia, NC | 3.0 | 3.0 | 2020 | $1,950 | $0.97 | 26d | 1 | 1.22mi |
| 2410 McLean St Unit 9 Gastonia, NC | 2.0 | 2.0 | 1300 | $1,475 | $1.13 | 14d | 1 | 1.26mi |
| 2410 McLean St Unit 12 Gastonia, NC | 2.0 | 2.0 | 1300 | $1,375 | $1.06 | 26d | 1 | 1.26mi |
Listing history 10 events
-
2026-06-21days on market $175,000 Active 16 DOM
-
2026-06-18days on market $175,000 Active 13 DOM
-
2026-06-17statusdays on market $175,000 Active 12 DOM
-
2026-06-16days on market $175,000 Active Under Contract 11 DOM
-
2026-06-15days on market $175,000 Active Under Contract 10 DOM
-
2026-06-13statusdays on market $175,000 Active Under Contract 8 DOM
-
2026-06-09days on market $175,000 Active 4 DOM
-
2026-06-08days on market $175,000 Active 3 DOM
-
2026-06-07remarks 699-char remark
-
2026-06-07$175,000 Active 2 DOM
ⓘ Source: listings_history table (triggers on properties + properties_extension) + one-shot
backfill from property_details.listing_events for pre-trigger history.
Tax reassessment forecast NC · Resets to sale price
- Current annual tax
- $2,948 · $246/mo
- Projected year-2 tax
- $2,948 · $246/mo
- Expected delta
- $0/yr ($0/mo · -0.0%)
ⓘ Screening estimate from a state-policy table — verify with the county assessor before closing.
Climate risk First Street
- Flood 1/10 Low FEMA zone X (unshaded) · 0% chance over 30 yrs
- Wildfire 3/10 Moderate
- Heat 6/10 Major 7 d/yr ≥104°F today · 17 d/yr by 30 yrs out
- Wind 5/10 Major 25% chance of damaging wind over 30 yrs
- Air quality 3/10 Moderate 3 unhealthy d/yr today · 3 by 30 yrs out
Nearby sold comps map
Loading sold comps map…
Walkable amenities ~0.75 mi
Loading nearby amenities…
Taxation est. · year 1
- Rental income
- $22,761
- − Mortgage interest
- −$9,803
- − Property taxes
- −$2,948
- − Insurance
- −$875
- − Repairs & maintenance
- −$1,821
- − Management
- −$1,821
- − Depreciation
- −$5,091
- Taxable income
- $402
- Est. tax owed @ 24.0%
- −$97
- After-tax cash flow
- $3,049/yr
For passive investors: Depreciation is non-cash, so a rental often shows a tax loss while cash-flowing — sheltering income. Rental losses are passive: they offset passive income freely, and up to $25,000/yr can offset ordinary (W-2) income if you actively participate and your MAGI is under $100k (phasing out to $0 by $150k); unused losses carry forward. On sale, claimed depreciation is recaptured at up to 25%, and gains may owe capital-gains tax (a 1031 exchange can defer both). Figures are a year-1 estimate at your 24.0% rate — not tax advice; consult a CPA.
Schools (NCES district)
- District
- Gaston County Schools
- NCES district ID
- 3701620
- Math proficiency
- 44% ▲ 4.00%
- Reading proficiency
- 42% ▲ 1.00%
- Median HH income
- $43,644
- Composite
- 36.39/100
- National rank
- #4680
- State rank
- #93 of 178 in NC
Livability — Gastonia
- Score
- 59/100
- State rank
- #528
- US rank
- #19444
Category grades
Schools grade is shown separately in the Schools card above.
Census & demographics
- Census place
- Gastonia, NC
- County
- Gaston County · 201,497 people
- City population
- 114,179
- Metro
- Charlotte-Concord-Gastonia, NC-SC
- Population (ZIP)
- 36,200
- Household income
- $90,427
- Rent vs Own
- Severe rent burden
- 623.0
Population outlook (Gaston County) Hauer SSP2
- Today (2025)
- 230,027 people
- By 2030
- 237,300 · +3.2%
- By 2040
- 249,659 · +8.5%
- By 2050
- 257,806 · +12.1%
- By 2075
- 272,163 · +18.3%
- By 2100
- 268,652 · +16.8%
Race, ethnicity, and origin ACS 2023
- Neighborhood character
- Predominantly White (69%)
- Race & ethnicity
- White 69% Black 14% Hispanic / Latino 10% Two or more races 5% Asian 3%
- Hispanic origin (detail)
- Mexican 4% Puerto Rican 1%
- Common ancestry
- Serbian 4% Slovak 2% Italian 1%
- Foreign-born
- 7% · Canada, Jamaica
- Languages at home
- 89% English-only · Spanish 9% Other Asian/Pacific 1% Other Indo-European 1%
Political lean MEDSL · Gaston
- 2024 margin
- Strong R (+25.0) · D 37.0% · R 62.1%
- 2008→2024 swing
- 0.0pp no change · 2008: -25.0pp · 2024: -25.0pp
- All cycles
- 2024: R+25.0 2020: R+27.8 2016: R+32.1 2012: R+25.6 2008: R+25.0
Not yet ingested
- Civics
- —
Market trends
- HPI YoY
- ▼ -244.54%
- Current HPI
- 231.6479
- Rent YoY
- ▲ 1.94%
- Metro
- Charlotte-Concord-Gastonia, NC-SC
- State GDP YoY
- ▲ 3.28%
- F500 in state
- 26
Industry mix (Fortune 500 HQ in NC)
| Industry | F500 HQs | Revenue |
|---|---|---|
| Financial Services | 2 | $213B |
|
||
| Retail | 2 | $95B |
|
||
| Industrial Conglomerate | 1 | $38B |
|
||
| Metals / Steel | 1 | $35B |
|
||
| Utilities | 1 | $30B |
|
||
| Industrial Machinery | 1 | $19B |
|
||
Price history
+133.3% since first listed20 events — show timeline
- 2026-06-04 Listed $175,000 CANOPYMLS as Distributed by MLS Grid
- 2026-05-05 Contingent — CANOPYMLS as Distributed by MLS Grid
- 2026-04-16 Price Changed $175,000 CANOPYMLS as Distributed by MLS Grid
- 2026-04-16 Relisted — CANOPYMLS as Distributed by MLS Grid
- 2026-03-31 Contingent — CANOPYMLS as Distributed by MLS Grid
- 2026-03-02 Listed $200,000 CANOPYMLS as Distributed by MLS Grid
- 2026-02-13 Rental Removed $1,795 RENTLY
- 2025-12-03 Listed for Rent $1,795 RENTLY
- 2022-07-19 Sold (Public Records) $291,000 Public Records
- 2022-07-19 Sold (MLS) $291,000 CANOPYMLS as Distributed by MLS Grid
- 2022-06-18 Contingent — CANOPYMLS as Distributed by MLS Grid
- 2022-06-17 Listed $305,000 CANOPYMLS as Distributed by MLS Grid
- 2022-06-13 Coming Soon $305,000 CANOPYMLS as Distributed by MLS Grid
- 2021-06-07 Sold (Public Records) $210,500 Public Records
- 2021-06-07 Sold (MLS) $210,093 CANOPYMLS as Distributed by MLS Grid
- 2021-04-27 Contingent — CANOPYMLS as Distributed by MLS Grid
- 2021-04-24 Listed $184,793 CANOPYMLS as Distributed by MLS Grid
- 2021-04-21 Price Changed $184,793 CANOPYMLS as Distributed by MLS Grid
- 2021-04-21 Coming Soon $185,793 CANOPYMLS as Distributed by MLS Grid
- 2019-11-19 Sold (Public Records) $75,000 Public Records
Property tax history
+11.2%/yrLatest (2025): $2,948 · +0.0% YoY. Source: county tax records.
Cash-flow waterfall
monthlySold comps — $/sqft
last 12 mo · ≤1 miLoading sold comps…