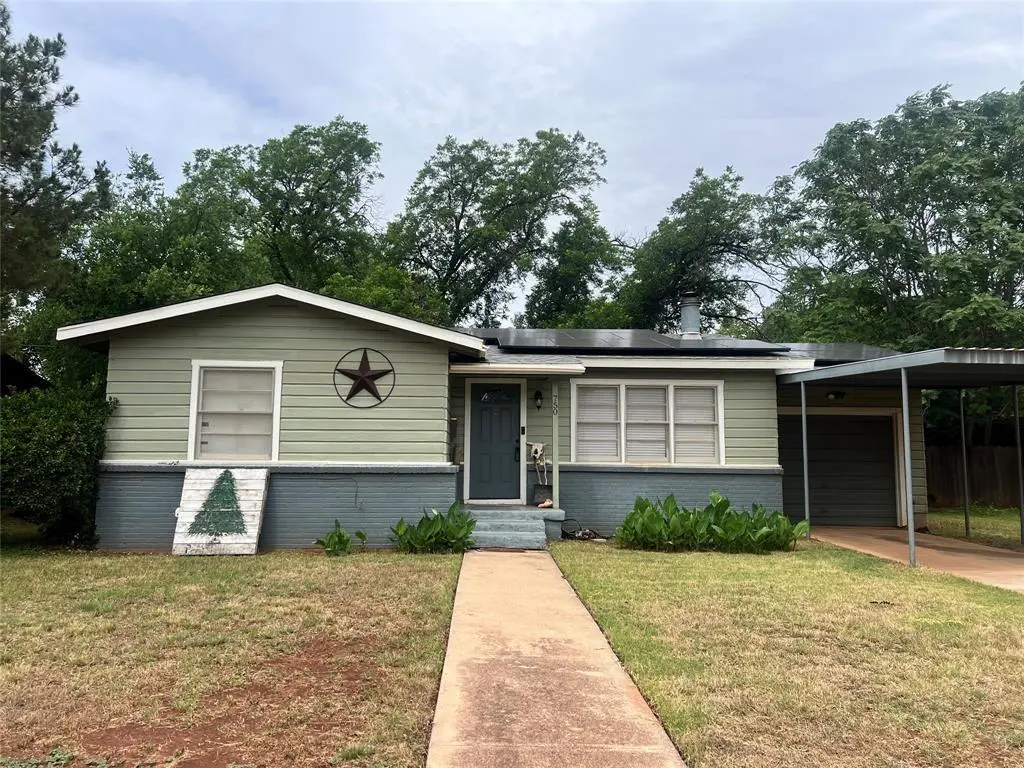
750 Peake St · Abilene, TX
Flood risk No data
- FEMA flood zone
- —
- Chance of flooding over 30 yrs
- —
- Est. flood insurance / yr
- —
Fire risk No data
- Est. fire insurance / yr
- —
Heat risk No data
- Hot days now (above threshold)
- —
- Hot days in 30 yrs
- —
Wind risk No data
- Chance of severe wind over 30 yrs
- —
Air-quality risk No data
- Unhealthy air days now
- —
- Unhealthy air days in 30 yrs
- —
Risk factors via First Street. Map © Google.
Why this score? — see what drove the D+ grade
The composite is a weighted blend of 9 inputs, each scored 0–100. Each bar is that input's sub-score; the figure is the points it added to the 100-point composite (weight × sub-score).
- Cash flow +20.5/30.0
- DSCR +6.5/10.0
- Rent growth +5.0/5.0
- 1% rule +4.6/10.0
- Livability +3.8/5.0
- Schools +2.8/10.0
- ARV discount +2.5/15.0
- Condition / age +2.5/5.0
- Appreciation +0.0/10.0
$190,000
🖨 Deal sheet 📄 Offer letter ✓ Due diligence
Listing remarks MLS
Huge Price Improvement! Motivated Seller! PLUS $3,000 Buyers ALLOWANCE Lovely spacious 2 bedroom1.5 bathroom home that boasts 2 living rooms and a corner brick wood burning fireplace for those cold or rainy evenings. Gorgeously updated kitchen with granite countertops, farm sink, tons of storage, pantry. The island has drawers, cabinets and an electrical outlet. Decorative lighting, barn door, all the matching appliances are included. Huge utility room with extra hidden storage compartments. Very well insulated attic! Ring system. Enclosed garage or mancave area thats big enough for motorcycle parking and has an entry door to the utility room. Front carport. Double gate to the big back yard. Large wired storage building that has windows on two sides and beautiful shade trees. This is a must see! PLEASE NOTE: The solar panels are NOT a separate contract. Please treat as clear. The new owner can sign up for use of the solar panels at their discretion.
Key facts
- 8,799 sq ft lot
- Parking
- Built 1955
Property features AI
Finance
- Other: Lot is less than 0.5 acre (approx. 0.202 acres); Subdivision: Westview Park Rep 2nd Filing
- Financial info: Treat as clear loan type; No second mortgage
- HOA & community: No association
Exterior
- Parking: Attached carport (covered, 1 space); Carport with 1 covered space
- Utilities: City water; City sewer; Electricity available; Cable available; Not in a municipal utility district; Paid-off solar panels available for use (mentioned in directions)
- Home design: Single family residence; Residential property; One story; Built in 1955; Enclosed garage (listed as enclosed garage offering storage and options)
- Construction: Brick and siding exterior; Composition roof; Pillar/post/pier foundation; Preowned home (1955)
- Exterior features: Privacy fenced backyard; Storage building
Interior
- Kitchen: Dishwasher; Disposal; Refrigerator; Granite counters; Eat-in kitchen; Pantry
- Bedrooms: 2 bedrooms (both on main level); Primary bedroom with ensuite bath
- Flooring: Vinyl; Wood
- Bathrooms: 1 full bathroom; 1 half bathroom
- Heating & cooling: Central heating (electric); Central air (electric)
- Interior features: Decorative lighting; Eat-in kitchen; Granite counters; High-speed internet available; Pantry; 5 total rooms; One level
Neighborhood map
What this means for you Summary
Snapshot
- This is a 2-bed/1.5-bath single-family listed at $190k.
Deal economics
- At list price, monthly cash flow is $249 ($3k/yr) — positive.
- The deal already cash-flows at list — no discount required.
- To meet the 1% rule (rent ≥ 1% of price), the offer needs to be $183k (3.5% below list).
- Recommended offer: $183k (3.5% below list) — sets the bar for 1% rule.
Location & tenants
- Location reads 75/100 on livability (#142 in TX, #4,037 nationally) — a middle-class / working-renter tenant base. Strengths: cost of living A+, housing A+, health & safety A+; Watch: schools D+, crime D, commute F.
- Abilene ISD (urban): math 32% / reading 34% proficiency, ranked #575 of 826 in TX (top 70%) — families likely to look elsewhere, expect single-tenant / working-renter base with shorter leases.
- Market conditions: Rents rising fast (+40.2%/yr); 86 active listings in the ZIP; 7 comparable units currently listed for rent nearby; rentals leasing fast (median 13d on market — plan ~1-2 weeks tenant-placement turnaround); 508 units permitted in Taylor County in 2024 (0 in 5+ unit buildings).
- This rent runs 41% of the median local income ($54k/yr) — at the standard rent-burdened threshold; future hikes will face affordability resistance.
Forward outlook
- Local home prices are declining (-3.0%/yr); year-one equity from $1k of loan paydown is wiped out by about $6k of value loss. Plan a longer hold.
- Taylor County population projected at +16% by 2050 — long-run rental-demand tailwind backs the buy-and-hold thesis.
- At projected returns (-3.0% appreciation + 8.0% rent growth), your $53k cash investment doubles in ~9 years — after that, you're playing with house money.
Negotiation context
- Only 1 days on market — expect competitive offers; lowballing is unlikely to land.
- 5 sale attempts since 19y ago with the ask held roughly flat each time — persistent listings suggest the price (not the market) is what's stuck; bring a comps-based counter.
Risks & watch-outs
- Watch-outs: built in 1955 — expect roof / HVAC / electrical / plumbing capex.
Questions for the listing agent
- Built in 1955 — when were the roof, HVAC, electrical panel, plumbing, and water heater last replaced?
- Is there a deadline driving the sale (1031 exchange, divorce, estate, relocation)? That informs how much negotiation room exists.
- Schools are D-rated, which usually means shorter tenancies and higher turnover. Who's the typical renter profile here, and what's been the actual vacancy rate?
- Crime grade is D in this area — have there been break-ins, vandalism, or insurance claims at this property in the last 3 years? What carrier currently insures it and at what premium?
- The area grade is low — what's the realistic commute time and amenity access for the typical tenant pool here? Any planned neighborhood developments (good or bad) we should know about?
- What's the average days-on-market for RENTAL listings here right now (not sales)? A rising rental-DOM trend means longer vacancies and softer asking-rent achievability than the comps imply.
- What's the recent tenant-quality profile in this submarket — average credit score on applications, eviction rate, late-payment / NSF rate, and stable-employment percentage? A property-management company in the area should have these aggregated.
- How much new for-sale + rental construction is in the pipeline within 1–3 miles? Heavy new supply typically softens prices + rents 12–24 months out; constrained supply supports both.
Investment metrics
- 1% rule
- 0.96% ✗
- Cap rate
- 7.87%
- Cash-on-cash
- 5.63%
- DSCR
- 1.25
- GRM
- 8.6
CMA / ARV
- ARV (on-the-fly)
- $171,112
- Comps found
- 12
Show comp detail 12 sales within ~0.75 mi
| Address | Dist | Beds/Ba | Sqft | Sold | Price | $/sf | Match |
|---|---|---|---|---|---|---|---|
| 650 N Willis St | 0.16mi | 2/1.0 | 1,157 (-1%) | 3mo | $169,500 | $146 | 86 |
| 3689 N 9th St | 0.23mi | 2/1.5 | 1,264 (+8%) | 3mo | $156,000 | $123 | 74 |
| 3549 N 11th St | 0.27mi | 3/2.0 (+1) | 1,236 (+6%) | 3mo | $219,999 | $178 | 69 |
| 617 Briarwood St | 0.38mi | 3/1.5 (+1) | 1,246 (+6%) | 0mo | $170,000 | $136 | 66 |
| 3884 Laurel Dr | 0.51mi | 3/1.5 (+1) | 1,150 (-2%) | 2mo | $145,000 | $126 | 66 |
| 3349 S 3rd St | 0.74mi | 2/2.0 | 1,136 (-3%) | 1mo | $170,500 | $150 | 58 |
| 1461 Glenhaven Dr | 0.68mi | 3/1.5 (+1) | 1,210 (+3%) | 2mo | $129,900 | $107 | 56 |
| 849 Green St | 0.69mi | 3/1.0 (+1) | 1,134 (-3%) | 1mo | $99,999 | $88 | 55 |
| 1448 Glenhaven Dr | 0.65mi | 3/1.5 (+1) | 1,272 (+8%) | 1mo | $199,900 | $157 | 50 |
| 1482 Briarwood St | 0.71mi | 3/1.0 (+1) | 1,102 (-6%) | 3mo | $165,000 | $150 | 47 |
| 3813 Laurel Dr | 0.44mi | 3/2.0 (+1) | 1,336 (+14%) | 3mo | $220,000 | $165 | 47 |
| 1010 Fannin St | 0.59mi | 3/1.0 (+1) | 1,344 (+15%) | 0mo | $166,500 | $124 | 41 |
Match score weights: distance 35% · size 25% · config 20% · recency 20%. Top-matched comps best support the ARV.
Projected returns pro-forma
-3.0% appreciation · 8.0% rent growth · sell at horizon
- IRR
- -2.5%
- Equity multiple
- 0.90×
- Total profit
- $-5,262
- Equity at exit
- $28,330
- IRR
- 11.7%
- Equity multiple
- 2.12×
- Total profit
- $59,777
- Equity at exit
- $16,428
Cash invested: $53,200 (down + closing). Projections, not guarantees.
Landlord ↔ Tenant lean methodology
- Overall (STATE)
- 87 Strongly Landlord-Friendly
- State Texas
- 87 Strongly Landlord-Friendly · R+5
- County
- — inherits STATE
- City
- — inherits STATE
ZIP-level market 79603
- Home prices YoY
- -32.5%
- Rents YoY
- 40.2%
- Active inventory
- 86
- Price-to-rent
- 8.6×
Monthly cashflow live
- Estimated rent
- $1,833 high interval (Pro) →
- Mortgage (P&I)
- −$996
- Tax from tax record
- −$123 /mo · $1,474/yr
- Insurance
- −$79
- HOA
- −$0
- Vacancy / Maint / Mgmt
- −$385
- Net cashflow
- $249
Break-even live
UW: 25.0% down · 7.5% · 30yr · 1.5% tax · 5.0% vac · 8.0% maint · 8.0% mgmt
Financing live
Cash to close
- Down payment
- $47,500
- Closing costs
- $5,700
- Reserves months
- —
- Total cash needed
- —
Loan-product check · same deal, 3 products live
Conventional
25% down · 7.5% · 30yr
- Down + closing
- —
- Monthly P&I
- —
- Monthly cashflow
- —
- DSCR
- —
- Eligible?
- —
Personal DTI + credit; lowest rate.
DSCR
20% down · 8.5% · 30yr
- Down + closing
- —
- Monthly P&I
- —
- Monthly cashflow
- —
- DSCR
- —
- Eligible?
- —
No personal income docs; deal must DSCR.
Hard money
10% down · 12.0% · 12mo
- Down + closing
- —
- Monthly P&I
- —
- Monthly cashflow
- —
- DSCR
- —
- Eligible?
- —
Short-term bridge; refi at stabilization.
Rent comps 7 comps
| Address | Beds | Baths | Sqft | Rent | $/sqft | DOM | Units | Dist |
|---|---|---|---|---|---|---|---|---|
| 234 Clyde St Abilene, TX | 3.0 | 1.0 | 998 | $1,995 | $2.00 | 13d | 1 | 0.63mi |
| 1685 N Willis St Abilene, TX | 3.0 | 2.0 | 1349 | $1,800 | $1.33 | 21d | 1 | 0.82mi |
| 1481 Burger St Abilene, TX | 3.0 | 2.0 | 1330 | $2,400 | $1.80 | 21d | 1 | 0.88mi |
| 735 Victoria St Abilene, TX | 1.0 | 1.0 | 1368 | $1,000 | $0.73 | 13d | 1 | 1.20mi |
| 1350 Lillius St Abilene, TX | 1.0 | 1.0 | 1076 | $2,000 | $1.86 | 13d | 1 | 1.21mi |
| 2410 N Willis St Abilene, TX | 2.0 | 1.0 | 864 | $1,200 | $1.39 | 43d | 1 | 1.39mi |
| 2498 Yorktown Dr Abilene, TX | 3.0 | 1.5 | 1104 | $1,795 | $1.63 | 13d | 1 | 1.43mi |
Listing history 1 events
-
2026-06-09$190,000 Pending 1 DOM
ⓘ Source: listings_history table (triggers on properties + properties_extension) + one-shot
backfill from property_details.listing_events for pre-trigger history.
Tax reassessment forecast TX · Resets to sale price
- Current annual tax
- $1,474 · $123/mo
- Projected year-2 tax
- $3,477 · $290/mo
- Expected delta
- +$2,003/yr (+$167/mo · 135.9%)
ⓘ Screening estimate from a state-policy table — verify with the county assessor before closing.
Nearby sold comps map
Loading sold comps map…
Walkable amenities ~0.75 mi
Loading nearby amenities…
Taxation est. · year 1
- Rental income
- $21,991
- − Mortgage interest
- −$10,643
- − Property taxes
- −$1,474
- − Insurance
- −$950
- − Repairs & maintenance
- −$1,759
- − Management
- −$1,759
- − Depreciation
- −$5,527
- Taxable loss
- −$121
- Est. tax savings @ 24.0%
- +$29
- After-tax cash flow
- $3,022/yr
For passive investors: Depreciation is non-cash, so a rental often shows a tax loss while cash-flowing — sheltering income. Rental losses are passive: they offset passive income freely, and up to $25,000/yr can offset ordinary (W-2) income if you actively participate and your MAGI is under $100k (phasing out to $0 by $150k); unused losses carry forward. On sale, claimed depreciation is recaptured at up to 25%, and gains may owe capital-gains tax (a 1031 exchange can defer both). Figures are a year-1 estimate at your 24.0% rate — not tax advice; consult a CPA.
Schools (NCES district)
- District
- Abilene ISD
- NCES district ID
- 4807440
- Math proficiency
- 32% ▼ -11.00%
- Reading proficiency
- 34% ▼ -5.00%
- Median HH income
- $39,782
- Composite
- 27.71/100
- National rank
- #6909
- State rank
- #575 of 826 in TX
Livability — Abilene
- Score
- 75/100
- State rank
- #142
- US rank
- #4037
Category grades
Schools grade is shown separately in the Schools card above.
Census & demographics
- Census place
- Abilene, TX
- County
- Taylor County · 136,672 people
- City population
- 136,672
- Metro
- Abilene, TX
- Population (ZIP)
- 23,548
- Household income
- $53,513
- Rent vs Own
- Severe rent burden
- 662.0
Population outlook (Taylor County) Hauer SSP2
- Today (2025)
- 145,270 people
- By 2030
- 150,050 · +3.3%
- By 2040
- 159,417 · +9.7%
- By 2050
- 168,883 · +16.3%
- By 2075
- 194,436 · +33.8%
- By 2100
- 203,163 · +39.9%
Race, ethnicity, and origin ACS 2023
- Neighborhood character
- Diverse neighborhood (Simpson 0.60)
- Race & ethnicity
- Hispanic / Latino 48% White 40% Two or more races 24% Black 8%
- Hispanic origin (detail)
- Mexican 44%
- Common ancestry
- Italian 2% Slovak 2% Portuguese 1%
- Foreign-born
- 9% · Canada
- Languages at home
- 73% English-only · Spanish 25%
Political lean MEDSL · Taylor
- 2024 margin
- Solid R (+49.8) · D 24.6% · R 74.4% · Other 1.0%
- 2008→2024 swing
- -4.2pp toward R · 2008: -45.6pp · 2024: -49.8pp
- All cycles
- 2024: R+49.8 2020: R+45.3 2016: R+51.1 2012: R+53.6 2008: R+45.6
Not yet ingested
- Civics
- —
Market trends
- HPI YoY
- ▼ -88.84%
- Current HPI
- 184.8875
- Rent YoY
- ▲ 40.19%
- Metro
- Abilene, TX
- State GDP YoY
- ▲ 3.95%
- F500 in state
- 110
Industry mix (Fortune 500 HQ in TX)
| Industry | F500 HQs | Revenue |
|---|---|---|
| Energy | 16 | $1,198B |
|
||
| Technology | 5 | $198B |
|
||
| Engineering / Construction | 4 | $72B |
|
||
| Energy Services | 3 | $60B |
|
||
| Utilities | 3 | $41B |
|
||
| Healthcare | 2 | $330B |
|
||
Price history
+181.5% since first listed19 events — show timeline
- 2026-06-08 Pending — NTREIS
- 2026-06-08 Listed $190,000 NTREIS
- 2025-10-14 Listing Removed — NTREIS
- 2025-10-10 Sold (MLS) — NTREIS
- 2025-10-09 Sold (Public Records) — Public Records
- 2025-09-13 Pending — NTREIS
- 2025-08-30 Contingent — NTREIS
- 2025-08-09 Price Changed $162,500 NTREIS
- 2025-06-20 Listed $167,500 NTREIS
- 2025-06-07 Listing Removed — NTREIS
- 2025-05-01 Price Changed $169,900 NTREIS
- 2025-02-07 Listed $172,000 NTREIS
- 2016-01-14 Listing Removed — NTREIS
- 2015-12-18 Listed $82,900 NTREIS
- 2007-06-15 Sold (Public Records) — Public Records
- 2007-06-15 Sold (MLS) — NTREIS
- 2007-05-17 Listing Removed — NTREIS
- 2007-03-24 Listed $67,500 NTREIS
- 2001-07-30 Sold (Public Records) — Public Records
Property tax history
-0.9%/yrLatest (2025): $1,474 · +8.3% YoY. Source: county tax records.
Cash-flow waterfall
monthlySold comps — $/sqft
last 12 mo · ≤1 miLoading sold comps…