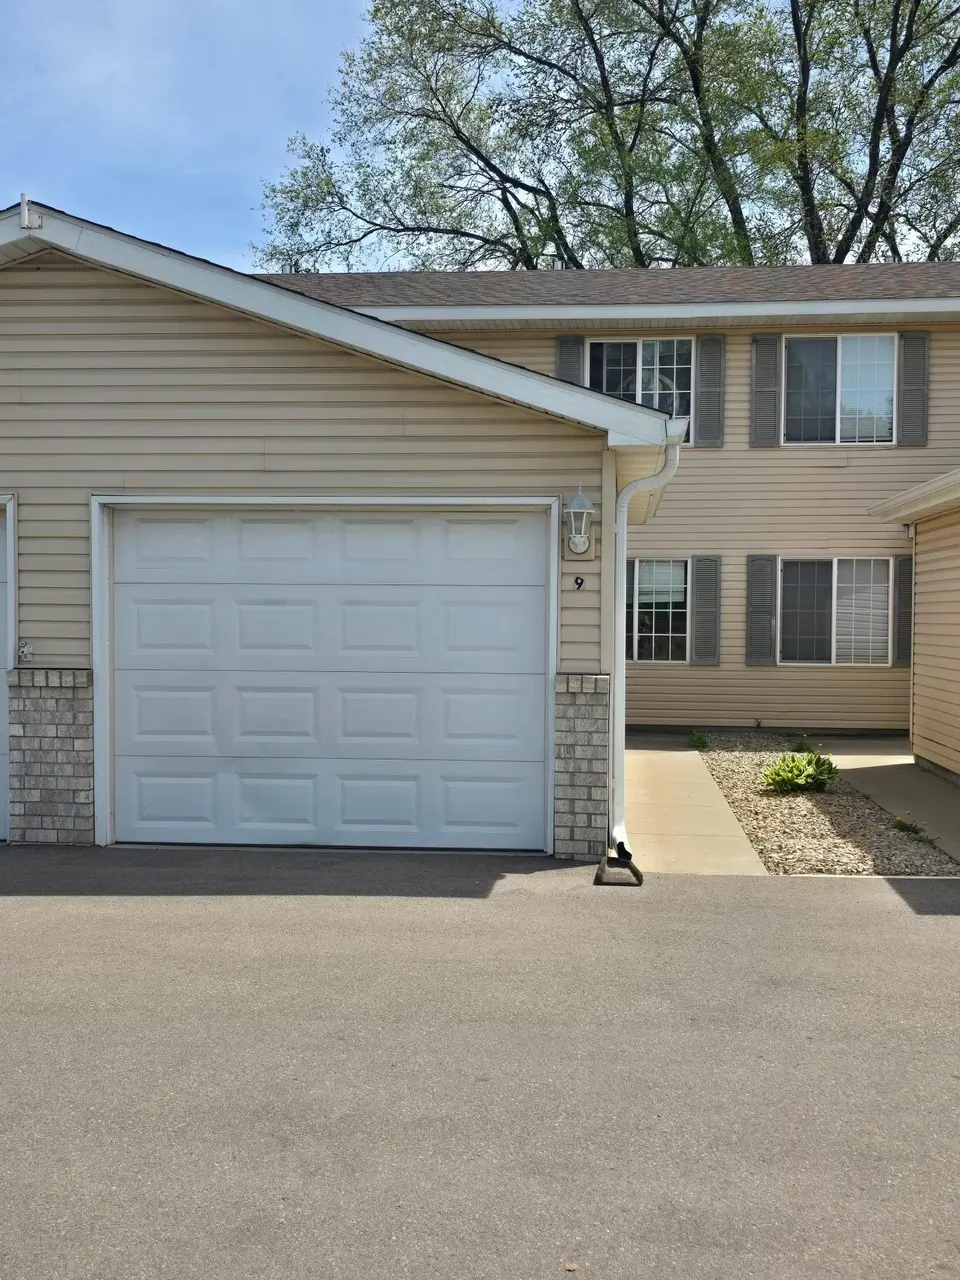
915 7th St #9 · Jordan, MN
Flood risk 1/10 · Minimal
- FEMA flood zone
- X (unshaded)
- Chance of flooding over 30 yrs
- 0.0%
- Est. flood insurance / yr
- $507 – $1,088
Fire risk 1/10 · Minimal
- Est. fire insurance / yr
- $888 – $1,650
Heat risk 2/10 · Minimal
- Hot days now (above 98°F)
- 7 days/yr
- Hot days in 30 yrs
- 14 days/yr
Wind risk 2/10 · Minimal
- Chance of severe wind over 30 yrs
- —
Air-quality risk 2/10 · Minimal
- Unhealthy air days now
- 1 days/yr
- Unhealthy air days in 30 yrs
- 1 days/yr
Risk factors via First Street. Map © Google.
Why this score? — see what drove the C grade
The composite is a weighted blend of 9 inputs, each scored 0–100. Each bar is that input's sub-score; the figure is the points it added to the 100-point composite (weight × sub-score).
- Cash flow +22.1/30.0
- 1% rule +7.9/10.0
- ARV discount +7.5/15.0
- DSCR +7.1/10.0
- Schools +4.6/10.0
- Livability +3.6/5.0
- Condition / age +2.8/5.0
- Rent growth +2.5/5.0
- Appreciation +0.0/10.0
$164,900
🖨 Deal sheet (PDF) 📄 Offer letter ✓ Due diligence
Listing remarks
Great price and value to own your property. Cheaper than most rental properties. This 2 Bedroom 1 Bath townhome is located on the outskirts of Jordan. Great access to County and State Highway. Quaint backyard patio, 1 car detached garage. Newer dishwasher and garage door opener. Association takes care of the lawn and snow plowing, for easier living.
Key facts
- Backyard patio
- Newer dishwasher
- Detached garage
Tags
Property features AI
Finance
- Other: Public-maintained road frontage on city street and county road; Lot is irregularly shaped (approximately 0.01 acres)
- Financial info: Property is free and clear (no mortgage indicated)
- HOA & community: Homeowners association managed by J&L Management/Jenni Carrier; Monthly HOA fee of $280 covering lawn care, grounds maintenance, parking, professional management, and snow removal
Exterior
- Parking: Detached-sounding footprint is not indicated; includes a 1-car garage with a 9' wide by 7' high garage door
- Utilities: City water (connected); City sewer (connected); Natural gas; Electric with circuit breakers
- Home design: Attached residential property; Two levels
- Construction: Frame construction; Slab foundation
- Exterior features: Vinyl exterior; Patio
Interior
- Kitchen: Kitchen on main level; Eat-in kitchen layout
- Bedrooms: Two bedrooms (both on upper level)
- Bathrooms: One full bathroom (upper level)
- Heating & cooling: Forced air heating; Central air conditioning
- Interior features: Eat-in kitchen; Upper-level full bathroom; No basement
- Laundry & utility: Laundry located in the kitchen
Neighborhood map
What this means for you Summary
Snapshot
- This is a 2-bed/1.0-bath townhouse listed at $165k. Condition is rated average.
Deal economics
- At list price, monthly cash flow is $264 ($3k/yr) — positive.
- The deal already cash-flows at list — no discount required.
- Meets the 1% rule at list price ($2k rent vs $165k).
- Recommended offer: $160k (3.0% below list) — sets the bar for market timing.
- Cap rate 8.2% vs local median 1.9% in Jordan — top-decile yield for the area; either an underpriced asset or a hidden risk that comps aren't pricing in. Stress-test before assuming the spread holds.
Location & tenants
- Location reads 71/100 on livability (#298 in MN) — a middle-class / working-renter tenant base. Strengths: crime A+, employment A+, housing A+; Watch: amenities F, commute F, health & safety F.
- Jordan Public School District (town): math 46% / reading 56% proficiency, ranked #79 of 301 in MN (top 26%) — acceptable for families but not a draw, mixed tenant base, ~2y average lease; only 18% free/reduced lunch — higher-income household profile.
- Market conditions: 155 active listings in the ZIP; 1 comparable units currently listed for rent nearby; 699 units permitted in Scott County in 2024 (84 in 5+ unit buildings).
Forward outlook
- Local home prices are declining (-3.0%/yr); year-one equity from $1k of loan paydown is wiped out by about $5k of value loss. Plan a longer hold.
- Scott County population projected at +31% by 2050 — long-run rental-demand tailwind backs the buy-and-hold thesis.
Negotiation context
- It's been on market 39 days — a 3% lower offer ($160k) is reasonable based on typical stale-listing flexibility.
Questions for the listing agent
- It's been on market 39 days. Have you received any prior offers? Is the seller open to a 3% concession, seller financing, or rate buy-down credit?
- What does the HOA fee cover, when was the last increase, and are there any pending special assessments or reserve-fund shortfalls?
- Is there a deadline driving the sale (1031 exchange, divorce, estate, relocation)? That informs how much negotiation room exists.
- Schools are A-rated — typically a magnet for longer-tenancy family renters. What's the average tenant stay here, and is there a school-zone premium baked into asking?
- What's the average days-on-market for RENTAL listings here right now (not sales)? A rising rental-DOM trend means longer vacancies and softer asking-rent achievability than the comps imply.
- What's the recent tenant-quality profile in this submarket — average credit score on applications, eviction rate, late-payment / NSF rate, and stable-employment percentage? A property-management company in the area should have these aggregated.
- How much new for-sale + rental construction is in the pipeline within 1–3 miles? Heavy new supply typically softens prices + rents 12–24 months out; constrained supply supports both.
Investment metrics
- 1% rule
- 1.29% ✓
- Cap rate
- 8.22%
- Cash-on-cash
- 6.87%
- DSCR
- 1.31
- GRM
- 6.4
CMA / ARV
No comps found within radius.
Projected returns pro-forma
-3.0% appreciation · 3.0% rent growth · sell at horizon
- IRR
- -5.6%
- Equity multiple
- 0.79×
- Total profit
- $-9,675
- Equity at exit
- $24,587
- IRR
- 4.2%
- Equity multiple
- 1.31×
- Total profit
- $14,092
- Equity at exit
- $14,258
Cash invested: $46,172 (down + closing). Projections, not guarantees.
Landlord ↔ Tenant lean methodology
- Overall (STATE)
- 46 Balanced
- State Minnesota
- 46 Balanced · D+2
- County
- — inherits STATE
- City
- — inherits STATE
ZIP-level market 55352
- Home prices YoY
- -22.8%
- Active inventory
- 155
- Price-to-rent
- 6.4×
Monthly cashflow live
- Estimated rent
- $2,132 medium interval (Pro) →
- Mortgage (P&I)
- −$865
- Tax est. 1.5%
- −$206 /mo · $2,474/yr
- Insurance
- −$69
- HOA
- −$280
- Vacancy / Maint / Mgmt
- −$448
- Net cashflow
- $264
Break-even live
Sensitivity live
| Price | -10% $378 | -5% $321 | +0% $264 | +5% $207 | +10% $150 |
|---|---|---|---|---|---|
| Rent | -10% $96 | -5% $180 | +0% $264 | +5% $349 | +10% $433 |
| Rate | -1.0pp $347 | -0.5pp $306 | base $264 | +0.5pp $222 | +1.0pp $178 |
UW: 25.0% down · 7.5% · 30yr · 1.5% tax · 5.0% vac · 8.0% maint · 8.0% mgmt
Financing live
Cash to close
- Down payment
- $41,225
- Closing costs
- $4,947
- Reserves months
- —
- Total cash needed
- —
Loan-product check · same deal, 3 products live
Conventional
25% down · 7.5% · 30yr
- Down + closing
- —
- Monthly P&I
- —
- Monthly cashflow
- —
- DSCR
- —
- Eligible?
- —
Personal DTI + credit; lowest rate.
DSCR
20% down · 8.5% · 30yr
- Down + closing
- —
- Monthly P&I
- —
- Monthly cashflow
- —
- DSCR
- —
- Eligible?
- —
No personal income docs; deal must DSCR.
Hard money
10% down · 12.0% · 12mo
- Down + closing
- —
- Monthly P&I
- —
- Monthly cashflow
- —
- DSCR
- —
- Eligible?
- —
Short-term bridge; refi at stabilization.
Rent comps 1 comps
| Address | Beds | Baths | Sqft | Rent | $/sqft | DOM | Units | Dist |
|---|---|---|---|---|---|---|---|---|
| 201 Eldorado Dr Jordan, MN | 3.0 | 1.0–2.0 | 952 | $2,132 | $2.24 | 0d | 1 | 0.58mi |
HOA detail
- Monthly dues
- $280 · $3,360/yr
- Likely covers
- snow removal
Listing history 16 events
-
2026-06-21days on market $164,900 Active 39 DOM
-
2026-06-18days on market $164,900 Active 36 DOM
-
2026-06-17days on market $164,900 Active 35 DOM
-
2026-06-16days on market $164,900 Active 34 DOM
-
2026-06-15days on market $164,900 Active 33 DOM
-
2026-06-13days on market $164,900 Active 31 DOM
-
2026-06-13days on market $164,900 Active 30 DOM
-
2026-06-09days on market $164,900 Active 27 DOM
-
2026-06-08days on market $164,900 Active 26 DOM
-
2026-06-07days on market $164,900 Active 25 DOM
-
2026-06-04days on market $164,900 Active 22 DOM
-
2026-06-03days on market $164,900 Active 21 DOM
-
2026-06-02days on market $164,900 Active 20 DOM
-
2026-06-01days on market $164,900 Active 19 DOM
-
2026-05-31days on market $164,900 Active 18 DOM
-
2026-05-13$164,900 Active 357-char remark
ⓘ Source: listings_history table (triggers on properties + properties_extension) + one-shot
backfill from property_details.listing_events for pre-trigger history.
Climate risk First Street
- Flood 1/10 Low FEMA zone X (unshaded) · 0% chance over 30 yrs
- Wildfire 1/10 Low
- Heat 2/10 Low 7 d/yr ≥98°F today · 14 d/yr by 30 yrs out
- Wind 2/10 Low
- Air quality 2/10 Low 1 unhealthy d/yr today · 1 by 30 yrs out
Nearby sold comps map
Loading sold comps map…
Walkable amenities ~0.75 mi
Loading nearby amenities…
Taxation est. · year 1
- Rental income
- $25,580
- − Mortgage interest
- −$9,237
- − Property taxes
- −$2,474
- − Insurance
- −$824
- − Repairs & maintenance
- −$2,046
- − Management
- −$2,046
- − HOA
- −$3,360
- − Depreciation
- −$4,797
- Taxable income
- $795
- Est. tax owed @ 24.0%
- −$191
- After-tax cash flow
- $2,982/yr
For passive investors: Depreciation is non-cash, so a rental often shows a tax loss while cash-flowing — sheltering income. Rental losses are passive: they offset passive income freely, and up to $25,000/yr can offset ordinary (W-2) income if you actively participate and your MAGI is under $100k (phasing out to $0 by $150k); unused losses carry forward. On sale, claimed depreciation is recaptured at up to 25%, and gains may owe capital-gains tax (a 1031 exchange can defer both). Figures are a year-1 estimate at your 24.0% rate — not tax advice; consult a CPA.
Condition & rehab AI · 15 photos
This townhouse requires moderate renovations to improve its condition and increase its value. Key areas for improvement include the kitchen and bathroom, as well as the exterior siding. Fresh paint and updated fixtures would significantly enhance the home's curb appeal and interior aesthetics.
Repairs flagged
- Moderate kitchen cabinets — dated and in need of updating
- Moderate bathroom fixtures — dated and in need of updating
- Minor exterior siding — moderate wear
Value-add opportunities
- Both paint interior walls — fresh paint enhances curb appeal and interior aesthetics
- Both replace kitchen cabinets — new cabinets improve functionality and aesthetics
- Both replace bathroom fixtures — new fixtures enhance functionality and aesthetics
- Both repair exterior siding — repairing siding improves curb appeal and structural integrity
Renovation cost estimate screening
| Repair item | Severity | Est. cost |
|---|---|---|
| kitchen cabinets · dated and in need of updating | Moderate | $3,000–15,000 |
| bathroom fixtures · dated and in need of updating | Moderate | $3,000–15,000 |
| exterior siding · moderate wear | Minor | $500–3,000 |
| Total estimated repair cost · 3 items | $6,500–33,000 |
Value-add ROI direction
- Both paint interior walls — fresh paint enhances curb appeal and interior aesthetics ↑
- Both replace kitchen cabinets — new cabinets improve functionality and aesthetics ↑
- Both replace bathroom fixtures — new fixtures enhance functionality and aesthetics ↑
- Both repair exterior siding — repairing siding improves curb appeal and structural integrity ↑
ⓘ Cost ranges are severity-bucket heuristics (US national rule-of-thumb). Get contractor quotes + a written scope before underwriting a rehab budget.
Schools (NCES district)
- District
- Jordan Public School District
- NCES district ID
- 2715750
- Math proficiency
- 46% ▼ -15.00%
- Reading proficiency
- 56% ▼ -11.00%
- Median HH income
- $75,573
- Composite
- 46.02/100
- National rank
- #2529
- State rank
- #79 of 301 in MN
Livability — Jordan
- Score
- 71/100
- State rank
- #298
- US rank
- #6527
Category grades
Schools grade is shown separately in the Schools card above.
Census & demographics
- Census place
- Jordan, MN
- Population (ZIP)
- 10,426
Population outlook (Scott County) Hauer SSP2
- Today (2025)
- 165,899 people
- By 2030
- 177,290 · +6.9%
- By 2040
- 199,019 · +20.0%
- By 2050
- 216,883 · +30.7%
- By 2075
- 256,099 · +54.4%
- By 2100
- 276,434 · +66.6%
Race, ethnicity, and origin ACS 2023
- Neighborhood character
- Predominantly White (89%)
- Race & ethnicity
- White 89% Two or more races 6% Hispanic / Latino 5% Black 1%
- Common ancestry
- Portuguese 8% Slovak 6% Scottish 3%
- Foreign-born
- 5% · Canada, Jamaica
- Languages at home
- 94% English-only · Russian/Polish/Slavic 2% Spanish 2% Chinese 1%
Political lean MEDSL · Scott
- 2024 margin
- Lean R (+8.5) · D 44.8% · R 53.3% · Other 1.9%
- 2008→2024 swing
- +2.7pp toward D · 2008: -11.2pp · 2024: -8.5pp
- All cycles
- 2024: R+8.5 2020: R+6.6 2016: R+15.4 2012: R+14.8 2008: R+11.2
Not yet ingested
- Civics
- —
Market trends
- HPI YoY
- ▼ -77.66%
- Current HPI
- 263.7813
- Rent YoY
- —
- Metro
- —
- State GDP YoY
- ▲ 2.41%
- F500 in state
- 34
Industry mix (Fortune 500 HQ in MN)
| Industry | F500 HQs | Revenue |
|---|---|---|
| Healthcare | 2 | $407B |
|
||
| Retail | 2 | $150B |
|
||
| Consumer Goods | 2 | $32B |
|
||
| Industrial Machinery | 2 | $6B |
|
||
| Agriculture | 1 | $40B |
|
||
| Healthcare / Medical Devices | 1 | $32B |
|
||
Price history
1 event — show timeline
- 2026-05-13 Listed $164,900 NORTHSTARMLS as Distributed by MLS Grid
Cash-flow waterfall
monthlySold comps — $/sqft
last 12 mo · ≤1 miLoading sold comps…