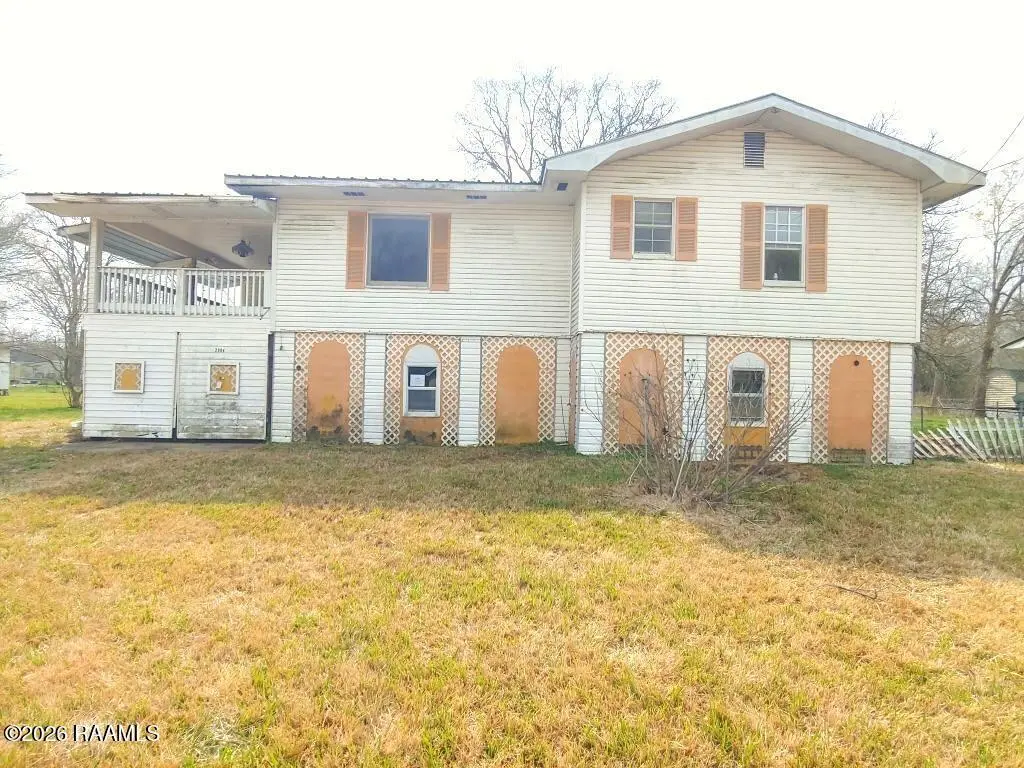
2904 Pine St · Abbeville, LA
Flood risk 9/10 · Severe
- FEMA flood zone
- AE
- Chance of flooding over 30 yrs
- 0.99%
- Est. flood insurance / yr
- $1,737 – $8,500
Fire risk 1/10 · Minimal
- Est. fire insurance / yr
- $1,269 – $2,357
Heat risk 10/10 · Severe
- Hot days now (above 109°F)
- 7 days/yr
- Hot days in 30 yrs
- 21 days/yr
Wind risk 9/10 · Severe
- Chance of severe wind over 30 yrs
- 99.0%
Air-quality risk 1/10 · Minimal
- Unhealthy air days now
- 0 days/yr
- Unhealthy air days in 30 yrs
- 0 days/yr
Risk factors via First Street. Map © Google.
Why this score? — see what drove the C- grade
The composite is a weighted blend of 9 inputs, each scored 0–100. Each bar is that input's sub-score; the figure is the points it added to the 100-point composite (weight × sub-score).
- Cash flow +15.0/30.0
- ARV discount +15.0/15.0
- 1% rule +5.0/10.0
- DSCR +5.0/10.0
- Schools +3.9/10.0
- Livability +3.4/5.0
- Rent growth +2.5/5.0
- Condition / age +2.5/5.0
- Appreciation +0.0/10.0
$29,000
🖨 Deal sheet 📄 Offer letter ✓ Due diligence
Listing remarks
Welcome to this two bedroom elevated home. The living room is open to the kitchen. The ground level is enclosed and includes a half bath. Features an exterior elevator. Wonderful porch and covered patios. Some photos have been virtually staged for demonstration purposes only.
Key facts
- 0.25 acre lot
- Parking
- Listed 16 days
Neighborhood map
What this means for you Summary
Snapshot
- This is a 2-bed/1.0-bath single-family listed at $29k.
Deal economics
- At list price, monthly cash flow is $512 ($6k/yr) — positive.
- The deal already cash-flows at list — no discount required.
- Meets the 1% rule at list price ($1k rent vs $29k).
- Recommended offer: $29k (1.5% below list) — sets the bar for market timing.
- Cap rate 45.1% vs local median 6.6% in Abbeville — top-decile yield for the area; either an underpriced asset or a hidden risk that comps aren't pricing in. Stress-test before assuming the spread holds.
Location & tenants
- Location reads 68/100 on livability (#94 in LA) — a middle-class / working-renter tenant base. Strengths: cost of living A+, housing A+, health & safety A+; Watch: crime F, amenities F, commute F.
- Vermilion Parish (town): math 40% / reading 53% proficiency, ranked #15 of 98 in LA (top 15%) — families likely to look elsewhere, expect single-tenant / working-renter base with shorter leases.
- Zoned schools: James A. Herod Elementary School (math 14% / reading 29%, grade F, #434 of 646 statewide, top 68%, 340 students, 90% FRL); Abbeville High School (math 12% / reading 32%, grade F, #171 of 265 statewide, top 66%, 607 students, 81% FRL) — zoned schools average 85% FRL vs 53% district-wide (32 pts higher); higher-poverty schools than district average — tighter screening recommended.
- Zoned-school proficiency averages 22% at this address vs 46% district-wide (-25 pts) — the specific schools serving this property underperform the Vermilion Parish average; the district grade overstates school quality for this exact location.
- Market conditions: 180 active listings in the ZIP; 228 units permitted in Vermilion Parish in 2024 (0 in 5+ unit buildings).
Forward outlook
- Local home prices are declining (-3.0%/yr); year-one equity from $200 of loan paydown is wiped out by about $870 of value loss. Plan a longer hold.
- Vermilion County population projected at +10% by 2050 — modest demand growth; plan on rents tracking national, not racing it.
- At projected returns (-3.0% appreciation + 3.0% rent growth), your $8k cash investment doubles in ~2 years — after that, you're playing with house money.
Negotiation context
- It's been on market 16 days — a 2% lower offer ($29k) is reasonable based on typical stale-listing flexibility.
Risks & watch-outs
- Watch-outs: flood insurance adds $427/mo.
- Climate carrying-cost: in FEMA flood zone AE (mandatory federal flood insurance); severe wind risk, 99% chance of damaging wind over 30y; extreme-heat days projected 7→21/yr by 2055 (HVAC capex compounding) — expect insurance premiums to compound above CPI over the hold.
Questions for the listing agent
- What's the actual annual flood-insurance premium (NFIP or private), and is the property in a SFHA with mandatory coverage?
- Is there a deadline driving the sale (1031 exchange, divorce, estate, relocation)? That informs how much negotiation room exists.
- Schools are B-rated — typically a magnet for longer-tenancy family renters. What's the average tenant stay here, and is there a school-zone premium baked into asking?
- Crime grade is F in this area — have there been break-ins, vandalism, or insurance claims at this property in the last 3 years? What carrier currently insures it and at what premium?
- What's the average days-on-market for RENTAL listings here right now (not sales)? A rising rental-DOM trend means longer vacancies and softer asking-rent achievability than the comps imply.
- What's the recent tenant-quality profile in this submarket — average credit score on applications, eviction rate, late-payment / NSF rate, and stable-employment percentage? A property-management company in the area should have these aggregated.
- How much new for-sale + rental construction is in the pipeline within 1–3 miles? Heavy new supply typically softens prices + rents 12–24 months out; constrained supply supports both.
Investment metrics
- 1% rule
- 4.95% ✓
- Cap rate
- 45.13%
- Cash-on-cash
- 138.71%
- DSCR
- 7.17
- GRM
- 1.7
CMA / ARV
- ARV (on-the-fly)
- $35,680
- Comps found
- 1
Show comp detail 1 sale within ~0.75 mi
| Address | Dist | Beds/Ba | Sqft | Sold | Price | $/sf | Match |
|---|---|---|---|---|---|---|---|
| 2904 Pine St | 0.00mi | 2/1.0 | 1,115 (0%) | 1mo | $35,500 | $32 | 99 |
Match score weights: distance 35% · size 25% · config 20% · recency 20%. Top-matched comps best support the ARV.
Projected returns pro-forma
-3.0% appreciation · 3.0% rent growth · sell at horizon
- IRR
- 75.9%
- Equity multiple
- 4.47×
- Total profit
- $28,194
- Equity at exit
- $4,324
- IRR
- 79.7%
- Equity multiple
- 9.34×
- Total profit
- $67,687
- Equity at exit
- $2,507
Cash invested: $8,120 (down + closing). Projections, not guarantees.
Landlord ↔ Tenant lean methodology
- Overall (STATE)
- 90 Strongly Landlord-Friendly
- State Louisiana
- 90 Strongly Landlord-Friendly · R+12
- County
- — inherits STATE
- City
- — inherits STATE
ZIP-level market 70510
- Active inventory
- 180
- Price-to-rent
- 1.7×
Monthly cashflow live
- Estimated rent
- $1,437 medium interval (Pro) →
- Mortgage (P&I)
- −$152
- Tax from tax record
- −$32 /mo · $387/yr
- Insurance
- −$12
- Flood insurance flood zone
- −$427 /mo · $5,118/yr
- HOA
- −$0
- Vacancy / Maint / Mgmt
- −$302
- Net cashflow
- $512
Break-even live
UW: 25.0% down · 7.5% · 30yr · 1.5% tax · 5.0% vac · 8.0% maint · 8.0% mgmt
Financing live
Cash to close
- Down payment
- $7,250
- Closing costs
- $870
- Reserves months
- —
- Total cash needed
- —
Loan-product check · same deal, 3 products live
Conventional
25% down · 7.5% · 30yr
- Down + closing
- —
- Monthly P&I
- —
- Monthly cashflow
- —
- DSCR
- —
- Eligible?
- —
Personal DTI + credit; lowest rate.
DSCR
20% down · 8.5% · 30yr
- Down + closing
- —
- Monthly P&I
- —
- Monthly cashflow
- —
- DSCR
- —
- Eligible?
- —
No personal income docs; deal must DSCR.
Hard money
10% down · 12.0% · 12mo
- Down + closing
- —
- Monthly P&I
- —
- Monthly cashflow
- —
- DSCR
- —
- Eligible?
- —
Short-term bridge; refi at stabilization.
Listing history 2 events
-
2026-04-15status Pending
-
2026-03-30$29,000 Active
ⓘ Source: listings_history table (triggers on properties + properties_extension) + one-shot
backfill from property_details.listing_events for pre-trigger history.
Tax reassessment forecast LA · Resets to sale price
- Current annual tax
- $387 · $32/mo
- Projected year-2 tax
- $387 · $32/mo
- Expected delta
- $0/yr ($0/mo · 0.0%)
ⓘ Screening estimate from a state-policy table — verify with the county assessor before closing.
Climate risk First Street
- Flood 9/10 Extreme FEMA zone AE · 99% chance over 30 yrs
- Wildfire 1/10 Low
- Heat 10/10 Extreme 7 d/yr ≥109°F today · 21 d/yr by 30 yrs out
- Wind 9/10 Extreme 99% chance of damaging wind over 30 yrs
- Air quality 1/10 Low 0 unhealthy d/yr today · 0 by 30 yrs out
Nearby sold comps map
Loading sold comps map…
Walkable amenities ~0.75 mi
Loading nearby amenities…
Taxation est. · year 1
- Rental income
- $17,241
- − Mortgage interest
- −$1,624
- − Property taxes
- −$387
- − Insurance
- −$5,264
- − Repairs & maintenance
- −$1,379
- − Management
- −$1,379
- − Depreciation
- −$844
- Taxable income
- $6,363
- Est. tax owed @ 24.0%
- −$1,527
- After-tax cash flow
- $4,617/yr
For passive investors: Depreciation is non-cash, so a rental often shows a tax loss while cash-flowing — sheltering income. Rental losses are passive: they offset passive income freely, and up to $25,000/yr can offset ordinary (W-2) income if you actively participate and your MAGI is under $100k (phasing out to $0 by $150k); unused losses carry forward. On sale, claimed depreciation is recaptured at up to 25%, and gains may owe capital-gains tax (a 1031 exchange can defer both). Figures are a year-1 estimate at your 24.0% rate — not tax advice; consult a CPA.
Schools (NCES district)
- District
- Vermilion Parish
- NCES district ID
- 2201800
- Math proficiency
- 40% ▼ -38.00%
- Reading proficiency
- 53% ▼ -32.00%
- Median HH income
- $45,115
- Composite
- 39.37/100
- National rank
- #3974
- State rank
- #15 of 98 in LA
Livability — Abbeville
- Score
- 68/100
- State rank
- #94
- US rank
- #9800
Category grades
Schools grade is shown separately in the Schools card above.
Census & demographics
- Population (ZIP)
- 23,909
Population outlook (Vermilion County) Hauer SSP2
- Today (2025)
- 64,095 people
- By 2030
- 65,915 · +2.8%
- By 2040
- 68,985 · +7.6%
- By 2050
- 70,804 · +10.5%
- By 2075
- 73,897 · +15.3%
- By 2100
- 71,793 · +12.0%
Race, ethnicity, and origin ACS 2023
- Neighborhood character
- Majority White (65%)
- Race & ethnicity
- White 65% Black 24% Two or more races 4% Hispanic / Latino 4% Asian 4%
- Common ancestry
- Lithuanian 15% Italian 1%
- Foreign-born
- 5% · Vietnam, Canada
- Languages at home
- 87% English-only · French/Haitian/Cajun 6% Vietnamese 3% Spanish 2%
Political lean MEDSL · Vermilion
- 2024 margin
- Solid R (+63.8) · D 17.6% · R 81.4% · Other 1.1%
- 2008→2024 swing
- -16.3pp toward R · 2008: -47.5pp · 2024: -63.8pp
- All cycles
- 2024: R+63.8 2020: R+61.9 2016: R+59.6 2012: R+52.8 2008: R+47.5
Not yet ingested
- Civics
- —
Market trends
- HPI YoY
- ▼ -70.44%
- Current HPI
- 97.6131
- Rent YoY
- —
- Metro
- —
- State GDP YoY
- ▲ 3.29%
- F500 in state
- 10
Industry mix (Fortune 500 HQ in LA)
| Industry | F500 HQs | Revenue |
|---|---|---|
| Telecommunications | 2 | $23B |
|
||
| Utilities | 1 | $12B |
|
||
| Wholesale / Distribution | 1 | $5B |
|
||
| Advertising | 1 | $2B |
|
||
Price history
2 events — show timeline
- 2026-04-15 Pending — AcadianaMLS
- 2026-03-30 Listed $29,000 AcadianaMLS
Property tax history
+0.7%/yrLatest (2025): $387 · -0.3% YoY. Source: county tax records.
Cash-flow waterfall
monthlySold comps — $/sqft
last 12 mo · ≤1 miLoading sold comps…