415 W 9th St · Maryville, MO
Flood risk 1/10 · Minimal
- FEMA flood zone
- X (unshaded)
- Chance of flooding over 30 yrs
- 0.0%
- Est. flood insurance / yr
- $507 – $1,088
Fire risk 3/10 · Minor
- Est. fire insurance / yr
- $1,054 – $1,958
Heat risk 3/10 · Minor
- Hot days now (above 105°F)
- 7 days/yr
- Hot days in 30 yrs
- 15 days/yr
Wind risk 2/10 · Minimal
- Chance of severe wind over 30 yrs
- —
Air-quality risk 2/10 · Minimal
- Unhealthy air days now
- 1 days/yr
- Unhealthy air days in 30 yrs
- 1 days/yr
Risk factors via First Street. Map © Google.
Why this score? — see what drove the D grade
The composite is a weighted blend of 9 inputs, each scored 0–100. Each bar is that input's sub-score; the figure is the points it added to the 100-point composite (weight × sub-score).
- Cash flow +14.6/30.0
- ARV discount +7.5/15.0
- DSCR +4.4/10.0
- Livability +4.0/5.0
- Schools +3.9/10.0
- 1% rule +3.0/10.0
- Rent growth +2.5/5.0
- Condition / age +2.5/5.0
- Appreciation +0.0/10.0
$149,000
🖨 Deal sheet 📄 Offer letter ✓ Due diligence
Listing remarks
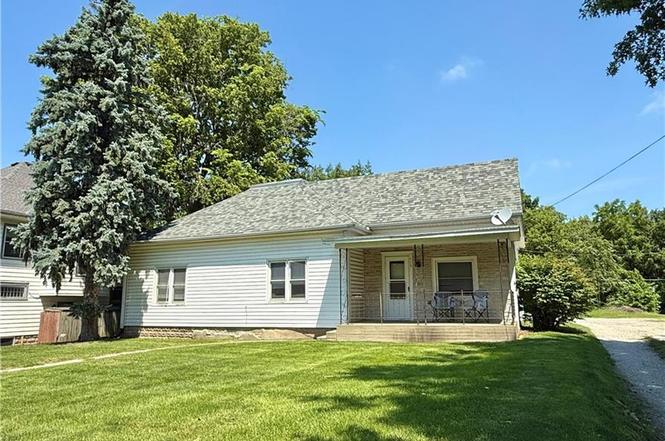
Check out this charming, well-maintained 3-bedroom, 1-bath home that is currently leased through April 30, 2027 at $1,325/month, offering solid cash flow from day one. Conveniently located just steps from NWMSU and local parks, it’s ideal for student housing, long-term rental, or future owner-occupancy. Features include a newer roof, covered front porch, and a large, spacious lot! Whether you’re an investor looking to expand your portfolio or planning ahead for your first home, this property checks the boxes! Schedule your private viewing today!
Key facts
- Covered front porch
- Large spacious lot
- Newer roof
Tags
Property features AI
Exterior
- Parking: Other parking
- Utilities: Public water; Public sewer
- Home design: Single-family residence; Bungalow floor plan; Residential property
- Construction: Vinyl siding; Composition roof; Approximately 101+ years old
- Exterior features: Covered patio; Lot roughly 67 x 245 (16,553 sq ft)
Interior
- Kitchen: Electric range; Dishwasher; Refrigerator
- Bedrooms: Three bedrooms on the main level
- Bathrooms: One full bathroom
- Heating & cooling: Natural gas heating; Electric cooling (has cooling)
- Interior features: Dishwasher; Dryer; Refrigerator; Electric range; Washer; Crawl space/partial basement
- Laundry & utility: Washer and dryer included
Neighborhood map
What this means for you Summary
Snapshot
- This is a 3-bed/1.0-bath other listed at $149k.
Deal economics
- At list price, monthly cash flow is $35 ($416/yr) — positive.
- The deal already cash-flows at list — no discount required.
- To meet the 1% rule (rent ≥ 1% of price), the offer needs to be $120k (19.5% below list).
- Recommended offer: $120k (19.5% below list) — sets the bar for 1% rule.
- Cap rate 6.6% vs local median 4.2% in Maryville — top-decile yield for the area; either an underpriced asset or a hidden risk that comps aren't pricing in. Stress-test before assuming the spread holds.
Location & tenants
- Location reads 79/100 on livability (#23 in MO, #2,122 nationally) — a middle-class / working-renter tenant base. Strengths: cost of living A+, health & safety A+, housing B+; Watch: employment D, commute F.
- Maryville R-II (town): math 42% / reading 53% proficiency, ranked #79 of 324 in MO (top 24%) — families likely to look elsewhere, expect single-tenant / working-renter base with shorter leases.
- Market conditions: 132 active listings in the ZIP; 49 units permitted in Nodaway County in 2024 (0 in 5+ unit buildings).
Forward outlook
- Local home prices are declining (-3.0%/yr); year-one equity from $1k of loan paydown is wiped out by about $4k of value loss. Plan a longer hold.
- Nodaway County population projected at -13% by 2050 — secular population decline; favor cash flow + early exit over multi-decade hold.
Negotiation context
- It's been on market 297 days — a 12% lower offer ($131k) is reasonable based on typical stale-listing flexibility.
Risks & watch-outs
- Watch-outs: built in 1890 — expect roof / HVAC / electrical / plumbing capex.
Questions for the listing agent
- It's been on market 297 days. Have you received any prior offers? Is the seller open to a 20% concession, seller financing, or rate buy-down credit?
- Built in 1890 — when were the roof, HVAC, electrical panel, plumbing, and water heater last replaced?
- Why hasn't it sold? Are there any deal-killer items the seller is aware of (foundation, flood, title, zoning, code violations)?
- Is there a deadline driving the sale (1031 exchange, divorce, estate, relocation)? That informs how much negotiation room exists.
- Schools are B-rated — typically a magnet for longer-tenancy family renters. What's the average tenant stay here, and is there a school-zone premium baked into asking?
- The area grade is low — what's the realistic commute time and amenity access for the typical tenant pool here? Any planned neighborhood developments (good or bad) we should know about?
- What's the average days-on-market for RENTAL listings here right now (not sales)? A rising rental-DOM trend means longer vacancies and softer asking-rent achievability than the comps imply.
- What's the recent tenant-quality profile in this submarket — average credit score on applications, eviction rate, late-payment / NSF rate, and stable-employment percentage? A property-management company in the area should have these aggregated.
- How much new for-sale + rental construction is in the pipeline within 1–3 miles? Heavy new supply typically softens prices + rents 12–24 months out; constrained supply supports both.
Investment metrics
- 1% rule
- 0.80% ✗
- Cap rate
- 6.57%
- Cash-on-cash
- 1.00%
- DSCR
- 1.04
- GRM
- 10.4
CMA / ARV
No comps found within radius.
Projected returns pro-forma
-3.0% appreciation · 3.0% rent growth · sell at horizon
- IRR
- -14.8%
- Equity multiple
- 0.47×
- Total profit
- $-21,992
- Equity at exit
- $22,216
- IRR
- -6.2%
- Equity multiple
- 0.60×
- Total profit
- $-16,528
- Equity at exit
- $12,883
Cash invested: $41,720 (down + closing). Projections, not guarantees.
Landlord ↔ Tenant lean methodology
- Overall (STATE)
- 81 Strongly Landlord-Friendly
- State Missouri
- 81 Strongly Landlord-Friendly · R+10
- County
- — inherits STATE
- City
- — inherits STATE
ZIP-level market 64468
- Home prices YoY
- -25.4%
- Active inventory
- 132
- Price-to-rent
- 10.4×
Monthly cashflow live
- Estimated rent
- $1,199 medium interval (Pro) →
- Mortgage (P&I)
- −$781
- Tax from tax record
- −$69 /mo · $832/yr
- Insurance
- −$62
- HOA
- −$0
- Vacancy / Maint / Mgmt
- −$252
- Net cashflow
- $35
Break-even live
UW: 25.0% down · 7.5% · 30yr · 1.5% tax · 5.0% vac · 8.0% maint · 8.0% mgmt
Financing live
Cash to close
- Down payment
- $37,250
- Closing costs
- $4,470
- Reserves months
- —
- Total cash needed
- —
Loan-product check · same deal, 3 products live
Conventional
25% down · 7.5% · 30yr
- Down + closing
- —
- Monthly P&I
- —
- Monthly cashflow
- —
- DSCR
- —
- Eligible?
- —
Personal DTI + credit; lowest rate.
DSCR
20% down · 8.5% · 30yr
- Down + closing
- —
- Monthly P&I
- —
- Monthly cashflow
- —
- DSCR
- —
- Eligible?
- —
No personal income docs; deal must DSCR.
Hard money
10% down · 12.0% · 12mo
- Down + closing
- —
- Monthly P&I
- —
- Monthly cashflow
- —
- DSCR
- —
- Eligible?
- —
Short-term bridge; refi at stabilization.
Listing history 3 events
-
2026-03-25price $149,000
-
2025-08-05$159,000 Active
-
2022-07-01soldstatus
ⓘ Source: listings_history table (triggers on properties + properties_extension) + one-shot
backfill from property_details.listing_events for pre-trigger history.
Tax reassessment forecast MO · Resets to sale price
- Current annual tax
- $832 · $69/mo
- Projected year-2 tax
- $1,445 · $120/mo
- Expected delta
- +$614/yr (+$51/mo · 73.8%)
ⓘ Screening estimate from a state-policy table — verify with the county assessor before closing.
Climate risk First Street
- Flood 1/10 Low FEMA zone X (unshaded) · 0% chance over 30 yrs
- Wildfire 3/10 Moderate
- Heat 3/10 Moderate 7 d/yr ≥105°F today · 15 d/yr by 30 yrs out
- Wind 2/10 Low
- Air quality 2/10 Low 1 unhealthy d/yr today · 1 by 30 yrs out
Nearby sold comps map
Loading sold comps map…
Walkable amenities ~0.75 mi
Loading nearby amenities…
Taxation est. · year 1
- Rental income
- $14,391
- − Mortgage interest
- −$8,346
- − Property taxes
- −$832
- − Insurance
- −$745
- − Repairs & maintenance
- −$1,151
- − Management
- −$1,151
- − Depreciation
- −$4,335
- Taxable loss
- −$2,169
- Est. tax savings @ 24.0%
- +$521
- After-tax cash flow
- $936/yr
For passive investors: Depreciation is non-cash, so a rental often shows a tax loss while cash-flowing — sheltering income. Rental losses are passive: they offset passive income freely, and up to $25,000/yr can offset ordinary (W-2) income if you actively participate and your MAGI is under $100k (phasing out to $0 by $150k); unused losses carry forward. On sale, claimed depreciation is recaptured at up to 25%, and gains may owe capital-gains tax (a 1031 exchange can defer both). Figures are a year-1 estimate at your 24.0% rate — not tax advice; consult a CPA.
Schools (NCES district)
- District
- Maryville R-II
- NCES district ID
- 2920490
- Math proficiency
- 42% ▼ -5.00%
- Reading proficiency
- 53% ▼ -2.00%
- Median HH income
- $35,045
- Composite
- 39.24/100
- National rank
- #4005
- State rank
- #79 of 324 in MO
Livability — Maryville
- Score
- 79/100
- State rank
- #23
- US rank
- #2122
Category grades
Schools grade is shown separately in the Schools card above.
Census & demographics
- Census place
- Maryville, MO
- City population
- 14,315
- Population (ZIP)
- 14,315
Population outlook (Nodaway County) Hauer SSP2
- Today (2025)
- 22,010 people
- By 2030
- 21,531 · -2.2%
- By 2040
- 20,360 · -7.5%
- By 2050
- 19,210 · -12.7%
- By 2075
- 17,711 · -19.5%
- By 2100
- 16,796 · -23.7%
Race, ethnicity, and origin ACS 2023
- Neighborhood character
- Predominantly White (90%)
- Race & ethnicity
- White 90% Black 3% Hispanic / Latino 3% Two or more races 2% Asian 2%
- Common ancestry
- Slovak 3% Italian 3% Lithuanian 2%
- Foreign-born
- 3% · Canada
- Languages at home
- 97% English-only · Spanish 1% Other Asian/Pacific 1% German/W. Germanic 0%
Political lean MEDSL · Nodaway
- 2024 margin
- Solid R (+43.7) · D 27.6% · R 71.4% · Other 1.0%
- 2008→2024 swing
- -33.2pp toward R · 2008: -10.5pp · 2024: -43.7pp
- All cycles
- 2024: R+43.7 2020: R+40.5 2016: R+40.8 2012: R+27.0 2008: R+10.5
Not yet ingested
- Civics
- —
Market trends
- HPI YoY
- ▼ -65.91%
- Current HPI
- 193.2735
- Rent YoY
- —
- Metro
- —
- State GDP YoY
- ▲ 1.84%
- F500 in state
- 20
Industry mix (Fortune 500 HQ in MO)
| Industry | F500 HQs | Revenue |
|---|---|---|
| Healthcare | 1 | $163B |
|
||
| Insurance | 1 | $21B |
|
||
| Industrial Technology | 1 | $17B |
|
||
| Retail | 1 | $16B |
|
||
| Industrial Distribution | 1 | $10B |
|
||
| Utilities | 1 | $9B |
|
||
Price history
-6.3% since first listed3 events — show timeline
- 2026-03-25 Price Changed $149,000 Heartland MLS as Distributed by MLS Grid
- 2025-08-05 Listed $159,000 Heartland MLS as Distributed by MLS Grid
- 2022-07-01 Sold (Public Records) — Public Records
Property tax history
+1.9%/yrLatest (2025): $832 · +2.6% YoY. Source: county tax records.
Cash-flow waterfall
monthlySold comps — $/sqft
last 12 mo · ≤1 miLoading sold comps…