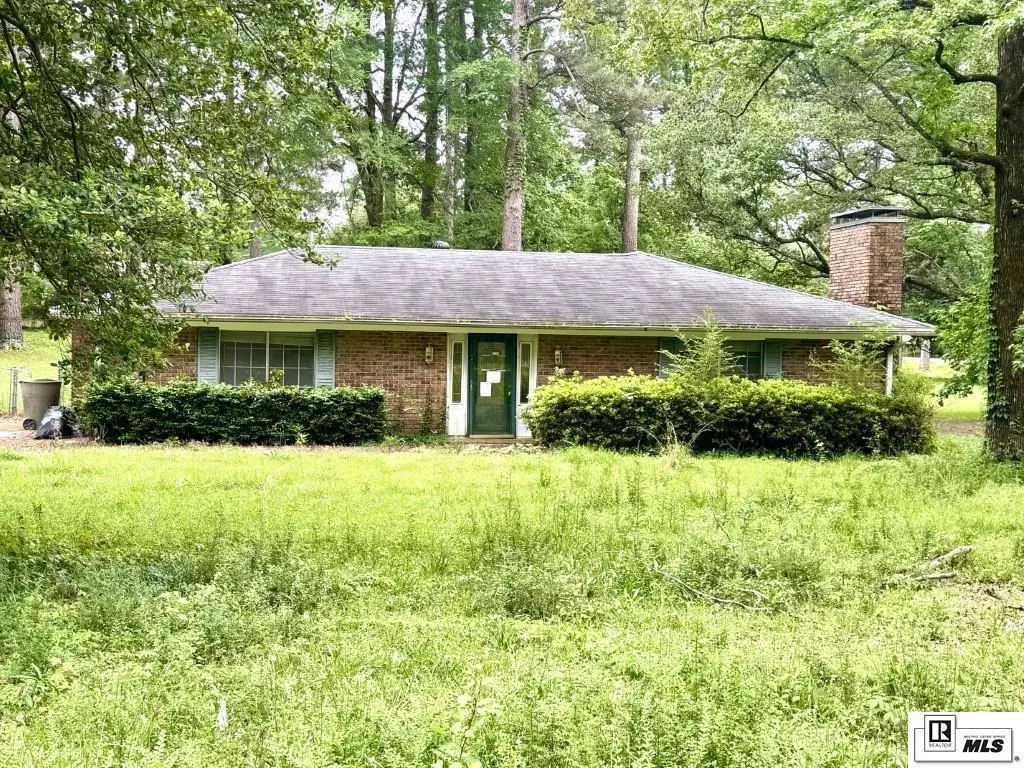
3105 Lakeview Pl · Ruston, LA
Flood risk 1/10 · Minimal
- FEMA flood zone
- X (unshaded)
- Chance of flooding over 30 yrs
- 0.0%
- Est. flood insurance / yr
- $507 – $1,088
Fire risk 3/10 · Minor
- Est. fire insurance / yr
- $1,269 – $2,357
Heat risk 7/10 · Major
- Hot days now (above 111°F)
- 7 days/yr
- Hot days in 30 yrs
- 21 days/yr
Wind risk 7/10 · Major
- Chance of severe wind over 30 yrs
- 78.0%
Air-quality risk 1/10 · Minimal
- Unhealthy air days now
- 0 days/yr
- Unhealthy air days in 30 yrs
- 0 days/yr
Risk factors via First Street. Map © Google.
Why this score? — see what drove the C- grade
The composite is a weighted blend of 9 inputs, each scored 0–100. Each bar is that input's sub-score; the figure is the points it added to the 100-point composite (weight × sub-score).
- Cash flow +16.7/30.0
- ARV discount +15.0/15.0
- DSCR +5.2/10.0
- Rent growth +4.2/5.0
- 1% rule +4.0/10.0
- Livability +3.4/5.0
- Schools +3.3/10.0
- Condition / age +2.5/5.0
- Appreciation +0.0/10.0
$160,000
🖨 Deal sheet (PDF) 📄 Offer letter ✓ Due diligence
Listing remarks
Welcoming brick home located in Ruston featuring 3 bedrooms, 2 bathrooms, and approx 2,050 hsqft of living space. This home offers two separate living areas, perfect for entertaining, relaxing, or creating a home office or flex space. Enjoy the warmth and character of two fireplaces located throughout the home. The kitchen features an abundance of cabinet space and storage, providing plenty of room for organization and functionality. Step outside to a spacious fenced backyard that is ideal for pets, gatherings, or outdoor enjoyment. Conveniently located near shopping, dining, schools, and all that Ruston has to offer, this home combines comfort, space, and opportunity all in one.
Key facts
- Brick home
- Two fireplaces
- 0.47 acre lot
Tags
Property features AI
Finance
- HOA & community: No association amenities
Exterior
- Parking: Open parking
- Utilities: Public water; Public sewer
- Home design: Single-family residence (site build); One story; Entry level: 1
- Construction: Brick veneer construction; Asphalt roof; Slab foundation; Built on a 0.47-acre lot
- Exterior features: Landscaped and cleared yard; Chain-link fencing; Storage structure
Interior
- Kitchen: Dishwasher; Refrigerator; Range hood; Electric range
- Bedrooms: Three main-level bedrooms
- Bathrooms: Two full bathrooms (both on the main level)
- Heating & cooling: Central heating; Central air; Ceiling fans
- Interior features: Ceiling fans; Blinds; Two fireplaces (living room and family room)
- Laundry & utility: Gas water heater
Neighborhood map
What this means for you Summary
Snapshot
- This is a 3-bed/2.0-bath single-family listed at $160k.
Deal economics
- At list price, monthly cash flow is $100 ($1k/yr) — positive.
- The deal already cash-flows at list — no discount required.
- To meet the 1% rule (rent ≥ 1% of price), the offer needs to be $144k (9.7% below list).
- Recommended offer: $144k (9.7% below list) — sets the bar for 1% rule.
- Cap rate 7.0% vs local median 3.2% in Ruston — top-decile yield for the area; either an underpriced asset or a hidden risk that comps aren't pricing in. Stress-test before assuming the spread holds.
Location & tenants
- Location reads 68/100 on livability (#86 in LA) — a middle-class / working-renter tenant base. Strengths: cost of living A+, health & safety A+; Watch: amenities C-, crime F, commute F.
- Lincoln Parish (town): math 35% / reading 45% proficiency, ranked #24 of 98 in LA (top 24%) — families likely to look elsewhere, expect single-tenant / working-renter base with shorter leases; 62% free/reduced lunch — lower-income household profile, screen leases tightly.
- Zoned schools: Glen View Elementary School (487 students, 69% FRL); Ruston Junior High School (math 23% / reading 38%, grade F, #112 of 218 statewide, top 52%, 558 students, 60% FRL); Ruston High School (math 53% / reading 60%, grade C, #26 of 265 statewide, top 10%, 1,310 students, 50% FRL) — zoned schools at 59% FRL track the district average.
- Market conditions: Rents rising fast (+6.6%/yr); 277 active listings in the ZIP; lower-income renter base — watch delinquency; 171 units permitted in Lincoln Parish in 2024 (0 in 5+ unit buildings).
- At $1,444/mo this rent would consume 47% of the median local household income ($37k/yr) (locally 2476% of renters already pay >50% of income on rent) — very limited rent-growth headroom before tenants either downsize or default.
Forward outlook
- Local home prices are declining (-3.0%/yr); year-one equity from $1k of loan paydown is wiped out by about $5k of value loss. Plan a longer hold.
- Lincoln County population projected at +15% by 2050 — long-run rental-demand tailwind backs the buy-and-hold thesis.
Negotiation context
- It's been on market 41 days — a 3% lower offer ($155k) is reasonable based on typical stale-listing flexibility.
- 8 sale attempts since 2y ago; this cycle's ask has dropped $15k (9%) from the opening price — seller is motivated, your offer sets the floor, not the list.
- Current owner paid $90k; list at $160k implies a 78% gain — meaningful room to come down on a strong offer.
Risks & watch-outs
- Climate carrying-cost: major wind risk, 78% chance of damaging wind over 30y; extreme-heat days projected 7→21/yr by 2055 (HVAC capex compounding) — expect insurance premiums to compound above CPI over the hold.
Questions for the listing agent
- It's been on market 41 days. Have you received any prior offers? Is the seller open to a 10% concession, seller financing, or rate buy-down credit?
- Built in 1978 — when were the roof, HVAC, electrical panel, plumbing, and water heater last replaced?
- Is there a deadline driving the sale (1031 exchange, divorce, estate, relocation)? That informs how much negotiation room exists.
- Schools are B-rated — typically a magnet for longer-tenancy family renters. What's the average tenant stay here, and is there a school-zone premium baked into asking?
- Crime grade is F in this area — have there been break-ins, vandalism, or insurance claims at this property in the last 3 years? What carrier currently insures it and at what premium?
- What's the average days-on-market for RENTAL listings here right now (not sales)? A rising rental-DOM trend means longer vacancies and softer asking-rent achievability than the comps imply.
- What's the recent tenant-quality profile in this submarket — average credit score on applications, eviction rate, late-payment / NSF rate, and stable-employment percentage? A property-management company in the area should have these aggregated.
- How much new for-sale + rental construction is in the pipeline within 1–3 miles? Heavy new supply typically softens prices + rents 12–24 months out; constrained supply supports both.
Investment metrics
- 1% rule
- 0.90% ✗
- Cap rate
- 7.04%
- Cash-on-cash
- 2.67%
- DSCR
- 1.12
- GRM
- 9.2
CMA / ARV
- ARV (median comp)
- $217,028
- List price
- $160,000
- Delta
- -26.28%
- Verdict
- UNDERPRICED
- Comps
- 20 within 1.0 mi
Show comp detail 7 sales within ~0.75 mi
| Address | Dist | Beds/Ba | Sqft | Sold | Price | $/sf | Match |
|---|---|---|---|---|---|---|---|
| 1303 Bienville St | 0.08mi | 4/2.0 (+1) | 2,344 (+14%) | 6mo | $215,000 | $92 | 63 |
| 2501 Cypress Springs Ave | 0.54mi | 3/2.0 | 2,075 (+1%) | 14mo | $282,578 | $136 | 61 |
| 1500 Bistineau St | 0.27mi | 3/2.0 | 1,811 (-12%) | 10mo | $210,000 | $116 | 59 |
| 1404 St John Ave | 0.18mi | 3/2.0 | 1,873 (-9%) | 23mo | $240,000 | $128 | 58 |
| 2802 Lakeview Dr | 0.39mi | 4/3.5 (+1) | 2,274 (+11%) | 1mo | $330,000 | $145 | 52 |
| 514 S Barnett Springs St | 0.63mi | 3/2.5 | 1,836 (-11%) | 23mo | $321,300 | $175 | 32 |
| 2305 Cypress Springs Ave | 0.64mi | 4/3.0 (+1) | 2,225 (+8%) | 23mo | $310,000 | $139 | 28 |
Match score weights: distance 35% · size 25% · config 20% · recency 20%. Top-matched comps best support the ARV.
Projected returns pro-forma
-3.0% appreciation · 6.6% rent growth · sell at horizon
- IRR
- -8.3%
- Equity multiple
- 0.68×
- Total profit
- $-14,181
- Equity at exit
- $23,857
- IRR
- 5.2%
- Equity multiple
- 1.44×
- Total profit
- $19,704
- Equity at exit
- $13,834
Cash invested: $44,800 (down + closing). Projections, not guarantees.
Landlord ↔ Tenant lean methodology
- Overall (STATE)
- 90 Strongly Landlord-Friendly
- State Louisiana
- 90 Strongly Landlord-Friendly · R+12
- County
- — inherits STATE
- City
- — inherits STATE
ZIP-level market 71270
- Home prices YoY
- -16.1%
- Rents YoY
- 6.6%
- Active inventory
- 277
- Price-to-rent
- 9.2×
Monthly cashflow live
- Estimated rent
- $1,444 medium interval (Pro) →
- Mortgage (P&I)
- −$839
- Tax from tax record
- −$136 /mo · $1,629/yr
- Insurance
- −$67
- HOA
- −$0
- Vacancy / Maint / Mgmt
- −$303
- Net cashflow
- $100
Break-even live
Sensitivity live
| Price | -10% $190 | -5% $145 | +0% $100 | +5% $54 | +10% $9 |
|---|---|---|---|---|---|
| Rent | -10% $-15 | -5% $43 | +0% $100 | +5% $157 | +10% $214 |
| Rate | -1.0pp $180 | -0.5pp $140 | base $100 | +0.5pp $58 | +1.0pp $16 |
UW: 25.0% down · 7.5% · 30yr · 1.5% tax · 5.0% vac · 8.0% maint · 8.0% mgmt
Financing live
Cash to close
- Down payment
- $40,000
- Closing costs
- $4,800
- Reserves months
- —
- Total cash needed
- —
Loan-product check · same deal, 3 products live
Conventional
25% down · 7.5% · 30yr
- Down + closing
- —
- Monthly P&I
- —
- Monthly cashflow
- —
- DSCR
- —
- Eligible?
- —
Personal DTI + credit; lowest rate.
DSCR
20% down · 8.5% · 30yr
- Down + closing
- —
- Monthly P&I
- —
- Monthly cashflow
- —
- DSCR
- —
- Eligible?
- —
No personal income docs; deal must DSCR.
Hard money
10% down · 12.0% · 12mo
- Down + closing
- —
- Monthly P&I
- —
- Monthly cashflow
- —
- DSCR
- —
- Eligible?
- —
Short-term bridge; refi at stabilization.
Listing history 31 events
-
2026-06-21days on market $160,000 Active 41 DOM
-
2026-06-19days on market $160,000 Active 39 DOM
-
2026-06-18days on market $160,000 Active 38 DOM
-
2026-06-17price $160,000 Active 37 DOM
-
2026-06-17days on market $175,000 Active 37 DOM
-
2026-06-16days on market $175,000 Active 36 DOM
-
2026-06-15days on market $175,000 Active 35 DOM
-
2026-06-14days on market $175,000 Active 33 DOM
-
2026-06-12days on market $175,000 Active 32 DOM
-
2026-06-09days on market $175,000 Active 29 DOM
-
2026-06-08days on market $175,000 Active 28 DOM
-
2026-06-07days on market $175,000 Active 27 DOM
-
2026-06-05days on market $175,000 Active 24 DOM
-
2026-06-03days on market $175,000 Active 23 DOM
-
2026-06-02days on market $175,000 Active 22 DOM
-
2026-06-01days on market $175,000 Active 21 DOM
-
2026-05-31days on market $175,000 Active 20 DOM
-
2026-05-30days on market $175,000 Active 19 DOM
-
2026-05-11$175,000 Active 688-char remark
-
2026-05-04price $175,000
-
2026-03-03status Active
-
2025-12-19status Active
-
2025-12-19price $185,000
-
2025-11-21status Active
-
2025-10-06status Pending
-
2025-07-08price $210,000
-
2025-06-18$235,000 Active
-
2025-01-23status Active
-
2024-12-17status Active
-
2024-08-20$235,000 Active
-
1998-10-20soldstatus $90,000
ⓘ Source: listings_history table (triggers on properties + properties_extension) + one-shot
backfill from property_details.listing_events for pre-trigger history.
Tax reassessment forecast LA · Resets to sale price
- Current annual tax
- $1,629 · $136/mo
- Projected year-2 tax
- $1,629 · $136/mo
- Expected delta
- $0/yr ($0/mo · 0.0%)
ⓘ Screening estimate from a state-policy table — verify with the county assessor before closing.
Climate risk First Street
- Flood 1/10 Low FEMA zone X (unshaded) · 0% chance over 30 yrs
- Wildfire 3/10 Moderate
- Heat 7/10 Severe 7 d/yr ≥111°F today · 21 d/yr by 30 yrs out
- Wind 7/10 Severe 78% chance of damaging wind over 30 yrs
- Air quality 1/10 Low 0 unhealthy d/yr today · 0 by 30 yrs out
Nearby sold comps map
Loading sold comps map…
Walkable amenities ~0.75 mi
Loading nearby amenities…
Taxation est. · year 1
- Rental income
- $17,333
- − Mortgage interest
- −$8,962
- − Property taxes
- −$1,629
- − Insurance
- −$800
- − Repairs & maintenance
- −$1,387
- − Management
- −$1,387
- − Depreciation
- −$4,655
- Taxable loss
- −$1,487
- Est. tax savings @ 24.0%
- +$357
- After-tax cash flow
- $1,552/yr
For passive investors: Depreciation is non-cash, so a rental often shows a tax loss while cash-flowing — sheltering income. Rental losses are passive: they offset passive income freely, and up to $25,000/yr can offset ordinary (W-2) income if you actively participate and your MAGI is under $100k (phasing out to $0 by $150k); unused losses carry forward. On sale, claimed depreciation is recaptured at up to 25%, and gains may owe capital-gains tax (a 1031 exchange can defer both). Figures are a year-1 estimate at your 24.0% rate — not tax advice; consult a CPA.
Schools (NCES district)
- District
- Lincoln Parish
- NCES district ID
- 2200990
- Math proficiency
- 35% ▼ -32.00%
- Reading proficiency
- 45% ▼ -27.00%
- Median HH income
- $33,901
- Composite
- 32.92/100
- National rank
- #5599
- State rank
- #24 of 98 in LA
Livability — Ruston
- Score
- 68/100
- State rank
- #86
- US rank
- #9522
Category grades
Schools grade is shown separately in the Schools card above.
Census & demographics
- Census place
- Ruston, LA
- County
- Lincoln Parish · 32,885 people
- City population
- 32,885
- Metro
- Ruston, LA
- Population (ZIP)
- 32,885
- Household income
- $36,791
- Rent vs Own
- Severe rent burden
- 2476.0
Population outlook (Lincoln County) Hauer SSP2
- Today (2025)
- 49,595 people
- By 2030
- 50,954 · +2.7%
- By 2040
- 53,601 · +8.1%
- By 2050
- 57,178 · +15.3%
- By 2075
- 69,580 · +40.3%
- By 2100
- 79,862 · +61.0%
Race, ethnicity, and origin ACS 2023
- Neighborhood character
- Diverse neighborhood (Simpson 0.60)
- Race & ethnicity
- White 51% Black 38% Two or more races 6% Hispanic / Latino 4% Asian 2% Native American 1%
- Common ancestry
- Lithuanian 4% Slovak 2% Serbian 1%
- Foreign-born
- 3% · Canada, Vietnam
- Languages at home
- 95% English-only · Spanish 2% Other Indo-European 1% Arabic 1%
Political lean MEDSL · Lincoln
- 2024 margin
- Strong R (+25.4) · D 36.5% · R 62.0% · Other 1.6%
- 2008→2024 swing
- -13.0pp toward R · 2008: -12.5pp · 2024: -25.4pp
- All cycles
- 2024: R+25.4 2020: R+19.5 2016: R+19.6 2012: R+14.7 2008: R+12.5
Not yet ingested
- Civics
- —
Market trends
- HPI YoY
- ▼ -40.69%
- Current HPI
- 212.8211
- Rent YoY
- ▲ 6.60%
- Metro
- Ruston, LA
- State GDP YoY
- ▲ 3.29%
- F500 in state
- 10
Industry mix (Fortune 500 HQ in LA)
| Industry | F500 HQs | Revenue |
|---|---|---|
| Telecommunications | 2 | $23B |
|
||
| Utilities | 1 | $12B |
|
||
| Wholesale / Distribution | 1 | $5B |
|
||
| Advertising | 1 | $2B |
|
||
Price history
+77.8% since first listed14 events — show timeline
- 2026-06-17 Price Changed $160,000 NELABOR
- 2026-05-11 Listed $175,000 NELABOR
- 2026-05-04 Price Changed $175,000 NELABOR
- 2026-03-03 Relisted — NELABOR
- 2025-12-19 Relisted — NELABOR
- 2025-12-19 Price Changed $185,000 NELABOR
- 2025-11-21 Relisted — NELABOR
- 2025-10-06 Pending — NELABOR
- 2025-07-08 Price Changed $210,000 NELABOR
- 2025-06-18 Listed $235,000 NELABOR
- 2025-01-23 Relisted — NELABOR
- 2024-12-17 Relisted — NELABOR
- 2024-08-20 Listed $235,000 NELABOR
- 1998-10-20 Sold (Public Records) $90,000 Public Records
Property tax history
+2.6%/yrLatest (2025): $1,629 · +0.0% YoY. Source: county tax records.
Cash-flow waterfall
monthlySold comps — $/sqft
last 12 mo · ≤1 miLoading sold comps…