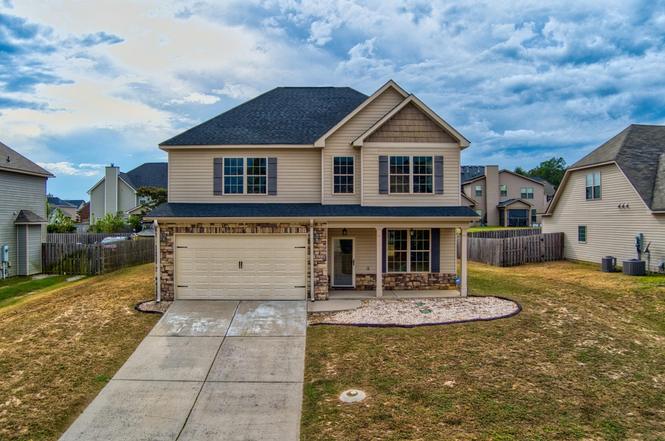
7339 Roundstone Dr · Graniteville, SC
Flood risk 1/10 · Minimal
- FEMA flood zone
- X (unshaded)
- Chance of flooding over 30 yrs
- 0.0%
- Est. flood insurance / yr
- $507 – $1,088
Fire risk 5/10 · Moderate
- Est. fire insurance / yr
- $783 – $1,453
Heat risk 7/10 · Major
- Hot days now (above 108°F)
- 7 days/yr
- Hot days in 30 yrs
- 17 days/yr
Wind risk 6/10 · Moderate
- Chance of severe wind over 30 yrs
- 72.0%
Air-quality risk 4/10 · Minor
- Unhealthy air days now
- 4 days/yr
- Unhealthy air days in 30 yrs
- 4 days/yr
Risk factors via First Street. Map © Google.
Why this score? — see what drove the D+ grade
The composite is a weighted blend of 9 inputs, each scored 0–100. Each bar is that input's sub-score; the figure is the points it added to the 100-point composite (weight × sub-score).
- Cash flow +15.0/30.0
- Appreciation +9.2/10.0
- DSCR +4.6/10.0
- ARV discount +3.7/15.0
- Schools +3.2/10.0
- 1% rule +3.0/10.0
- Livability +3.0/5.0
- Rent growth +2.5/5.0
- Condition / age +2.5/5.0
$300,000
🖨 Deal sheet 📄 Offer letter ✓ Due diligence
Listing remarks
Discover this beautifully updated home in the highly sought after Sage Creek community. Recent renovations include fresh interior paint, a brand‑new roof, updated bathroom flooring, and new carpet throughout, creating a truly move in ready space. The open floor plan features hardwood floors in the kitchen and dining room, complemented by stainless steel appliances and elegant granite countertops. An inviting electric fireplace adds warmth and charm to the living area. Outside, enjoy a fully fenced backyard perfect for pets, play, or outdoor entertaining. A wonderful blend of comfort, style, and convenience in a popular neighborhood.
Key facts
- Fenced back yard
- New roof
- 0.43 acre lot
Tags
Property features AI
Finance
- HOA & community: Homeowners association with an annual fee of $450 (about $37.50/month)
Exterior
- Parking: Attached garage with 2 spaces; Garage door opener; Paved driveway
- Utilities: Public water; Public sewer; Underground utilities; Water and sewer available; Electricity available; Cable available
- Home design: Single-family residence; Two levels
- Construction: Stone and vinyl siding exterior; Asphalt roof; Slab foundation; Built on two levels
- Exterior features: Porch; Patio; Fenced yard; Sprinklers in rear; Level to rolling slope lot; Paved road access
Interior
- Kitchen: Dishwasher; Disposal; Range / Cooktop; Electric water heater
- Bedrooms: Total rooms: 8
- Flooring: Ceramic tile; Carpet; Hardwood
- Bathrooms: 2 full bathrooms; 1 half bathroom
- Heating & cooling: Central air (electric); Ceiling fans; Forced air heat; Heat pump; Electric heating; Fireplace heating option
- Interior features: Ceiling fans; Walk-in closets; Eat-in kitchen; Pantry; Insulated windows with window coverings; Living room electric fireplace
- Laundry & utility: Washer hookup; Electric dryer hookup
Neighborhood map
What this means for you Summary
Snapshot
- This is a 4-bed/2.5-bath single-family listed at $300k.
Deal economics
- At list price, monthly cash flow is $93 ($1k/yr) — positive.
- The deal already cash-flows at list — no discount required.
- To meet the 1% rule (rent ≥ 1% of price), the offer needs to be $241k (19.8% below list).
- Recommended offer: $241k (19.8% below list) — sets the bar for 1% rule.
Location & tenants
- Location reads 59/100 on livability (#240 in SC) — a working-class tenant base; expect higher turnover. Strengths: cost of living A+, crime B+; Watch: schools F, amenities F, commute F.
- Aiken 01 (suburban): math 31% / reading 44% proficiency, ranked #36 of 80 in SC (top 45%) — families likely to look elsewhere, expect single-tenant / working-renter base with shorter leases.
- Market conditions: 299 active listings in the ZIP; 5 comparable units currently listed for rent nearby; rentals at typical pace (median 21d on market — plan ~3-4 weeks tenant-placement turnaround); solid renter incomes; 2,500 units permitted in Aiken County in 2024 (1,023 in 5+ unit buildings).
- This rent runs 34% of the median local income ($84k/yr) — at the standard rent-burdened threshold; future hikes will face affordability resistance.
Forward outlook
- In year one you build about $27k of equity ($2k loan paydown + $25k appreciation (8.4% local appreciation)).
- Aiken County population projected at +9% by 2050 — modest demand growth; plan on rents tracking national, not racing it.
- At projected returns (8.4% appreciation + 3.0% rent growth), your $84k cash investment doubles in ~3 years — after that, you're playing with house money.
- By year 2, paydown + projected appreciation supports a ~$44k cash-out refi (75% LTV) — recoverable capital for the next deal without selling this one.
Negotiation context
- It's been on market 265 days — a 12% lower offer ($264k) is reasonable based on typical stale-listing flexibility.
- 9 sale attempts since 14y ago with the ask held roughly flat each time — persistent listings suggest the price (not the market) is what's stuck; bring a comps-based counter.
- Current owner paid $188k; list at $300k implies a 59% gain — meaningful room to come down on a strong offer.
Risks & watch-outs
- Climate carrying-cost: major wind risk, 72% chance of damaging wind over 30y; moderate wildfire risk; extreme-heat days projected 7→17/yr by 2055 (HVAC capex compounding) — expect insurance premiums to compound above CPI over the hold.
Questions for the listing agent
- It's been on market 265 days. Have you received any prior offers? Is the seller open to a 20% concession, seller financing, or rate buy-down credit?
- What does the HOA fee cover, when was the last increase, and are there any pending special assessments or reserve-fund shortfalls?
- Why hasn't it sold? Are there any deal-killer items the seller is aware of (foundation, flood, title, zoning, code violations)?
- Is there a deadline driving the sale (1031 exchange, divorce, estate, relocation)? That informs how much negotiation room exists.
- Schools are F-rated, which usually means shorter tenancies and higher turnover. Who's the typical renter profile here, and what's been the actual vacancy rate?
- The area grade is low — what's the realistic commute time and amenity access for the typical tenant pool here? Any planned neighborhood developments (good or bad) we should know about?
- What's the average days-on-market for RENTAL listings here right now (not sales)? A rising rental-DOM trend means longer vacancies and softer asking-rent achievability than the comps imply.
- What's the recent tenant-quality profile in this submarket — average credit score on applications, eviction rate, late-payment / NSF rate, and stable-employment percentage? A property-management company in the area should have these aggregated.
- How much new for-sale + rental construction is in the pipeline within 1–3 miles? Heavy new supply typically softens prices + rents 12–24 months out; constrained supply supports both.
Investment metrics
- 1% rule
- 0.80% ✗
- Cap rate
- 6.67%
- Cash-on-cash
- 1.33%
- DSCR
- 1.06
- GRM
- 10.4
CMA / ARV
- ARV (on-the-fly)
- $276,360
- Comps found
- 12
Show comp detail 12 sales within ~0.75 mi
| Address | Dist | Beds/Ba | Sqft | Sold | Price | $/sf | Match |
|---|---|---|---|---|---|---|---|
| 568 Buttonwood Dr | 0.06mi | 4/2.5 | 2,232 (-3%) | 1mo | $267,000 | $120 | 91 |
| 708 Flat Rock Ln | 0.47mi | 4/2.5 | 2,342 (+2%) | 5mo | $399,000 | $170 | 71 |
| 4145 Thimbleberry Dr | 0.27mi | 3/2.5 (-1) | 2,357 (+2%) | 10mo | $273,000 | $116 | 70 |
| 709 Turning Crest Ln | 0.36mi | 4/2.5 | 2,294 (-0%) | 16mo | $256,500 | $112 | 69 |
| 3032 Walking View Ct | 0.50mi | 4/2.5 | 2,359 (+2%) | 5mo | $250,000 | $106 | 68 |
| 4055 Thimbleberry Dr | 0.35mi | 3/2.5 (-1) | 2,273 (-1%) | 12mo | $270,000 | $119 | 66 |
| 8039 Red Rock Way Way | 0.34mi | 4/2.5 | 2,456 (+7%) | 13mo | $287,000 | $117 | 62 |
| 8045 Cozy Knl | 0.33mi | 4/2.5 | 2,149 (-7%) | 15mo | $274,500 | $128 | 61 |
| 8003 Red Rock Way | 0.28mi | 4/2.0 | 1,966 (-15%) | 1mo | $285,000 | $145 | 60 |
| 692 Turning Crest Ln | 0.31mi | 3/2.5 (-1) | 2,000 (-13%) | 1mo | $255,000 | $128 | 58 |
| 2841 Calli Crossing Dr | 0.70mi | 5/3.0 (+1) | 2,361 (+2%) | 16mo | $283,600 | $120 | 43 |
| 515 Twin VW Ct | 0.54mi | 3/2.5 (-1) | 2,065 (-10%) | 14mo | $257,000 | $124 | 41 |
Match score weights: distance 35% · size 25% · config 20% · recency 20%. Top-matched comps best support the ARV.
Projected returns pro-forma
8.38% appreciation · 3.0% rent growth · sell at horizon
- IRR
- 21.8%
- Equity multiple
- 2.63×
- Total profit
- $136,739
- Equity at exit
- $235,719
- IRR
- 19.9%
- Equity multiple
- 5.67×
- Total profit
- $392,512
- Equity at exit
- $475,542
Cash invested: $84,000 (down + closing). Projections, not guarantees.
Landlord ↔ Tenant lean methodology
- Overall (STATE)
- 90 Strongly Landlord-Friendly
- State South Carolina
- 90 Strongly Landlord-Friendly · R+6
- County
- — inherits STATE
- City
- — inherits STATE
ZIP-level market 29829
- Home prices YoY
- 3.0%
- Active inventory
- 299
- Price-to-rent
- 10.4×
Monthly cashflow live
- Estimated rent
- $2,405 high interval (Pro) →
- Mortgage (P&I)
- −$1,573
- Tax from tax record
- −$71 /mo · $846/yr
- Insurance
- −$125
- HOA
- −$38
- Vacancy / Maint / Mgmt
- −$505
- Net cashflow
- $93
Break-even live
UW: 25.0% down · 7.5% · 30yr · 1.5% tax · 5.0% vac · 8.0% maint · 8.0% mgmt
Financing live
Cash to close
- Down payment
- $75,000
- Closing costs
- $9,000
- Reserves months
- —
- Total cash needed
- —
Loan-product check · same deal, 3 products live
Conventional
25% down · 7.5% · 30yr
- Down + closing
- —
- Monthly P&I
- —
- Monthly cashflow
- —
- DSCR
- —
- Eligible?
- —
Personal DTI + credit; lowest rate.
DSCR
20% down · 8.5% · 30yr
- Down + closing
- —
- Monthly P&I
- —
- Monthly cashflow
- —
- DSCR
- —
- Eligible?
- —
No personal income docs; deal must DSCR.
Hard money
10% down · 12.0% · 12mo
- Down + closing
- —
- Monthly P&I
- —
- Monthly cashflow
- —
- DSCR
- —
- Eligible?
- —
Short-term bridge; refi at stabilization.
Rent comps 5 comps
| Address | Beds | Baths | Sqft | Rent | $/sqft | DOM | Units | Dist |
|---|---|---|---|---|---|---|---|---|
| 4074 Thimbleberry Dr Graniteville, SC | 3.0 | 2.5 | 1854 | $1,900 | $1.02 | 21d | 1 | 0.33mi |
| 4044 Thimbleberry Dr Graniteville, SC | 3.0 | 2.5 | 1694 | $1,925 | $1.14 | 21d | 1 | 0.37mi |
| 6130 Mahogany Ter Graniteville, SC | 4.0 | 2.0 | 1893 | $2,250 | $1.19 | 13d | 1 | 0.40mi |
| 507 Satinwood Cir Graniteville, SC | 3.0–4.0 | 2.0–2.5 | 1776 | $2,199 | $1.24 | 13d | 5 | 0.41mi |
| 4060 Stone Pass Dr Graniteville, SC | 4.0 | 2.0 | 1600 | $1,925 | $1.20 | 23d | 1 | 0.63mi |
HOA detail
- Monthly dues
- $38 · $456/yr
- Likely covers
- electric
Listing history 34 events
-
2026-06-18days on market $300,000 Active 265 DOM
-
2026-06-17days on market $300,000 Active 264 DOM
-
2026-06-16days on market $300,000 Active 263 DOM
-
2026-06-15days on market $300,000 Active 262 DOM
-
2026-06-14days on market $300,000 Active 260 DOM
-
2026-06-13days on market $300,000 Active 259 DOM
-
2026-06-10days on market $300,000 Active 257 DOM
-
2026-06-09days on market $300,000 Active 256 DOM
-
2026-06-08days on market $300,000 Active 255 DOM
-
2026-06-07days on market $300,000 Active 254 DOM
-
2026-06-03days on market $300,000 Active 250 DOM
-
2026-06-02days on market $300,000 Active 249 DOM
-
2026-06-01days on market $300,000 Active 248 DOM
-
2026-05-31days on market $300,000 Active 247 DOM
-
2026-05-30days on market $300,000 Active 246 DOM
-
2025-11-11price $300,000
-
2025-10-16status Active
-
2025-10-15historical Active Under Contract
-
2025-09-26$314,900 Active
-
2025-04-07historical
-
2025-04-07historical
-
2025-04-04$275,000
-
2025-04-04$275,000
-
2018-08-27soldstatus $188,500
-
2018-08-24soldstatus $188,500
-
2018-08-24soldstatus $188,500
-
2018-08-24soldstatus $188,500
-
2018-06-18$189,900
-
2018-06-11$189,000
-
2018-06-11$189,000
-
2012-11-29soldstatus $152,300
-
2012-11-29soldstatus $152,300
-
2012-08-30$152,300
-
2012-08-30$152,300
ⓘ Source: listings_history table (triggers on properties + properties_extension) + one-shot
backfill from property_details.listing_events for pre-trigger history.
Tax reassessment forecast SC · Resets to sale price
- Current annual tax
- $846 · $71/mo
- Projected year-2 tax
- $1,710 · $142/mo
- Expected delta
- +$864/yr (+$72/mo · 102.1%)
ⓘ Screening estimate from a state-policy table — verify with the county assessor before closing.
Climate risk First Street
- Flood 1/10 Low FEMA zone X (unshaded) · 0% chance over 30 yrs
- Wildfire 5/10 Major
- Heat 7/10 Severe 7 d/yr ≥108°F today · 17 d/yr by 30 yrs out
- Wind 6/10 Major 72% chance of damaging wind over 30 yrs
- Air quality 4/10 Moderate 4 unhealthy d/yr today · 4 by 30 yrs out
Nearby sold comps map
Loading sold comps map…
Walkable amenities ~0.75 mi
Loading nearby amenities…
Taxation est. · year 1
- Rental income
- $28,863
- − Mortgage interest
- −$16,805
- − Property taxes
- −$846
- − Insurance
- −$1,500
- − Repairs & maintenance
- −$2,309
- − Management
- −$2,309
- − HOA
- −$456
- − Depreciation
- −$8,727
- Taxable loss
- −$4,089
- Est. tax savings @ 24.0%
- +$981
- After-tax cash flow
- $2,103/yr
For passive investors: Depreciation is non-cash, so a rental often shows a tax loss while cash-flowing — sheltering income. Rental losses are passive: they offset passive income freely, and up to $25,000/yr can offset ordinary (W-2) income if you actively participate and your MAGI is under $100k (phasing out to $0 by $150k); unused losses carry forward. On sale, claimed depreciation is recaptured at up to 25%, and gains may owe capital-gains tax (a 1031 exchange can defer both). Figures are a year-1 estimate at your 24.0% rate — not tax advice; consult a CPA.
Schools (NCES district)
- District
- Aiken 01
- NCES district ID
- 4500720
- Math proficiency
- 31% ▼ -11.00%
- Reading proficiency
- 44% ▼ -1.00%
- Median HH income
- $45,081
- Composite
- 31.91/100
- National rank
- #5857
- State rank
- #36 of 80 in SC
Livability — Graniteville
- Score
- 59/100
- State rank
- #240
- US rank
- #19924
Category grades
Schools grade is shown separately in the Schools card above.
Census & demographics
- County
- Aiken County · 116,534 people
- City population
- 12,385
- Metro
- Augusta-Richmond County, GA-SC
- Population (ZIP)
- 12,385
- Household income
- $84,228
- Rent vs Own
- Severe rent burden
- 213.0
Population outlook (Aiken County) Hauer SSP2
- Today (2025)
- 178,003 people
- By 2030
- 182,876 · +2.7%
- By 2040
- 189,970 · +6.7%
- By 2050
- 193,840 · +8.9%
- By 2075
- 199,453 · +12.1%
- By 2100
- 192,403 · +8.1%
Race, ethnicity, and origin ACS 2023
- Neighborhood character
- Diverse neighborhood (Simpson 0.58)
- Race & ethnicity
- White 59% Black 26% Hispanic / Latino 12% Two or more races 9% Asian 1%
- Hispanic origin (detail)
- Mexican 8% Puerto Rican 1%
- Common ancestry
- Italian 2% Swedish 2% Slovak 1%
- Foreign-born
- 6% · Canada
- Languages at home
- 89% English-only · Spanish 10% Other Indo-European 1%
Political lean MEDSL · Aiken
- 2024 margin
- Strong R (+25.9) · D 36.4% · R 62.2% · Other 1.4%
- 2008→2024 swing
- -1.9pp toward R · 2008: -24.0pp · 2024: -25.9pp
- All cycles
- 2024: R+25.9 2020: R+22.7 2016: R+27.5 2012: R+26.0 2008: R+24.0
Not yet ingested
- Civics
- —
Market trends
- HPI YoY
- ▲ 8.38%
- Current HPI
- 286.4155
- Rent YoY
- —
- Metro
- Augusta-Richmond County, GA-SC
- State GDP YoY
- ▲ 4.51%
- F500 in state
- 2
Industry mix (Fortune 500 HQ in SC)
| Industry | F500 HQs | Revenue |
|---|---|---|
| Packaging | 1 | $7B |
|
||
Price history
+97.0% since first listed19 events — show timeline
- 2025-11-11 Price Changed $300,000 AMLS
- 2025-10-16 Relisted — AMLS
- 2025-10-15 Contingent — AMLS
- 2025-09-26 Listed $314,900 AMLS
- 2025-04-07 Listing Removed — Hive MLS
- 2025-04-07 Listing Removed — Hive MLS
- 2025-04-04 Listed $275,000 Hive MLS
- 2025-04-04 Listed $275,000 Hive MLS
- 2018-08-27 Sold (Public Records) $188,500 Public Records
- 2018-08-24 Sold (MLS) $188,500 AMLS
- 2018-08-24 Sold (MLS) $188,500 Hive MLS
- 2018-08-24 Sold (MLS) $188,500 Hive MLS
- 2018-06-18 Listed $189,900 AMLS
- 2018-06-11 Listed $189,000 Hive MLS
- 2018-06-11 Listed $189,000 Hive MLS
- 2012-11-29 Sold (MLS) $152,300 Hive MLS
- 2012-11-29 Sold (MLS) $152,300 Hive MLS
- 2012-08-30 Listed $152,300 Hive MLS
- 2012-08-30 Listed $152,300 Hive MLS
Property tax history
+1.9%/yrLatest (2025): $846 · +0.0% YoY. Source: county tax records.
Cash-flow waterfall
monthlySold comps — $/sqft
last 12 mo · ≤1 miLoading sold comps…