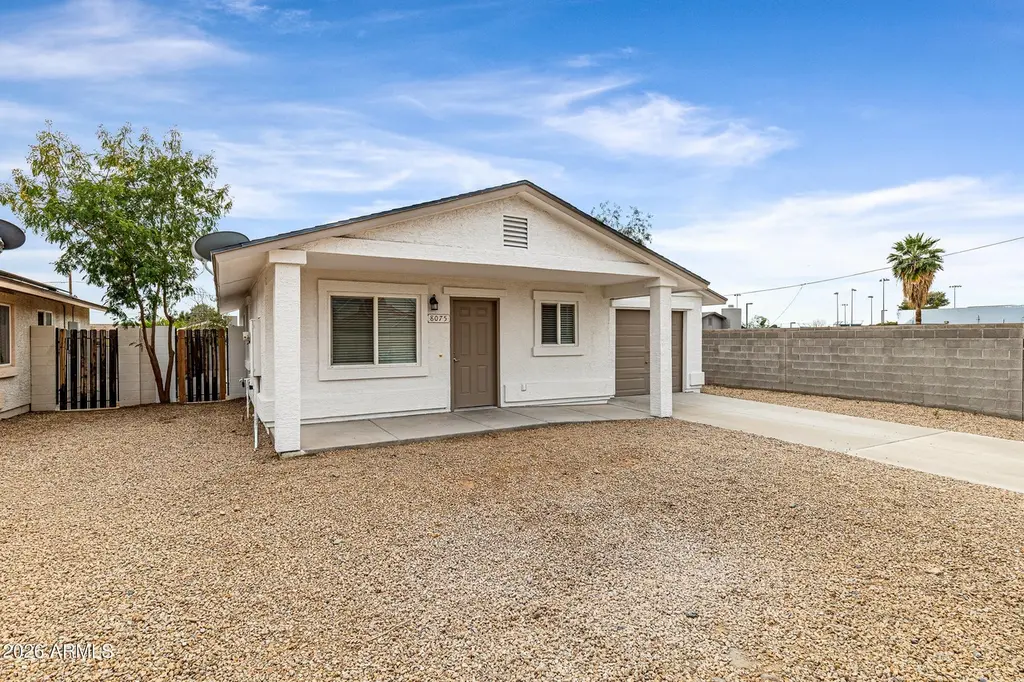
8075 W Cherry Hills Dr · Peoria, AZ
Flood risk 1/10 · Minimal
- FEMA flood zone
- X (shaded)
- Chance of flooding over 30 yrs
- 0.0%
- Est. flood insurance / yr
- $507 – $1,088
Fire risk 1/10 · Minimal
- Est. fire insurance / yr
- $610 – $1,132
Heat risk 9/10 · Severe
- Hot days now (above 113°F)
- 7 days/yr
- Hot days in 30 yrs
- 19 days/yr
Wind risk 1/10 · Minimal
- Chance of severe wind over 30 yrs
- —
Air-quality risk 3/10 · Minor
- Unhealthy air days now
- 3 days/yr
- Unhealthy air days in 30 yrs
- 3 days/yr
Risk factors via First Street. Map © Google.
Why this score? — see what drove the D+ grade
The composite is a weighted blend of 9 inputs, each scored 0–100. Each bar is that input's sub-score; the figure is the points it added to the 100-point composite (weight × sub-score).
- ARV discount +15.0/15.0
- Cash flow +13.2/30.0
- DSCR +4.0/10.0
- Livability +3.8/5.0
- Schools +3.5/10.0
- Rent growth +2.7/5.0
- 1% rule +2.5/10.0
- Condition / age +2.5/5.0
- Appreciation +0.0/10.0
$250,000
🖨 Deal sheet (PDF) 📄 Offer letter ✓ Due diligence
Listing remarks MLS
Beautiful 3-Bedroom, 2-Bath Home with No HOA! This charming home features an open floor plan with laminate flooring throughout and a spacious backyard perfect for entertaining. Enjoy a functional kitchen, a convenient 1-car garage. Located near major freeways for easy commuting, this home offers comfort, convenience.
Key facts
- 6,404 sq ft lot
- Garage
- Built 2008
Neighborhood map
What this means for you Summary
Snapshot
- This is a 3-bed/2.0-bath single-family listed at $250k.
Deal economics
- At list price, monthly cash flow is $-4 ($-45/yr) — negative.
- To cash-flow at today's rent, offer at most $249k (0.3% below list).
- To meet the 1% rule (rent ≥ 1% of price), the offer needs to be $187k (25.2% below list).
- Recommended offer: $187k (25.2% below list) — sets the bar for 1% rule.
- Cap rate 6.3% vs local median 3.4% in Peoria — top-decile yield for the area; either an underpriced asset or a hidden risk that comps aren't pricing in. Stress-test before assuming the spread holds.
Location & tenants
- Location reads 76/100 on livability (#14 in AZ, #3,603 nationally) — a middle-class / working-renter tenant base. Strengths: housing A+, commute A, employment A; Watch: cost of living C-, amenities D, health & safety F.
- Peoria Unified School District (4237) (suburban): math 36% / reading 42% proficiency, ranked #64 of 249 in AZ (top 26%) — families likely to look elsewhere, expect single-tenant / working-renter base with shorter leases.
- Zoned schools: Peoria Elementary School (math 21% / reading 29%, grade F, #638 of 1,109 statewide, top 58%, 554 students, 68% FRL); Peoria High School (math 18% / reading 22%, grade F, #225 of 381 statewide, top 60%, 1,566 students, 54% FRL) — zoned schools average 61% FRL vs 35% district-wide (26 pts higher); higher-poverty schools than district average — tighter screening recommended.
- Zoned-school proficiency averages 22% at this address vs 39% district-wide (-16 pts) — the specific schools serving this property underperform the Peoria Unified School District (4237) average; the district grade overstates school quality for this exact location.
- Market conditions: Rents flat; 331 active listings in the ZIP; 39 comparable units currently listed for rent nearby; rentals leasing fast (median 7d on market — plan ~1-2 weeks tenant-placement turnaround); 36,011 units permitted in Maricopa County in 2024 (12,801 in 5+ unit buildings).
- This rent runs 33% of the median local income ($67k/yr) — at the standard rent-burdened threshold; future hikes will face affordability resistance.
Forward outlook
- Local home prices are declining (-3.0%/yr); year-one equity from $2k of loan paydown is wiped out by about $8k of value loss. Plan a longer hold.
- Maricopa County population projected at +38% by 2050 — long-run rental-demand tailwind backs the buy-and-hold thesis.
Negotiation context
- Only 8 days on market — expect competitive offers; lowballing is unlikely to land.
- 2 sale attempts with the ask held roughly flat each time — persistent listings suggest the price (not the market) is what's stuck; bring a comps-based counter.
Risks & watch-outs
- Climate carrying-cost: extreme-heat days projected 7→19/yr by 2055 (HVAC capex compounding) — expect insurance premiums to compound above CPI over the hold.
Questions for the listing agent
- What do current leases actually rent for vs. the listed asking? Can we see a recent rent roll and the last 12 months of T-12 income?
- Is there a deadline driving the sale (1031 exchange, divorce, estate, relocation)? That informs how much negotiation room exists.
- Schools are B-rated — typically a magnet for longer-tenancy family renters. What's the average tenant stay here, and is there a school-zone premium baked into asking?
- The area grade is low — what's the realistic commute time and amenity access for the typical tenant pool here? Any planned neighborhood developments (good or bad) we should know about?
- What's the average days-on-market for RENTAL listings here right now (not sales)? A rising rental-DOM trend means longer vacancies and softer asking-rent achievability than the comps imply.
- What's the recent tenant-quality profile in this submarket — average credit score on applications, eviction rate, late-payment / NSF rate, and stable-employment percentage? A property-management company in the area should have these aggregated.
- How much new for-sale + rental construction is in the pipeline within 1–3 miles? Heavy new supply typically softens prices + rents 12–24 months out; constrained supply supports both.
Investment metrics
- 1% rule
- 0.75% ✗
- Cap rate
- 6.27%
- Cash-on-cash
- -0.06%
- DSCR
- 1.00
- GRM
- 11.1
CMA / ARV
- ARV (on-the-fly)
- $340,016
- Comps found
- 12
Show comp detail 12 sales within ~0.75 mi
| Address | Dist | Beds/Ba | Sqft | Sold | Price | $/sf | Match |
|---|---|---|---|---|---|---|---|
| 7950 W Paradise Dr | 0.17mi | 2/2.0 (-1) | 1,086 (+1%) | 2mo | $307,500 | $283 | 84 |
| 11525 N 81st Ave | 0.21mi | 3/2.0 | 1,152 (+7%) | 2mo | $363,500 | $316 | 76 |
| 11510 N 80th Ave | 0.25mi | 3/1.0 | 1,024 (-5%) | 2mo | $168,500 | $165 | 75 |
| 11320 N 81 Dr | 0.36mi | 3/2.0 | 1,015 (-6%) | 10mo | $334,000 | $329 | 65 |
| 8014 W Mescal St | 0.47mi | 3/2.0 | 1,116 (+4%) | 13mo | $367,990 | $330 | 61 |
| 8503 W Bloomfield Rd | 0.61mi | 3/2.0 | 1,005 (-7%) | 5mo | $380,000 | $378 | 56 |
| 11501 N 80th Ave | 0.26mi | 4/2.0 (+1) | 1,206 (+12%) | 13mo | $269,000 | $223 | 52 |
| 8602 W Wethersfield Rd | 0.70mi | 3/2.0 | 1,179 (+10%) | 2mo | $310,000 | $263 | 49 |
| 8408 W Corrine Dr | 0.68mi | 3/2.0 | 1,168 (+9%) | 8mo | $336,000 | $288 | 48 |
| 11807 N 76th Ave | 0.61mi | 3/2.0 | 1,228 (+14%) | 4mo | $370,000 | $301 | 45 |
| 8155 W Desert Cove Ave | 0.56mi | 2/2.0 (-1) | 915 (-15%) | 8mo | $314,900 | $344 | 37 |
| 10723 N 80th Ln | 0.72mi | 2/1.0 (-1) | 959 (-11%) | 13mo | $305,000 | $318 | 28 |
Match score weights: distance 35% · size 25% · config 20% · recency 20%. Top-matched comps best support the ARV.
Projected returns pro-forma
-3.0% appreciation · 0.62% rent growth · sell at horizon
- IRR
- -18.8%
- Equity multiple
- 0.35×
- Total profit
- $-45,246
- Equity at exit
- $37,276
- IRR
- -16.1%
- Equity multiple
- 0.18×
- Total profit
- $-57,314
- Equity at exit
- $21,615
Cash invested: $70,000 (down + closing). Projections, not guarantees.
Landlord ↔ Tenant lean methodology
- Overall (STATE)
- 87 Strongly Landlord-Friendly
- State Arizona
- 87 Strongly Landlord-Friendly · R+3
- County
- — inherits STATE
- City
- — inherits STATE
ZIP-level market 85345
- Home prices YoY
- -19.8%
- Rents YoY
- 0.6%
- Active inventory
- 331
- Price-to-rent
- 11.1×
Monthly cashflow live
- Estimated rent
- $1,869 high interval (Pro) →
- Mortgage (P&I)
- −$1,311
- Tax from tax record
- −$65 /mo · $781/yr
- Insurance
- −$104
- HOA
- −$0
- Vacancy / Maint / Mgmt
- −$392
- Net cashflow
- $-4
Break-even live
Sensitivity live
| Price | -10% $138 | -5% $67 | +0% $-4 | +5% $-75 | +10% $-145 |
|---|---|---|---|---|---|
| Rent | -10% $-151 | -5% $-78 | +0% $-4 | +5% $70 | +10% $144 |
| Rate | -1.0pp $122 | -0.5pp $60 | base $-4 | +0.5pp $-69 | +1.0pp $-134 |
UW: 25.0% down · 7.5% · 30yr · 1.5% tax · 5.0% vac · 8.0% maint · 8.0% mgmt
Financing live
Cash to close
- Down payment
- $62,500
- Closing costs
- $7,500
- Reserves months
- —
- Total cash needed
- —
Loan-product check · same deal, 3 products live
Conventional
25% down · 7.5% · 30yr
- Down + closing
- —
- Monthly P&I
- —
- Monthly cashflow
- —
- DSCR
- —
- Eligible?
- —
Personal DTI + credit; lowest rate.
DSCR
20% down · 8.5% · 30yr
- Down + closing
- —
- Monthly P&I
- —
- Monthly cashflow
- —
- DSCR
- —
- Eligible?
- —
No personal income docs; deal must DSCR.
Hard money
10% down · 12.0% · 12mo
- Down + closing
- —
- Monthly P&I
- —
- Monthly cashflow
- —
- DSCR
- —
- Eligible?
- —
Short-term bridge; refi at stabilization.
Rent comps 39 comps
| Address | Beds | Baths | Sqft | Rent | $/sqft | DOM | Units | Dist |
|---|---|---|---|---|---|---|---|---|
| 12480 N 83rd Dr Peoria, AZ | 3.0 | 2.0 | 1410 | $1,895 | $1.34 | 4d | 1 | 0.50mi |
| 7914 W Mescal St Peoria, AZ | 3.0 | 2.0 | 1296 | $1,700 | $1.31 | 6d | 1 | 0.51mi |
| 11014 N 81st Ave Peoria, AZ | 3.0 | 3.0 | 1133 | $1,699 | $1.50 | 1d | 1 | 0.55mi |
| 11014 N 81st Ave Peoria, AZ | 3.0 | 3.0 | 1133 | $1,699 | $1.50 | 7d | 1 | 0.55mi |
| 11851 N 76th Dr Peoria, AZ | 3.0 | 2.0 | 1266 | $1,899 | $1.50 | 7d | 1 | 0.57mi |
| 11110 N 82nd Ln Peoria, AZ | 3.0 | 2.0 | 1350 | $1,899 | $1.41 | 26d | 1 | 0.61mi |
| 11807 N 76th Ave Peoria, AZ | 3.0 | 2.0 | 1228 | $1,995 | $1.62 | 45d | 1 | 0.62mi |
| 11600 N 75th Ave Peoria, AZ | 2.0 | 2.0 | 814 | $1,325 | $1.63 | 4d | 4 | 0.68mi |
| 8311 W Edwards St Peoria, AZ | 3.0 | 2.0 | 1242 | $2,100 | $1.69 | 26d | 1 | 0.69mi |
| 8630 W Shaw Butte Dr Peoria, AZ | 3.0 | 2.0 | 1284 | $1,951 | $1.52 | 15d | 1 | 0.72mi |
| 10860 N 85th Ave Unit 87 Peoria, AZ | 2.0 | 1.0 | 780 | $1,149 | $1.47 | 7d | 1 | 0.87mi |
| 10860 N 85th Ave Peoria, AZ | 1.0–2.0 | 1.0 | 630 | $1,350 | $2.14 | 5d | 1 | 0.88mi |
| 10860 N 85th Ave Peoria, AZ | 2.0 | 1.0 | 780 | $1,225 | $1.57 | 45d | 1 | 0.88mi |
| 8609 W Dahlia Dr Peoria, AZ | 3.0 | 3.0 | 1431 | $1,550 | $1.08 | 45d | 1 | 0.91mi |
| 8111 W Wacker Rd Peoria, AZ | 1.0–4.0 | 1.0–2.5 | 898 | $1,600 | $1.78 | 1d | 3 | 0.92mi |
| 8560 W Peoria Ave Peoria, AZ | 2.0 | 1.0 | 888 | $1,399 | $1.58 | 1d | 8 | 0.99mi |
| 8280 W Madison St Peoria, AZ | 2.0 | 2.0 | 800 | $1,400 | $1.75 | 45d | 1 | 1.02mi |
| 8773 W Dahlia Dr Peoria, AZ | 3.0 | 2.5 | 1439 | $2,200 | $1.53 | 6d | 1 | 1.04mi |
| 8650 W Peoria Ave Peoria, AZ | 1.0–2.0 | 1.0–2.0 | 836 | $1,492 | $1.78 | 1d | 18 | 1.06mi |
| 8656 W Willow Ave Peoria, AZ | 3.0 | 2.0 | 1347 | $2,000 | $1.48 | 14d | 1 | 1.15mi |
| 8821 W Sahuaro Dr Peoria, AZ | 3.0 | 2.0 | 1074 | $1,695 | $1.58 | 1d | 1 | 1.17mi |
| 8821 W Sahuaro Dr Peoria, AZ | 3.0 | 2.0 | 1074 | $1,595 | $1.49 | 5d | 1 | 1.17mi |
| 8821 W Sahuaro Dr Peoria, AZ | 3.0 | 2.0 | 1074 | $1,595 | $1.49 | 26d | 1 | 1.17mi |
| 11411 N 91st Ave Unit 213 Peoria, AZ | 2.0 | 2.0 | 858 | $1,399 | $1.63 | 26d | 1 | 1.23mi |
| 11411 N 91st Ave Unit 134 Peoria, AZ | 3.0 | 2.0 | 1310 | $1,599 | $1.22 | 45d | 1 | 1.27mi |
| 13868 N 79th Ave Peoria, AZ | 2.0 | 2.0 | 937 | $1,650 | $1.76 | 1d | 2 | 1.28mi |
| 8165 W Whitney Dr Peoria, AZ | 1.0–2.0 | 1.0–2.0 | 911 | $2,223 | $2.44 | 1d | 228 | 1.29mi |
| 8175 W Ludlow Dr Peoria, AZ | 2.0 | 1.0–2.0 | 923 | $1,754 | $1.90 | 1d | 10 | 1.29mi |
| 9903 N 77th Ave Peoria, AZ | 3.0 | 2.0 | 1446 | $1,895 | $1.31 | 6d | 1 | 1.30mi |
| 10221 N 87th Ln Peoria, AZ | 3.0 | 2.0 | 1232 | $2,059 | $1.67 | 45d | 1 | 1.33mi |
| 7347 W Eugie Ave Peoria, AZ | 3.0 | 2.0 | 1500 | $1,980 | $1.32 | 20d | 1 | 1.35mi |
| 14109 N 83rd Ave Peoria, AZ | 1.0–3.0 | 1.0–2.0 | 1063 | $2,324 | $2.19 | 1d | 17 | 1.37mi |
| 7951 W Whitney Dr Peoria, AZ | 2.0–4.0 | 2.0–2.5 | 1411 | $2,540 | $1.80 | 0d | 30 | 1.39mi |
| 13720 N 88th Ave Peoria, AZ | 3.0 | 1.0–2.0 | 768 | $2,380 | $3.10 | 1d | 45 | 1.43mi |
| 9592 N 82nd Ave Peoria, AZ | 3.0 | 2.5 | 1401 | $1,775 | $1.27 | 1d | 1 | 1.47mi |
| 9592 N 82nd Ave Peoria, AZ | 3.0 | 2.5 | 1401 | $1,775 | $1.27 | 17d | 1 | 1.47mi |
| 9221 W Gary Rd Peoria, AZ | 4.0 | 1.0 | 1300 | $2,000 | $1.54 | 45d | 1 | 1.48mi |
| 8885 W Thunderbird Rd Peoria, AZ | 1.0–2.0 | 1.0–2.0 | 879 | $1,725 | $1.96 | 4d | 26 | 1.48mi |
| 7007 W Mercer Ln Peoria, AZ | 3.0 | 2.5 | 1432 | $2,100 | $1.47 | 1d | 1 | 1.49mi |
Listing history 7 events
-
2026-04-27status Pending
-
2026-04-18$250,000 Active
-
2026-03-06soldstatus $310,000 Closed 318-char remark
Show marketing remark (318 chars)
Beautiful 3-Bedroom, 2-Bath Home with No HOA! This charming home features an open floor plan with laminate flooring throughout and a spacious backyard perfect for entertaining. Enjoy a functional kitchen, a convenient 1-car garage. Located near major freeways for easy commuting, this home offers comfort, convenience.
-
2026-01-27status Pending 318-char remark
Show marketing remark (318 chars)
Beautiful 3-Bedroom, 2-Bath Home with No HOA! This charming home features an open floor plan with laminate flooring throughout and a spacious backyard perfect for entertaining. Enjoy a functional kitchen, a convenient 1-car garage. Located near major freeways for easy commuting, this home offers comfort, convenience.
-
2026-01-13price $299,900 318-char remark
Show marketing remark (318 chars)
Beautiful 3-Bedroom, 2-Bath Home with No HOA! This charming home features an open floor plan with laminate flooring throughout and a spacious backyard perfect for entertaining. Enjoy a functional kitchen, a convenient 1-car garage. Located near major freeways for easy commuting, this home offers comfort, convenience.
-
2025-12-22price $324,900 318-char remark
Show marketing remark (318 chars)
Beautiful 3-Bedroom, 2-Bath Home with No HOA! This charming home features an open floor plan with laminate flooring throughout and a spacious backyard perfect for entertaining. Enjoy a functional kitchen, a convenient 1-car garage. Located near major freeways for easy commuting, this home offers comfort, convenience.
-
2025-10-31$334,900 Active 318-char remark
Show marketing remark (318 chars)
Beautiful 3-Bedroom, 2-Bath Home with No HOA! This charming home features an open floor plan with laminate flooring throughout and a spacious backyard perfect for entertaining. Enjoy a functional kitchen, a convenient 1-car garage. Located near major freeways for easy commuting, this home offers comfort, convenience.
ⓘ Source: listings_history table (triggers on properties + properties_extension) + one-shot
backfill from property_details.listing_events for pre-trigger history.
Tax reassessment forecast AZ · Resets to sale price
- Current annual tax
- $781 · $65/mo
- Projected year-2 tax
- $1,650 · $138/mo
- Expected delta
- +$869/yr (+$72/mo · 111.4%)
ⓘ Screening estimate from a state-policy table — verify with the county assessor before closing.
Climate risk First Street
- Flood 1/10 Low FEMA zone X (shaded) · 0% chance over 30 yrs
- Wildfire 1/10 Low
- Heat 9/10 Extreme 7 d/yr ≥113°F today · 19 d/yr by 30 yrs out
- Wind 1/10 Low
- Air quality 3/10 Moderate 3 unhealthy d/yr today · 3 by 30 yrs out
Nearby sold comps map
Loading sold comps map…
Walkable amenities ~0.75 mi
Loading nearby amenities…
Taxation est. · year 1
- Rental income
- $22,428
- − Mortgage interest
- −$14,004
- − Property taxes
- −$781
- − Insurance
- −$1,250
- − Repairs & maintenance
- −$1,794
- − Management
- −$1,794
- − Depreciation
- −$7,273
- Taxable loss
- −$4,468
- Est. tax savings @ 24.0%
- +$1,072
- After-tax cash flow
- $1,027/yr
For passive investors: Depreciation is non-cash, so a rental often shows a tax loss while cash-flowing — sheltering income. Rental losses are passive: they offset passive income freely, and up to $25,000/yr can offset ordinary (W-2) income if you actively participate and your MAGI is under $100k (phasing out to $0 by $150k); unused losses carry forward. On sale, claimed depreciation is recaptured at up to 25%, and gains may owe capital-gains tax (a 1031 exchange can defer both). Figures are a year-1 estimate at your 24.0% rate — not tax advice; consult a CPA.
Schools (NCES district)
- District
- Peoria Unified School District (4237)
- NCES district ID
- 0406250
- Math proficiency
- 36% ▼ -14.00%
- Reading proficiency
- 42% ▼ -8.00%
- Median HH income
- $60,171
- Composite
- 34.62/100
- National rank
- #5152
- State rank
- #64 of 249 in AZ
Livability — Peoria
- Score
- 76/100
- State rank
- #14
- US rank
- #3603
Category grades
Schools grade is shown separately in the Schools card above.
Census & demographics
- Census place
- Peoria, AZ
- County
- Maricopa County · 4,537,380 people
- City population
- 206,687
- Metro
- Phoenix-Mesa-Chandler, AZ
- Population (ZIP)
- 60,918
- Household income
- $67,380
- Rent vs Own
- Severe rent burden
- 1879.0
Population outlook (Maricopa County) Hauer SSP2
- Today (2025)
- 4,979,203 people
- By 2030
- 5,378,229 · +8.0%
- By 2040
- 6,156,598 · +23.6%
- By 2050
- 6,872,376 · +38.0%
- By 2075
- 8,401,270 · +68.7%
- By 2100
- 9,247,439 · +85.7%
Race, ethnicity, and origin ACS 2023
- Neighborhood character
- Diverse neighborhood (Simpson 0.62)
- Race & ethnicity
- White 51% Hispanic / Latino 34% Two or more races 14% Black 5% Asian 4% Native American 2%
- Hispanic origin (detail)
- Mexican 29%
- Common ancestry
- Romanian 2% Italian 2% Slovak 1%
- Foreign-born
- 13% · Canada, Vietnam
- Languages at home
- 76% English-only · Spanish 18% Other Indo-European 1% Vietnamese 1%
Political lean MEDSL · Maricopa
- 2024 margin
- Toss-up / Even · D 47.7% · R 51.2% · Other 1.1%
- 2008→2024 swing
- +7.1pp toward D · 2008: -10.6pp · 2024: -3.5pp
- All cycles
- 2024: R+3.5 2020: D+2.2 2016: R+3.5 2012: R+12.0 2008: R+10.6
Not yet ingested
- Civics
- —
Market trends
- HPI YoY
- ▼ -80.77%
- Current HPI
- 328.1069
- Rent YoY
- ▲ 0.62%
- Metro
- Phoenix-Mesa-Chandler, AZ
- State GDP YoY
- ▲ 4.54%
- F500 in state
- 20
Industry mix (Fortune 500 HQ in AZ)
| Industry | F500 HQs | Revenue |
|---|---|---|
| Technology | 2 | $13B |
|
||
| Mining / Metals | 1 | $23B |
|
||
| Environmental Services | 1 | $16B |
|
||
| Metals / Steel | 1 | $14B |
|
||
| Technology Distribution | 1 | $9B |
|
||
| Homebuilding | 1 | $8B |
|
||
Price history
-25.4% since first listed7 events — show timeline
- 2026-04-27 Pending — ARMLS
- 2026-04-18 Listed $250,000 ARMLS
- 2026-03-06 Sold (MLS) $310,000 ARMLS
- 2026-01-27 Pending — ARMLS
- 2026-01-13 Price Changed $299,900 ARMLS
- 2025-12-22 Price Changed $324,900 ARMLS
- 2025-10-31 Listed $334,900 ARMLS
Property tax history
-0.4%/yrLatest (2025): $781 · +2.8% YoY. Source: county tax records.
Cash-flow waterfall
monthlySold comps — $/sqft
last 12 mo · ≤1 miLoading sold comps…