 Duplex
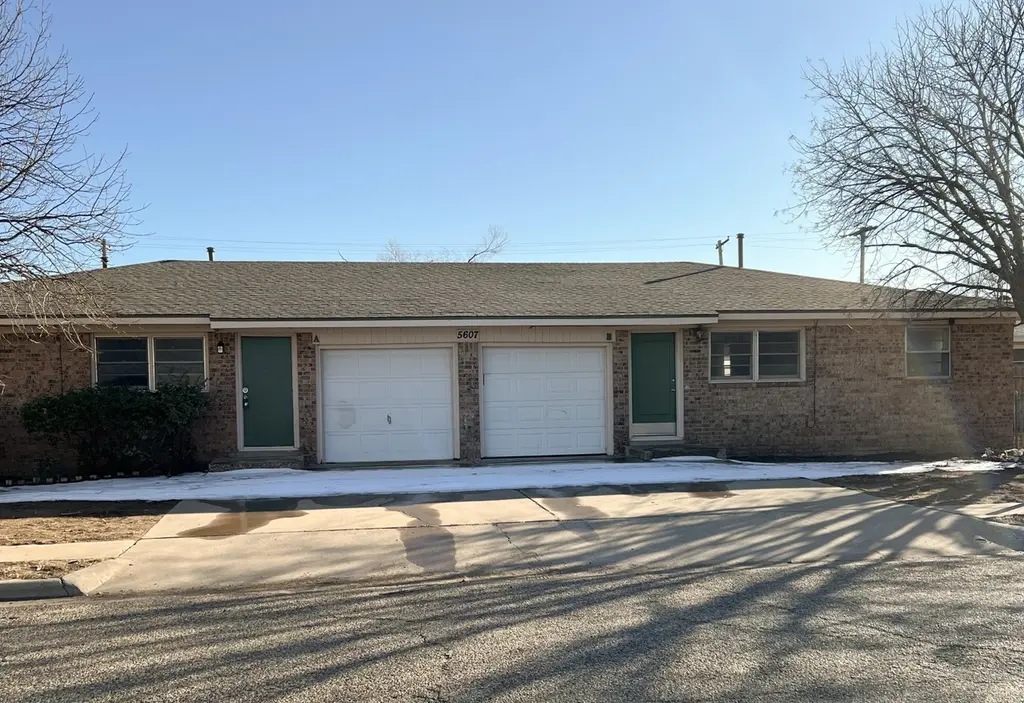
5607 43rd St · Lubbock, TX
Flood risk 1/10 · Minimal
- FEMA flood zone
- X (unshaded)
- Chance of flooding over 30 yrs
- 0.0%
- Est. flood insurance / yr
- $507 – $1,088
Fire risk 1/10 · Minimal
- Est. fire insurance / yr
- $1,222 – $2,270
Heat risk 5/10 · Moderate
- Hot days now (above 99°F)
- 7 days/yr
- Hot days in 30 yrs
- 21 days/yr
Wind risk 2/10 · Minimal
- Chance of severe wind over 30 yrs
- —
Air-quality risk 2/10 · Minimal
- Unhealthy air days now
- 1 days/yr
- Unhealthy air days in 30 yrs
- 1 days/yr
Risk factors via First Street. Map © Google.
Why this score? — see what drove the C- grade
The composite is a weighted blend of 9 inputs, each scored 0–100. Each bar is that input's sub-score; the figure is the points it added to the 100-point composite (weight × sub-score).
- Cash flow +20.8/30.0
- ARV discount +7.5/15.0
- DSCR +6.6/10.0
- 1% rule +5.6/10.0
- Livability +4.0/5.0
- Schools +3.1/10.0
- Rent growth +2.6/5.0
- Condition / age +2.5/5.0
- Appreciation +0.0/10.0
$165,000
🖨 Deal sheet 📄 Offer letter ✓ Due diligence
Multi-family units
County records classify this as Multi-Family (2-4 Unit). Listing-text estimate: 2 units. confirmed
Listing remarks
Fantastic investment opportunity! This well-maintained duplex features two units, each offering 2 spacious bedrooms, 1 full bathroom, and a 1-car garage. Inside, you'll find a blend of hardwood and hardwood flooring for easy care and timeless appeal. The kitchens are updated with granite countertops, adding a touch of style and durability. Whether you're looking for a rental property or a home with income potential, this duplex is a smart choice! Side A is ready to show and side B will be finished in about 2-3 weeks and will look identical to side A. They also own the duplex next door if someone is interested in buying both units. This unit is currently rented out.
Key facts
- Hardwood flooring
- Updated kitchens
- Granite countertops
Tags
Neighborhood map
What this means for you Summary
Snapshot
- This is a 2 × 2-bed/1.0-bath units multifamily listed at $165k.
Deal economics
- At list price, monthly cash flow is $225 ($3k/yr) — positive. Per door: $113/mo.
- The deal already cash-flows at list — no discount required.
- Meets the 1% rule at list price ($2k rent vs $165k).
- Recommended offer: $163k (1.5% below list) — sets the bar for market timing.
Location & tenants
- Location reads 80/100 on livability (#37 in TX, #1,749 nationally) — a professional / high-income tenant draw. Strengths: commute A+, cost of living A+, housing A+; Watch: employment C-, crime F.
- Lubbock ISD (urban): math 36% / reading 39% proficiency, ranked #481 of 826 in TX (top 58%) — families likely to look elsewhere, expect single-tenant / working-renter base with shorter leases; 60% free/reduced lunch — lower-income household profile, screen leases tightly.
- Zoned schools: Wester El (math 22% / reading 27%, grade F, #3,052 of 4,322 statewide, top 74%, 371 students, 94% FRL); Mackenzie Middle (math 19% / reading 27%, grade F, #1,327 of 1,662 statewide, top 81%, 515 students, 88% FRL); Coronado H S (math 34% / reading 38%, grade F, #930 of 1,632 statewide, top 57%, 1,960 students, 66% FRL) — zoned schools average 82% FRL vs 60% district-wide (22 pts higher); higher-poverty schools than district average — tighter screening recommended.
- Market conditions: Rents flat; 89 active listings in the ZIP; 40 comparable units currently listed for rent nearby; rentals at typical pace (median 21d on market — plan ~3-4 weeks tenant-placement turnaround); 2,219 units permitted in Lubbock County in 2024 (252 in 5+ unit buildings).
- This rent runs 43% of the median local income ($49k/yr) — at the standard rent-burdened threshold; future hikes will face affordability resistance.
Forward outlook
- Local home prices are declining (-3.0%/yr); year-one equity from $1k of loan paydown is wiped out by about $5k of value loss. Plan a longer hold.
- Lubbock County population projected at +39% by 2050 — long-run rental-demand tailwind backs the buy-and-hold thesis.
Negotiation context
- It's been on market 19 days — a 2% lower offer ($163k) is reasonable based on typical stale-listing flexibility.
Risks & watch-outs
- Watch-outs: built in 1950 — expect roof / HVAC / electrical / plumbing capex.
- Climate carrying-cost: extreme-heat days projected 7→21/yr by 2055 (HVAC capex compounding) — expect insurance premiums to compound above CPI over the hold.
Questions for the listing agent
- Can we see the unit-by-unit rent roll, current vacancy, and any below-market leases? What's the average tenancy length?
- What capital expenditures (roof, boiler, parking lot, exteriors) have been made in the last 5 years, and what's planned in the next 2?
- Built in 1950 — when were the roof, HVAC, electrical panel, plumbing, and water heater last replaced?
- Is there a deadline driving the sale (1031 exchange, divorce, estate, relocation)? That informs how much negotiation room exists.
- Schools are D-rated, which usually means shorter tenancies and higher turnover. Who's the typical renter profile here, and what's been the actual vacancy rate?
- Crime grade is F in this area — have there been break-ins, vandalism, or insurance claims at this property in the last 3 years? What carrier currently insures it and at what premium?
- What's the average days-on-market for RENTAL listings here right now (not sales)? A rising rental-DOM trend means longer vacancies and softer asking-rent achievability than the comps imply.
- What's the recent tenant-quality profile in this submarket — average credit score on applications, eviction rate, late-payment / NSF rate, and stable-employment percentage? A property-management company in the area should have these aggregated.
- How much new apartment / multifamily construction is in the pipeline within 1–3 miles? Heavy new supply (>2% of stock underway) typically softens rents 12–24 months out; light construction supports rent growth.
Investment metrics
- 1% rule
- 1.06% ✓
- Cap rate
- 7.93%
- Cash-on-cash
- 5.85%
- DSCR
- 1.26
- GRM
- 7.8
CMA / ARV
No comps found within radius.
Projected returns pro-forma
-3.0% appreciation · 0.56% rent growth · sell at horizon
- IRR
- -10.1%
- Equity multiple
- 0.64×
- Total profit
- $-16,551
- Equity at exit
- $24,602
- IRR
- -4.5%
- Equity multiple
- 0.74×
- Total profit
- $-12,207
- Equity at exit
- $14,266
Cash invested: $46,200 (down + closing). Projections, not guarantees.
Landlord ↔ Tenant lean methodology
- Overall (STATE)
- 87 Strongly Landlord-Friendly
- State Texas
- 87 Strongly Landlord-Friendly · R+5
- County
- — inherits STATE
- City
- — inherits STATE
ZIP-level market 79414
- Home prices YoY
- -27.8%
- Rents YoY
- 0.6%
- Active inventory
- 89
- Price-to-rent
- 15.7×
Monthly cashflow live
- Estimated rent
- $1,755 high interval (Pro) →
- Mortgage (P&I)
- −$865
- Tax from tax record
- −$227 /mo · $2,725/yr
- Insurance
- −$69
- HOA
- −$0
- Vacancy / Maint / Mgmt
- −$369
- Net cashflow
- $225
Break-even live
2-unit breakdown (identical units grouped — click to expand)
| Units | Beds | Baths | Est. rent |
|---|---|---|---|
| 2× units | 2 | 1 | $1,756 |
| #1 | 2 | 1 | $878 |
| #2 | 2 | 1 | $878 |
| Total (2 units) | $1,755 | ||
UW: 25.0% down · 7.5% · 30yr · 1.5% tax · 5.0% vac · 8.0% maint · 8.0% mgmt
Financing live
Cash to close
- Down payment
- $41,250
- Closing costs
- $4,950
- Reserves months
- —
- Total cash needed
- —
Loan-product check · same deal, 3 products live
Conventional
25% down · 7.5% · 30yr
- Down + closing
- —
- Monthly P&I
- —
- Monthly cashflow
- —
- DSCR
- —
- Eligible?
- —
Personal DTI + credit; lowest rate.
DSCR
20% down · 8.5% · 30yr
- Down + closing
- —
- Monthly P&I
- —
- Monthly cashflow
- —
- DSCR
- —
- Eligible?
- —
No personal income docs; deal must DSCR.
Hard money
10% down · 12.0% · 12mo
- Down + closing
- —
- Monthly P&I
- —
- Monthly cashflow
- —
- DSCR
- —
- Eligible?
- —
Short-term bridge; refi at stabilization.
Rent comps 40 comps
| Address | Beds | Baths | Sqft | Rent | $/sqft | DOM | Units | Dist |
|---|---|---|---|---|---|---|---|---|
| 5702 50th St Lubbock, TX | 1.0–3.0 | 1.0–2.0 | 809 | $1,069 | $1.32 | 13d | 27 | 0.33mi |
| 5415 42nd St Lubbock, TX | 3.0 | 2.0 | 1417 | $1,450 | $1.02 | 21d | 1 | 0.33mi |
| 5440 48th St Lubbock, TX | 4.0 | 3.0 | 1720 | $1,750 | $1.02 | 13d | 1 | 0.34mi |
| 3705 Elkhart Ave Lubbock, TX | 4.0 | 2.0 | 1507 | $1,650 | $1.09 | 21d | 1 | 0.38mi |
| 5604 38th St Lubbock, TX | 3.0 | 2.0 | 1442 | $1,400 | $0.97 | 21d | 1 | 0.38mi |
| 5724 36th St Lubbock, TX | 4.0 | 2.0 | 1696 | $1,600 | $0.94 | 43d | 1 | 0.47mi |
| 5501 50th St Lubbock, TX | 1.0–3.0 | 1.0–2.0 | 1125 | $1,549 | $1.38 | 13d | 7 | 0.50mi |
| 5416 36th St Lubbock, TX | 3.0 | 2.0 | 1375 | $1,295 | $0.94 | 43d | 1 | 0.51mi |
| 5406 36th St Lubbock, TX | 3.0 | 2.0 | 1400 | $695 | $0.50 | 43d | 1 | 0.54mi |
| 5318 39th St Lubbock, TX | 3.0 | 2.0 | 1736 | $1,375 | $0.79 | 13d | 1 | 0.55mi |
| 5401 50th St Lubbock, TX | 1.0–3.0 | 1.0–2.0 | 1018 | $1,099 | $1.08 | 13d | 11 | 0.56mi |
| 5220 41st St Lubbock, TX | 3.0 | 2.0 | 1536 | $1,400 | $0.91 | 21d | 1 | 0.56mi |
| 5302 48th St Lubbock, TX | 3.0 | 2.0 | 1368 | $1,450 | $1.06 | 21d | 1 | 0.60mi |
| 5550 56th St Lubbock, TX | 1.0–3.0 | 1.0–2.0 | 958 | $1,260 | $1.31 | 13d | 21 | 0.73mi |
| 5117 Albany Ave Lubbock, TX | 3.0 | 2.0 | 1558 | $1,500 | $0.96 | 43d | 1 | 0.78mi |
| 5017 46th St Lubbock, TX | 3.0 | 2.0 | 1753 | $1,600 | $0.91 | 43d | 1 | 0.83mi |
| 5002 46th St Lubbock, TX | 3.0 | 2.0 | 1369 | $1,450 | $1.06 | 43d | 1 | 0.92mi |
| 5024 35th St Lubbock, TX | 3.0 | 2.0 | 1364 | $1,300 | $0.95 | 21d | 1 | 0.96mi |
| 4916 46th St Lubbock, TX | 3.0 | 2.0 | 1377 | $1,450 | $1.05 | 13d | 1 | 0.97mi |
| 4926 48th St Lubbock, TX | 3.0 | 2.0 | 1354 | $1,500 | $1.11 | 21d | 1 | 0.99mi |
| 5003 35th St Lubbock, TX | 3.0 | 2.0 | 1501 | $1,550 | $1.03 | 13d | 1 | 1.02mi |
| 5011 52nd St Lubbock, TX | 3.0 | 2.0 | 1292 | $1,500 | $1.16 | 21d | 1 | 1.03mi |
| 4819 44th St Lubbock, TX | 3.0 | 2.0 | 1412 | $1,300 | $0.92 | 43d | 1 | 1.05mi |
| 4815 43rd St Lubbock, TX | 3.0 | 2.0 | 1282 | $1,500 | $1.17 | 21d | 1 | 1.07mi |
| 4817 40th St Lubbock, TX | 3.0 | 2.0 | 1254 | $1,300 | $1.04 | 13d | 1 | 1.08mi |
| 4803 43rd St Lubbock, TX | 3.0 | 2.0 | 1412 | $1,200 | $0.85 | 21d | 1 | 1.14mi |
| 4818 36th St Lubbock, TX | 3.0 | 2.0 | 1285 | $1,400 | $1.09 | 21d | 1 | 1.17mi |
| 4801 36th St Lubbock, TX | 3.0 | 2.0 | 1424 | $1,275 | $0.90 | 21d | 1 | 1.23mi |
| 4708 43rd St Lubbock, TX | 3.0 | 1.5 | 1249 | $1,350 | $1.08 | 43d | 1 | 1.26mi |
| 4619 43rd St Lubbock, TX | 3.0 | 1.0 | 1404 | $1,500 | $1.07 | 43d | 1 | 1.31mi |
| 5405 66th St Lubbock, TX | 1.0–3.0 | 1.0–2.0 | 874 | $1,280 | $1.46 | 21d | 19 | 1.37mi |
| 4602 50th St Lubbock, TX | 1.0–3.0 | 1.0–2.5 | 1080 | $1,368 | $1.27 | 13d | 9 | 1.39mi |
| 6040 24th St Lubbock, TX | 3.0 | 3.5 | 1795 | $1,650 | $0.92 | 43d | 1 | 1.46mi |
| 6040 24th St Apt 25 Lubbock, TX | 3.0 | 2.5 | 1795 | $1,700 | $0.95 | 21d | 1 | 1.46mi |
| 6040 24th St Apt 25 Lubbock, TX | 3.0 | 3.5 | 1795 | $1,700 | $0.95 | 43d | 1 | 1.46mi |
| 6040 24th St Unit 16 Lubbock, TX | 3.0 | 3.5 | 1600 | $1,699 | $1.06 | 13d | 1 | 1.46mi |
| 6040 24th St Lubbock, TX | 3.0 | 3.0 | 1795 | $1,799 | $1.00 | 21d | 1 | 1.46mi |
| 6306 28th St Lubbock, TX | 3.0 | 1.0 | 1325 | $1,200 | $0.91 | 43d | 1 | 1.48mi |
| 4606 35th St Lubbock, TX | 4.0 | 2.0 | 1684 | $1,800 | $1.07 | 43d | 1 | 1.48mi |
| 6040 24th St Unit 17 Lubbock, TX | 3.0 | 3.5 | 1700 | $1,729 | $1.02 | 43d | 1 | 1.49mi |
Listing history 4 events
-
2026-04-07status Pending
-
2026-03-19$165,000 Active
-
2006-10-03soldstatus
-
2006-09-08soldstatus
ⓘ Source: listings_history table (triggers on properties + properties_extension) + one-shot
backfill from property_details.listing_events for pre-trigger history.
Tax reassessment forecast TX · Resets to sale price
- Current annual tax
- $2,725 · $227/mo
- Projected year-2 tax
- $3,020 · $252/mo
- Expected delta
- +$295/yr (+$25/mo · 10.8%)
ⓘ Screening estimate from a state-policy table — verify with the county assessor before closing.
Climate risk First Street
- Flood 1/10 Low FEMA zone X (unshaded) · 0% chance over 30 yrs
- Wildfire 1/10 Low
- Heat 5/10 Major 7 d/yr ≥99°F today · 21 d/yr by 30 yrs out
- Wind 2/10 Low
- Air quality 2/10 Low 1 unhealthy d/yr today · 1 by 30 yrs out
Nearby sold comps map
Loading sold comps map…
Walkable amenities ~0.75 mi
Loading nearby amenities…
Taxation est. · year 1
- Rental income
- $21,060
- − Mortgage interest
- −$9,243
- − Property taxes
- −$2,725
- − Insurance
- −$825
- − Repairs & maintenance
- −$1,685
- − Management
- −$1,685
- − Depreciation
- −$4,800
- Taxable income
- $98
- Est. tax owed @ 24.0%
- −$24
- After-tax cash flow
- $2,681/yr
For passive investors: Depreciation is non-cash, so a rental often shows a tax loss while cash-flowing — sheltering income. Rental losses are passive: they offset passive income freely, and up to $25,000/yr can offset ordinary (W-2) income if you actively participate and your MAGI is under $100k (phasing out to $0 by $150k); unused losses carry forward. On sale, claimed depreciation is recaptured at up to 25%, and gains may owe capital-gains tax (a 1031 exchange can defer both). Figures are a year-1 estimate at your 24.0% rate — not tax advice; consult a CPA.
Schools (NCES district)
- District
- Lubbock ISD
- NCES district ID
- 4828500
- Math proficiency
- 36% ▼ -8.00%
- Reading proficiency
- 39% ▼ -1.00%
- Median HH income
- $39,820
- Composite
- 31.44/100
- National rank
- #5984
- State rank
- #481 of 826 in TX
Livability — Lubbock
- Score
- 80/100
- State rank
- #37
- US rank
- #1749
Category grades
Schools grade is shown separately in the Schools card above.
Census & demographics
- Census place
- Lubbock, TX
- County
- Lubbock County · 293,542 people
- City population
- 283,030
- Metro
- Lubbock, TX
- Population (ZIP)
- 17,596
- Household income
- $49,057
- Rent vs Own
- Severe rent burden
- 1330.0
Population outlook (Lubbock County) Hauer SSP2
- Today (2025)
- 345,960 people
- By 2030
- 371,449 · +7.4%
- By 2040
- 424,539 · +22.7%
- By 2050
- 481,150 · +39.1%
- By 2075
- 633,467 · +83.1%
- By 2100
- 746,853 · +115.9%
Race, ethnicity, and origin ACS 2023
- Neighborhood character
- Diverse neighborhood (Simpson 0.62)
- Race & ethnicity
- White 47% Hispanic / Latino 39% Two or more races 21% Black 9% Asian 1%
- Hispanic origin (detail)
- Mexican 30%
- Common ancestry
- Slovak 2% Serbian 1% Italian 1%
- Foreign-born
- 3% · Canada, China
- Languages at home
- 82% English-only · Spanish 16%
Political lean MEDSL · Lubbock
- 2024 margin
- Solid R (+39.5) · D 29.7% · R 69.2% · Other 1.0%
- 2008→2024 swing
- -2.8pp toward R · 2008: -36.7pp · 2024: -39.5pp
- All cycles
- 2024: R+39.5 2020: R+32.2 2016: R+38.4 2012: R+40.9 2008: R+36.7
Not yet ingested
- Civics
- —
Market trends
- HPI YoY
- ▼ -95.31%
- Current HPI
- 247.7963
- Rent YoY
- ▲ 0.56%
- Metro
- Lubbock, TX
- State GDP YoY
- ▲ 3.95%
- F500 in state
- 110
Industry mix (Fortune 500 HQ in TX)
| Industry | F500 HQs | Revenue |
|---|---|---|
| Energy | 16 | $1,198B |
|
||
| Technology | 5 | $198B |
|
||
| Engineering / Construction | 4 | $72B |
|
||
| Energy Services | 3 | $60B |
|
||
| Utilities | 3 | $41B |
|
||
| Healthcare | 2 | $330B |
|
||
Price history
4 events — show timeline
- 2026-04-07 Pending — LARMLS
- 2026-03-19 Listed $165,000 LARMLS
- 2006-10-03 Sold (Public Records) — Public Records
- 2006-09-08 Sold (Public Records) — Public Records
Property tax history
+5.7%/yrLatest (2025): $2,725 · -7.0% YoY. Source: county tax records.
Cash-flow waterfall
monthlySold comps — $/sqft
last 12 mo · ≤1 miLoading sold comps…