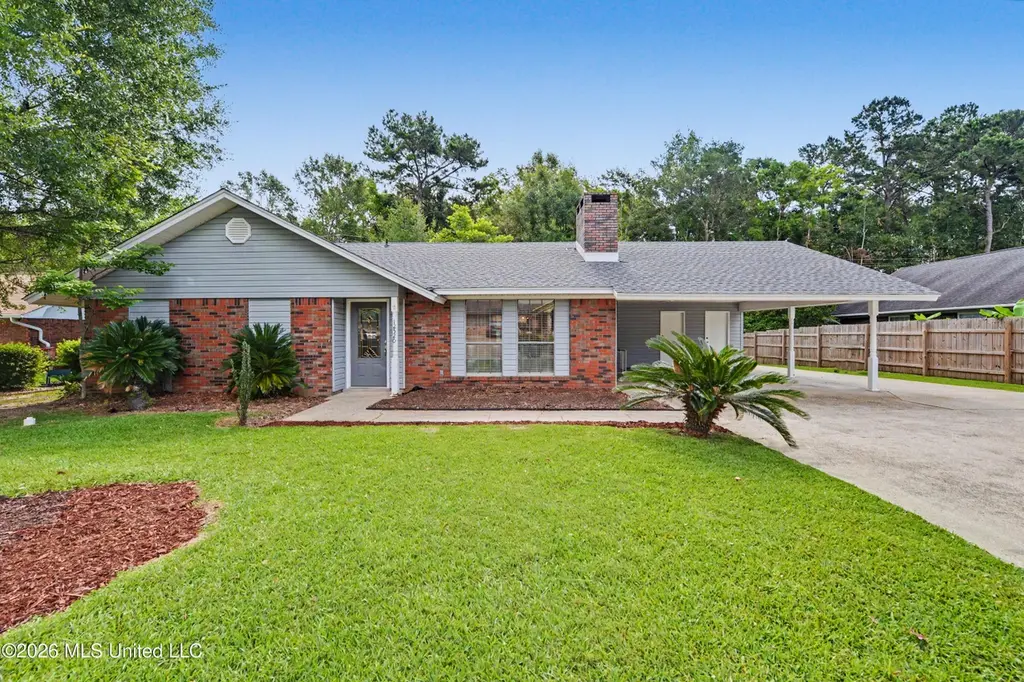
12520 Depew Rd · Gulfport, MS
Flood risk 1/10 · Minimal
- FEMA flood zone
- X (unshaded)
- Chance of flooding over 30 yrs
- 0.0%
- Est. flood insurance / yr
- $507 – $1,088
Fire risk 4/10 · Minor
- Est. fire insurance / yr
- $1,241 – $2,305
Heat risk 10/10 · Severe
- Hot days now (above 107°F)
- 7 days/yr
- Hot days in 30 yrs
- 21 days/yr
Wind risk 9/10 · Severe
- Chance of severe wind over 30 yrs
- 99.0%
Air-quality risk 1/10 · Minimal
- Unhealthy air days now
- 0 days/yr
- Unhealthy air days in 30 yrs
- 0 days/yr
Risk factors via First Street. Map © Google.
Why this score? — see what drove the D- grade
The composite is a weighted blend of 9 inputs, each scored 0–100. Each bar is that input's sub-score; the figure is the points it added to the 100-point composite (weight × sub-score).
- Cash flow +11.4/30.0
- ARV discount +4.3/15.0
- Rent growth +4.2/5.0
- Schools +4.2/10.0
- Livability +3.7/5.0
- DSCR +3.4/10.0
- 1% rule +3.3/10.0
- Condition / age +2.5/5.0
- Appreciation +0.0/10.0
$179,600
🖨 Deal sheet (PDF) 📄 Offer letter ✓ Due diligence
Listing remarks
Conveniently located with easy access to I-10, shopping, dining, and everyday amenities. Recent updates include a new roof on the home, new roof on the detached garage/outbuilding, and a 2024 HVAC system. Located in an X flood zone where flood insurance is not required. Features include a fireplace, covered back porch, fenced backyard, large concrete driveway, and detached garage/outbuilding offering additional storage, workspace, or hobby space.
Key facts
- 2024 hvac system
- Fenced backyard
- New roof
Tags
Property features AI
Exterior
- Parking: Detached garage (1 space); Carport (1 space); Driveway parking; Lighted and paved parking; Concrete surfaces; Direct access; Total parking for up to 8 vehicles
- Utilities: Public water; Public sewer; Electricity connected; 120/240 outlet(s); Central heating and central air; Fireplace provides supplemental heat; Ceiling fans for cooling
- Home design: Single-family house; One story; Move-in ready
- Construction: Brick construction; Shingle roof; Slab foundation; Built in (assessor-sourced year)
- Exterior features: Private yard; Stone/tile patio or porch; Chain-link fencing in back yard; Garage(s), outbuilding and storage
Interior
- Kitchen: Dishwasher; Disposal; Electric cooktop; Range hood; Refrigerator
- Bathrooms: 2 full bathrooms
- Interior features: Cathedral ceilings; Ceiling fans; Blinds; Dead bolt locks; Wood-burning fireplace in the living room
- Laundry & utility: Inside laundry room with washer hookup
Neighborhood map
What this means for you Summary
Snapshot
- This is a 3-bed/1.0-bath single-family listed at $180k.
Deal economics
- At list price, monthly cash flow is $-61 ($-730/yr) — negative.
- To cash-flow at today's rent, offer at most $171k (4.9% below list).
- To meet the 1% rule (rent ≥ 1% of price), the offer needs to be $149k (16.8% below list).
- Recommended offer: $149k (16.8% below list) — sets the bar for 1% rule.
Location & tenants
- Location reads 73/100 on livability (#15 in MS) — a middle-class / working-renter tenant base. Strengths: cost of living A+, housing A+, health & safety A+; Watch: schools D, amenities F, commute F.
- Harrison County School District (rural): math 52% / reading 46% proficiency, ranked #14 of 130 in MS (top 11%) — families likely to look elsewhere, expect single-tenant / working-renter base with shorter leases; 62% free/reduced lunch — lower-income household profile, screen leases tightly.
- Market conditions: Rents rising fast (+7.0%/yr); 770 active listings in the ZIP; 12 comparable units currently listed for rent nearby; rentals lingering (median 46d on market — plan ~5-8 weeks vacancy on turnover, expect pricing pressure); 50% of comp listings sitting > 30 days — soft ceiling on asking rent; 2,194 units permitted in Harrison County in 2024 (0 in 5+ unit buildings).
Forward outlook
- Local home prices are declining (-3.0%/yr); year-one equity from $1k of loan paydown is wiped out by about $5k of value loss. Plan a longer hold.
- Harrison County population projected at +27% by 2050 — long-run rental-demand tailwind backs the buy-and-hold thesis.
Negotiation context
- Only 4 days on market — expect competitive offers; lowballing is unlikely to land.
Risks & watch-outs
- Climate carrying-cost: severe wind risk, 99% chance of damaging wind over 30y; extreme-heat days projected 7→21/yr by 2055 (HVAC capex compounding) — expect insurance premiums to compound above CPI over the hold.
Questions for the listing agent
- What do current leases actually rent for vs. the listed asking? Can we see a recent rent roll and the last 12 months of T-12 income?
- Built in 1979 — when were the roof, HVAC, electrical panel, plumbing, and water heater last replaced?
- Is there a deadline driving the sale (1031 exchange, divorce, estate, relocation)? That informs how much negotiation room exists.
- Schools are D-rated, which usually means shorter tenancies and higher turnover. Who's the typical renter profile here, and what's been the actual vacancy rate?
- The area grade is low — what's the realistic commute time and amenity access for the typical tenant pool here? Any planned neighborhood developments (good or bad) we should know about?
- What's the average days-on-market for RENTAL listings here right now (not sales)? A rising rental-DOM trend means longer vacancies and softer asking-rent achievability than the comps imply.
- What's the recent tenant-quality profile in this submarket — average credit score on applications, eviction rate, late-payment / NSF rate, and stable-employment percentage? A property-management company in the area should have these aggregated.
- How much new for-sale + rental construction is in the pipeline within 1–3 miles? Heavy new supply typically softens prices + rents 12–24 months out; constrained supply supports both.
Investment metrics
- 1% rule
- 0.83% ✗
- Cap rate
- 5.89%
- Cash-on-cash
- -1.45%
- DSCR
- 0.94
- GRM
- 10.0
CMA / ARV
- ARV (on-the-fly)
- $167,720
- Comps found
- 10
Show comp detail 10 sales within ~0.75 mi
| Address | Dist | Beds/Ba | Sqft | Sold | Price | $/sf | Match |
|---|---|---|---|---|---|---|---|
| 15355 Northwood Hills Dr | 0.26mi | 3/2.0 | 1,274 (+6%) | 1mo | $199,888 | $157 | 72 |
| 12433 Red Fox Dr | 0.39mi | 3/2.0 | 1,271 (+6%) | 2mo | $175,000 | $138 | 66 |
| 15303 Northwood Hills Dr | 0.22mi | 3/2.0 | 1,294 (+8%) | 8mo | $150,900 | $117 | 66 |
| 15051 Sagewood St | 0.57mi | 3/2.0 | 1,272 (+6%) | 4mo | $189,999 | $149 | 55 |
| 12510 Red Fox Dr | 0.37mi | 3/1.0 | 1,271 (+6%) | 22mo | $178,000 | $140 | 54 |
| 15114 Sagewood St | 0.47mi | 3/2.0 | 1,248 (+4%) | 21mo | $150,000 | $120 | 49 |
| 15116 N Parkwood Dr | 0.39mi | 3/2.0 | 1,280 (+7%) | 21mo | $210,000 | $164 | 49 |
| 15098 Sagewood St | 0.49mi | 3/2.0 | 1,330 (+11%) | 14mo | $175,000 | $132 | 43 |
| 15090 Sagewood St | 0.50mi | 3/2.0 | 1,362 (+14%) | 17mo | $203,000 | $149 | 35 |
| 15676 S Parkwood Dr | 0.69mi | 3/2.0 | 1,352 (+13%) | 24mo | $185,000 | $137 | 23 |
Match score weights: distance 35% · size 25% · config 20% · recency 20%. Top-matched comps best support the ARV.
Projected returns pro-forma
-3.0% appreciation · 6.99% rent growth · sell at horizon
- IRR
- -14.3%
- Equity multiple
- 0.47×
- Total profit
- $-26,718
- Equity at exit
- $26,779
- IRR
- -0.1%
- Equity multiple
- 0.99×
- Total profit
- $-369
- Equity at exit
- $15,529
Cash invested: $50,288 (down + closing). Projections, not guarantees.
Landlord ↔ Tenant lean methodology
- Overall (STATE)
- 90 Strongly Landlord-Friendly
- State Mississippi
- 90 Strongly Landlord-Friendly · R+11
- County
- — inherits STATE
- City
- — inherits STATE
ZIP-level market 39503
- Home prices YoY
- -21.5%
- Rents YoY
- 7.0%
- Active inventory
- 770
- Price-to-rent
- 10.0×
Monthly cashflow live
- Estimated rent
- $1,494 high interval (Pro) →
- Mortgage (P&I)
- −$942
- Tax est. 1.5%
- −$224 /mo · $2,694/yr
- Insurance
- −$75
- HOA
- −$0
- Vacancy / Maint / Mgmt
- −$314
- Net cashflow
- $-61
Break-even live
Sensitivity live
| Price | -10% $63 | -5% $1 | +0% $-61 | +5% $-123 | +10% $-185 |
|---|---|---|---|---|---|
| Rent | -10% $-179 | -5% $-120 | +0% $-61 | +5% $-2 | +10% $57 |
| Rate | -1.0pp $30 | -0.5pp $-15 | base $-61 | +0.5pp $-107 | +1.0pp $-155 |
UW: 25.0% down · 7.5% · 30yr · 1.5% tax · 5.0% vac · 8.0% maint · 8.0% mgmt
Financing live
Cash to close
- Down payment
- $44,900
- Closing costs
- $5,388
- Reserves months
- —
- Total cash needed
- —
Loan-product check · same deal, 3 products live
Conventional
25% down · 7.5% · 30yr
- Down + closing
- —
- Monthly P&I
- —
- Monthly cashflow
- —
- DSCR
- —
- Eligible?
- —
Personal DTI + credit; lowest rate.
DSCR
20% down · 8.5% · 30yr
- Down + closing
- —
- Monthly P&I
- —
- Monthly cashflow
- —
- DSCR
- —
- Eligible?
- —
No personal income docs; deal must DSCR.
Hard money
10% down · 12.0% · 12mo
- Down + closing
- —
- Monthly P&I
- —
- Monthly cashflow
- —
- DSCR
- —
- Eligible?
- —
Short-term bridge; refi at stabilization.
Rent comps 12 comps
| Address | Beds | Baths | Sqft | Rent | $/sqft | DOM | Units | Dist |
|---|---|---|---|---|---|---|---|---|
| 15235 Oneal Rd Gulfport, MS | 2.0 | 2.0 | 1101 | $1,200 | $1.09 | 15d | 1 | 0.15mi |
| 15251 Parkwood Dr N Gulfport, MS | 3.0 | 2.5 | 1200 | $1,200 | $1.00 | 45d | 1 | 0.27mi |
| 15373 Saint Charles St Gulfport, MS | 3.0 | 1.0–3.0 | 1075 | $1,350 | $1.26 | 45d | 2 | 0.91mi |
| 12237 Vada Dr Gulfport, MS | 3.0 | 1.0 | 1350 | $1,349 | $1.00 | 15d | 1 | 1.07mi |
| 14180 Oneal Rd Gulfport, MS | 2.0 | 1.0 | 1000 | $1,100 | $1.10 | 45d | 2 | 1.19mi |
| 125 Clarence Dr Gulfport, MS | 3.0 | 2.0 | 1300 | $1,500 | $1.15 | 15d | 1 | 1.26mi |
| 11502 Camden Court Cir Gulfport, MS | 3.0 | 2.0 | 1495 | $1,775 | $1.19 | 22d | 1 | 1.26mi |
| 11413 Camden Court Cir Gulfport, MS | 3.0 | 2.0 | 1495 | $1,775 | $1.19 | 45d | 1 | 1.31mi |
| 11425 Camden Court Cir Gulfport, MS | 3.0 | 2.0 | 1495 | $1,775 | $1.19 | 22d | 1 | 1.31mi |
| 11487 Camden Court Cir Gulfport, MS | 3.0 | 2.0 | 1495 | $1,775 | $1.19 | 45d | 1 | 1.31mi |
| 11405 Camden Court Cir Gulfport, MS | 3.0 | 2.0 | 1495 | $1,775 | $1.19 | 45d | 1 | 1.31mi |
| 101 Fore St Gulfport, MS | 3.0 | 2.0 | 1215 | $1,700 | $1.40 | 15d | 1 | 1.41mi |
Listing history 4 events
-
2026-06-13statusdays on market $179,600 Pending 4 DOM
-
2026-06-10days on market $179,600 Active 2 DOM
-
2026-06-09remarks 450-char remark
-
2026-06-09$179,600 Active 1 DOM
ⓘ Source: listings_history table (triggers on properties + properties_extension) + one-shot
backfill from property_details.listing_events for pre-trigger history.
Climate risk First Street
- Flood 1/10 Low FEMA zone X (unshaded) · 0% chance over 30 yrs
- Wildfire 4/10 Moderate
- Heat 10/10 Extreme 7 d/yr ≥107°F today · 21 d/yr by 30 yrs out
- Wind 9/10 Extreme 99% chance of damaging wind over 30 yrs
- Air quality 1/10 Low 0 unhealthy d/yr today · 0 by 30 yrs out
Nearby sold comps map
Loading sold comps map…
Walkable amenities ~0.75 mi
Loading nearby amenities…
Taxation est. · year 1
- Rental income
- $17,929
- − Mortgage interest
- −$10,060
- − Property taxes
- −$2,694
- − Insurance
- −$898
- − Repairs & maintenance
- −$1,434
- − Management
- −$1,434
- − Depreciation
- −$5,225
- Taxable loss
- −$3,817
- Est. tax savings @ 24.0%
- +$916
- After-tax cash flow
- $186/yr
For passive investors: Depreciation is non-cash, so a rental often shows a tax loss while cash-flowing — sheltering income. Rental losses are passive: they offset passive income freely, and up to $25,000/yr can offset ordinary (W-2) income if you actively participate and your MAGI is under $100k (phasing out to $0 by $150k); unused losses carry forward. On sale, claimed depreciation is recaptured at up to 25%, and gains may owe capital-gains tax (a 1031 exchange can defer both). Figures are a year-1 estimate at your 24.0% rate — not tax advice; consult a CPA.
Schools (NCES district)
- District
- Harrison County School District
- NCES district ID
- 2801770
- Math proficiency
- 52% ▼ -4.00%
- Reading proficiency
- 46% ▼ -4.00%
- Median HH income
- $46,504
- Composite
- 41.66/100
- National rank
- #3419
- State rank
- #14 of 130 in MS
Livability — Gulfport
- Score
- 73/100
- State rank
- #15
- US rank
- #5010
Category grades
Schools grade is shown separately in the Schools card above.
Census & demographics
- Census place
- Gulfport, MS
- County
- Harrison County · 178,171 people
- City population
- 96,188
- Metro
- Gulfport-Biloxi, MS
- Population (ZIP)
- 55,059
- Household income
- $62,641
- Rent vs Own
- Severe rent burden
- 1686.0
Population outlook (Harrison County) Hauer SSP2
- Today (2025)
- 228,444 people
- By 2030
- 241,942 · +5.9%
- By 2040
- 267,531 · +17.1%
- By 2050
- 291,062 · +27.4%
- By 2075
- 346,711 · +51.8%
- By 2100
- 378,165 · +65.5%
Race, ethnicity, and origin ACS 2023
- Neighborhood character
- Diverse neighborhood (Simpson 0.58)
- Race & ethnicity
- White 58% Black 27% Two or more races 9% Hispanic / Latino 6% Asian 2%
- Hispanic origin (detail)
- Mexican 2% Puerto Rican 1%
- Common ancestry
- Lithuanian 5% Slovak 1% Portuguese 1%
- Foreign-born
- 3% · Canada
- Languages at home
- 95% English-only · Spanish 3%
Political lean MEDSL · Harrison
- 2024 margin
- Strong R (+28.9) · D 35.0% · R 63.9% · Other 1.1%
- 2008→2024 swing
- -2.9pp toward R · 2008: -26.0pp · 2024: -28.9pp
- All cycles
- 2024: R+28.9 2020: R+25.2 2016: R+30.7 2012: R+26.6 2008: R+26.0
Not yet ingested
- Civics
- —
Market trends
- HPI YoY
- ▼ -51.39%
- Current HPI
- 187.285
- Rent YoY
- ▲ 6.99%
- Metro
- Gulfport-Biloxi, MS
- State GDP YoY
- —
- F500 in state
- 0
Price history
2 events — show timeline
- 2026-06-08 Listed $179,600 MLSU
- 2015-06-02 Sold (Public Records) — Public Records
Property tax history
-4.1%/yrLatest (2025): $134 · +0.2% YoY. Source: county tax records.
Cash-flow waterfall
monthlySold comps — $/sqft
last 12 mo · ≤1 miLoading sold comps…